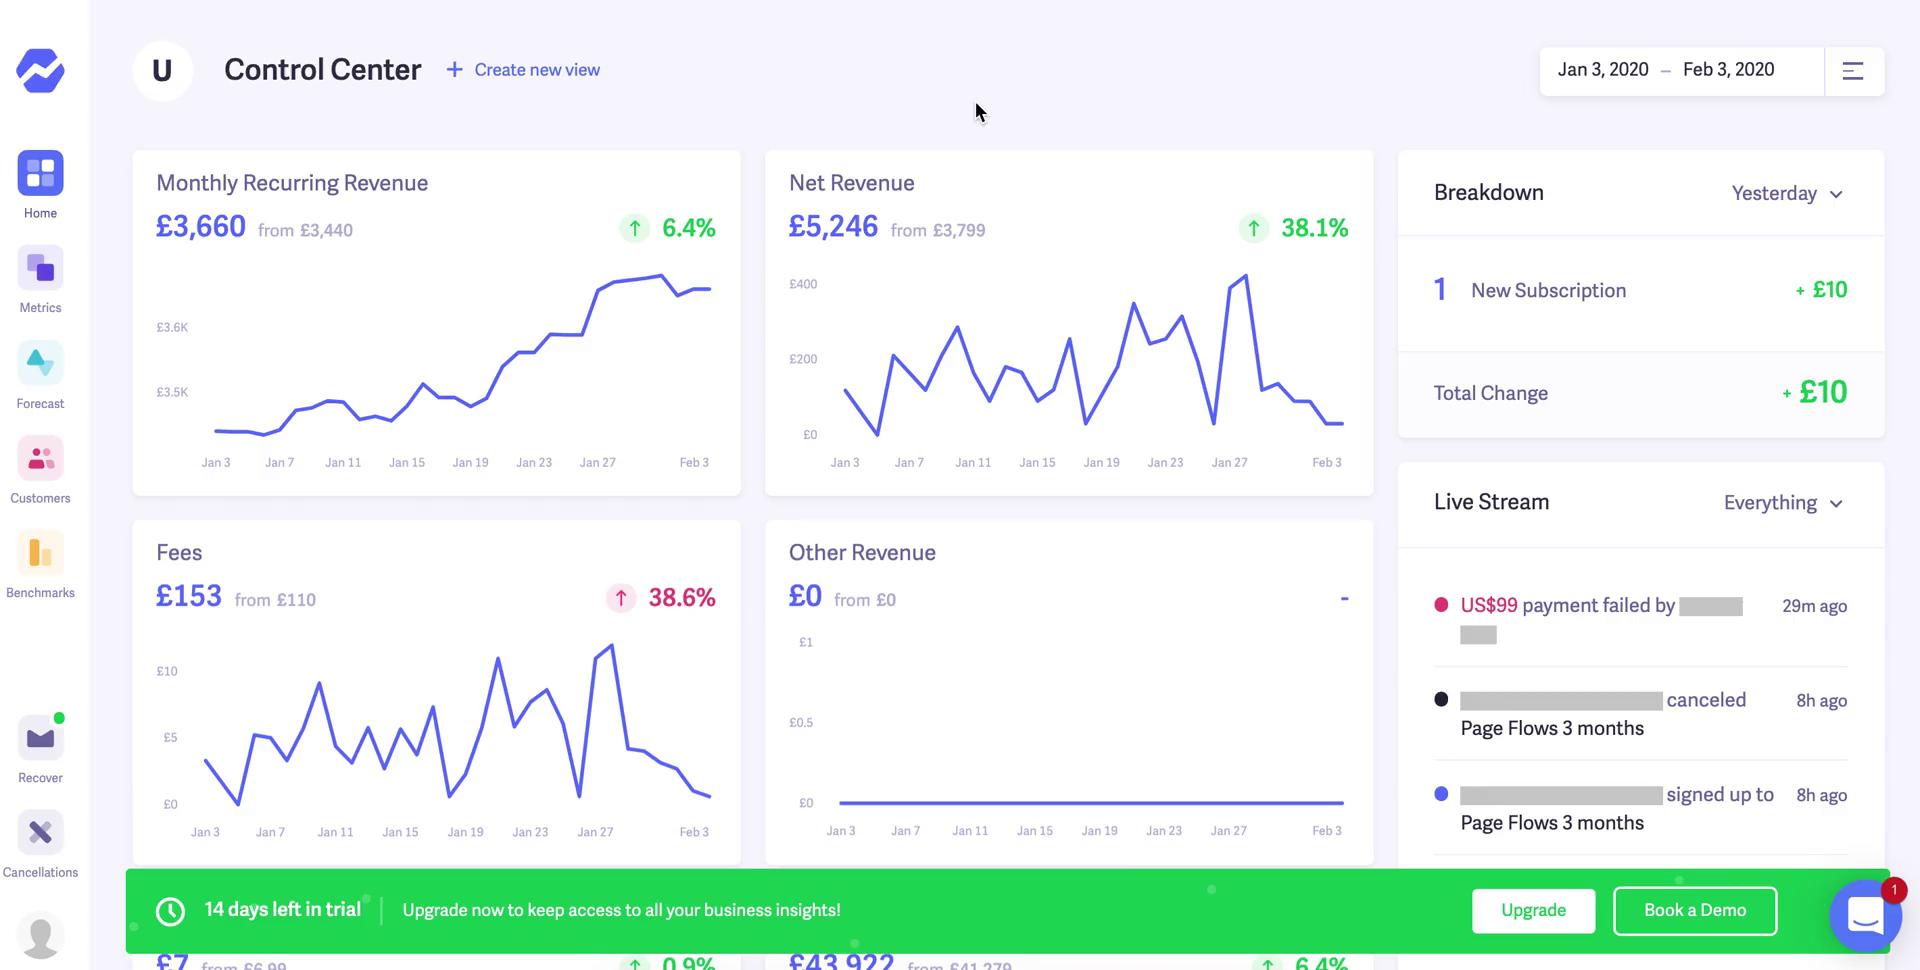
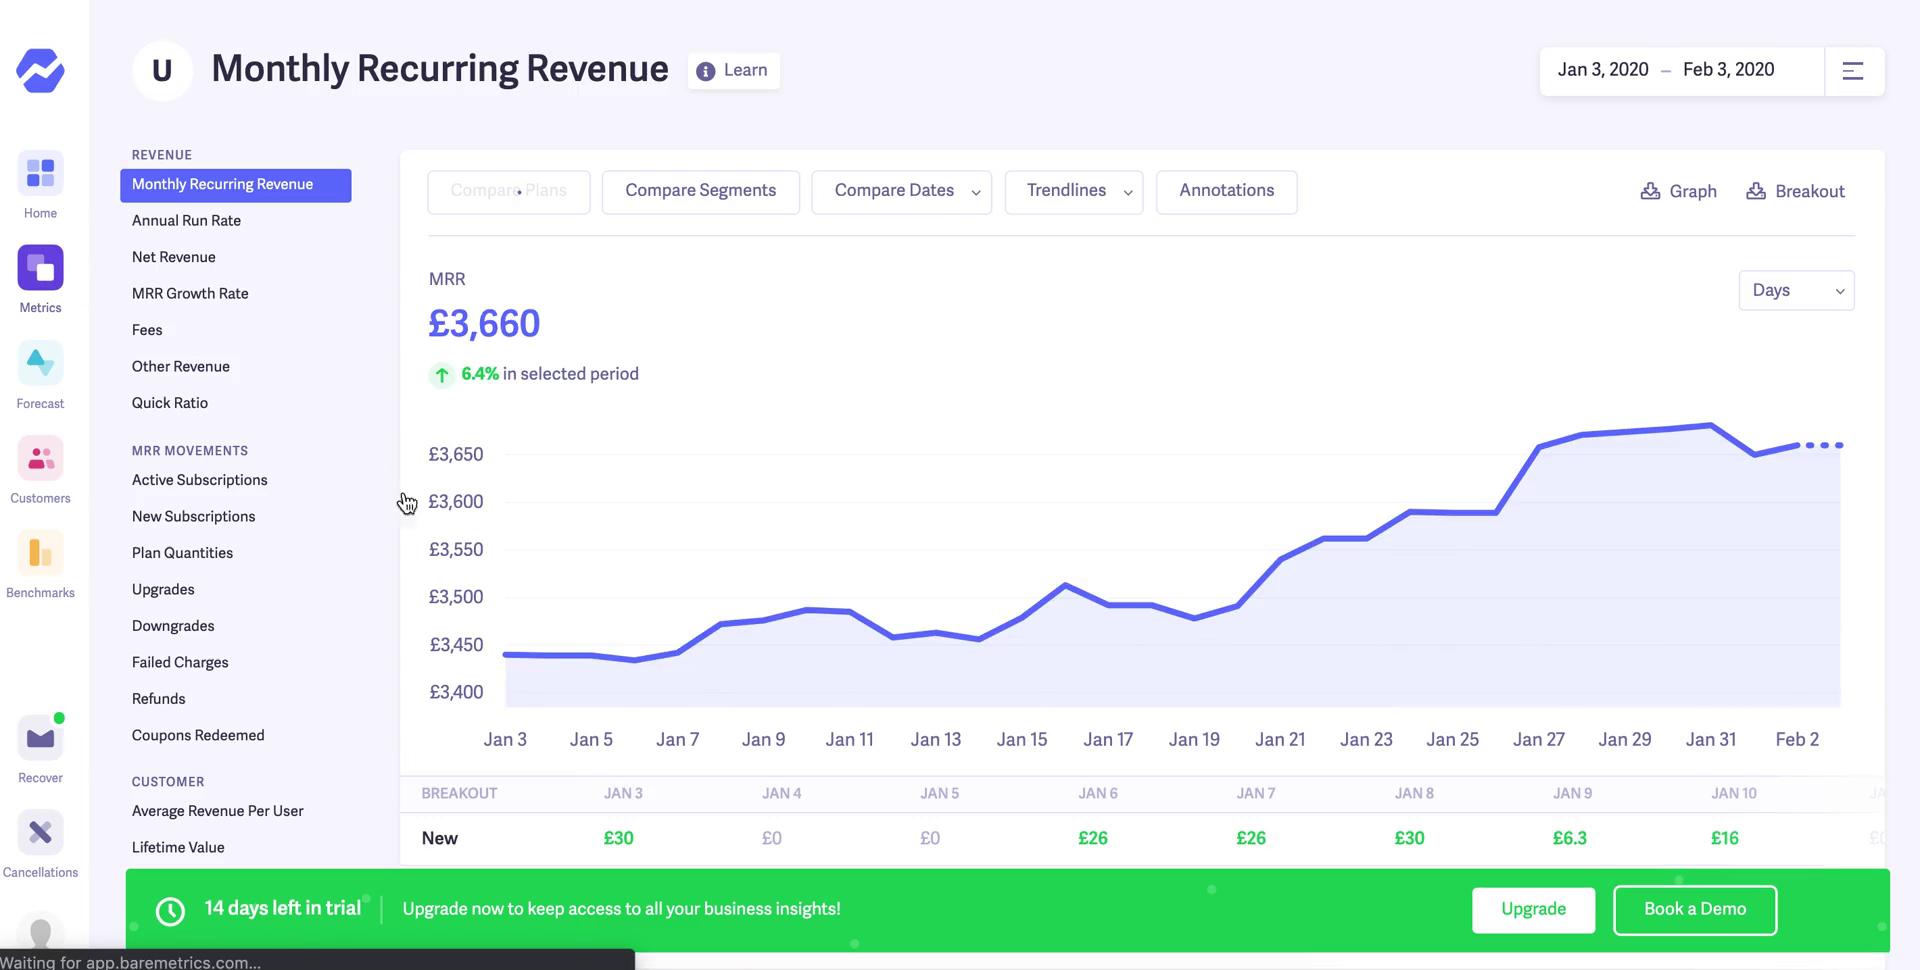
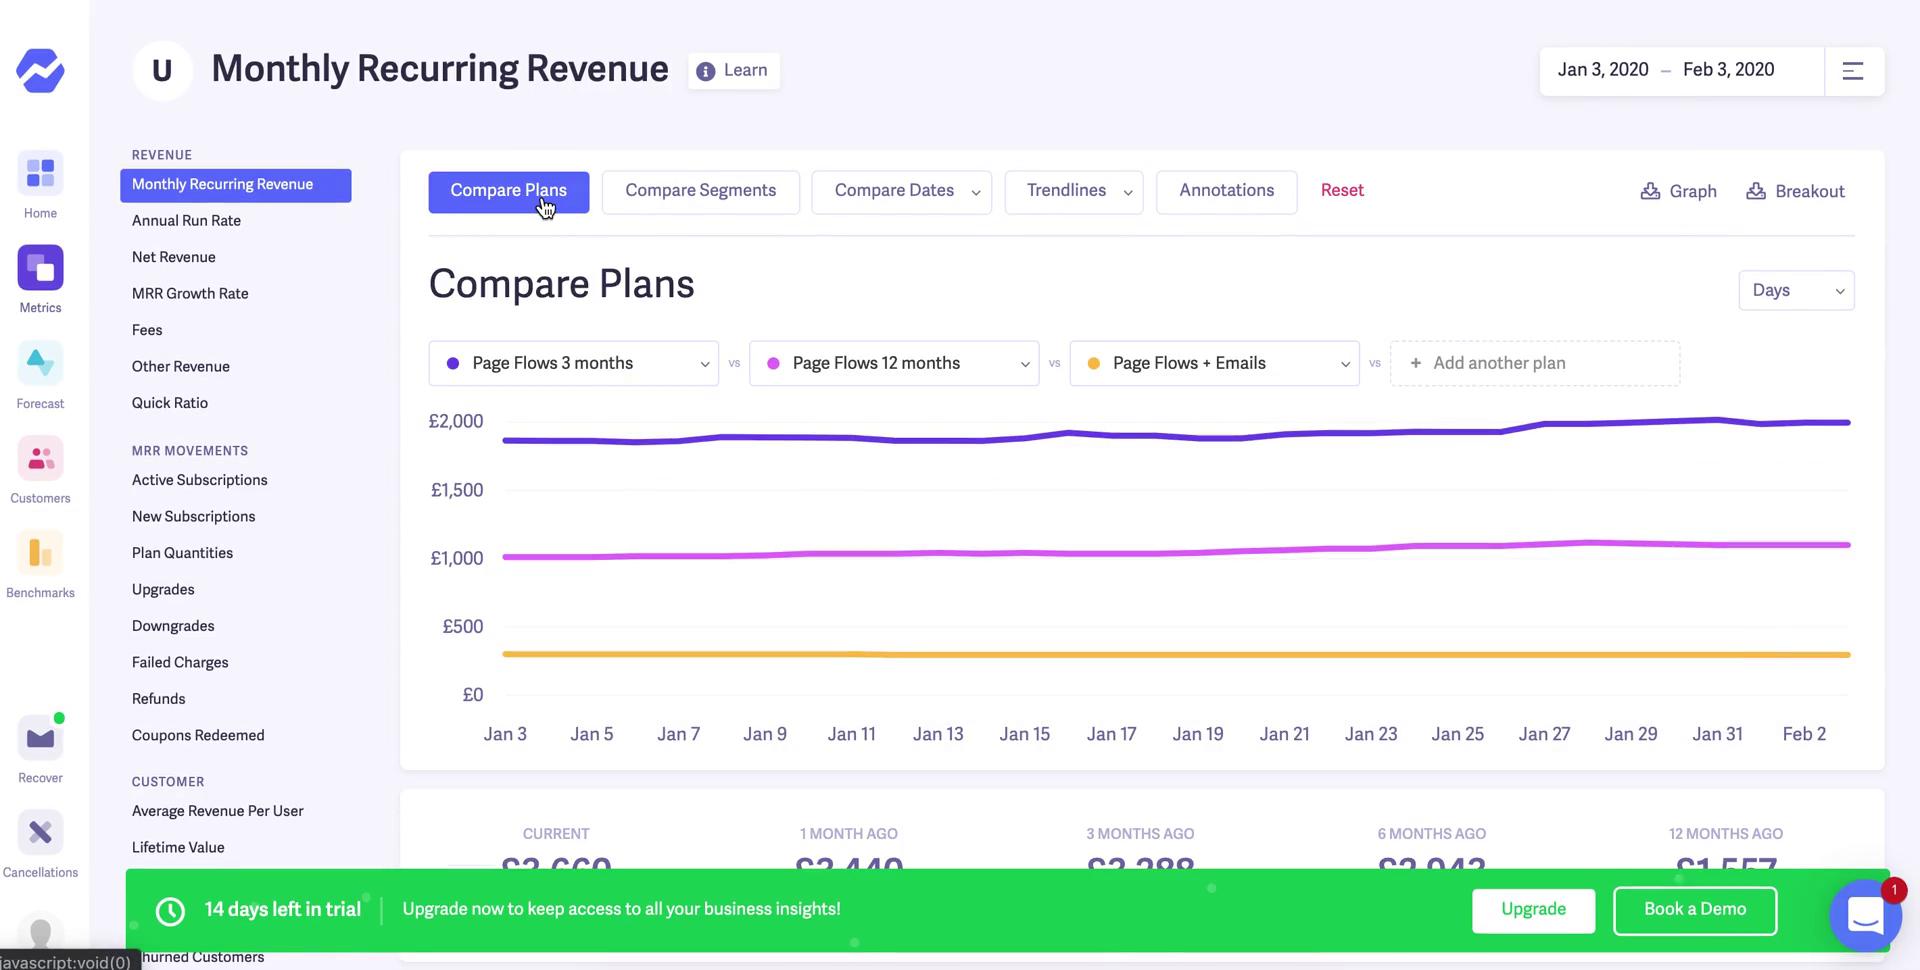
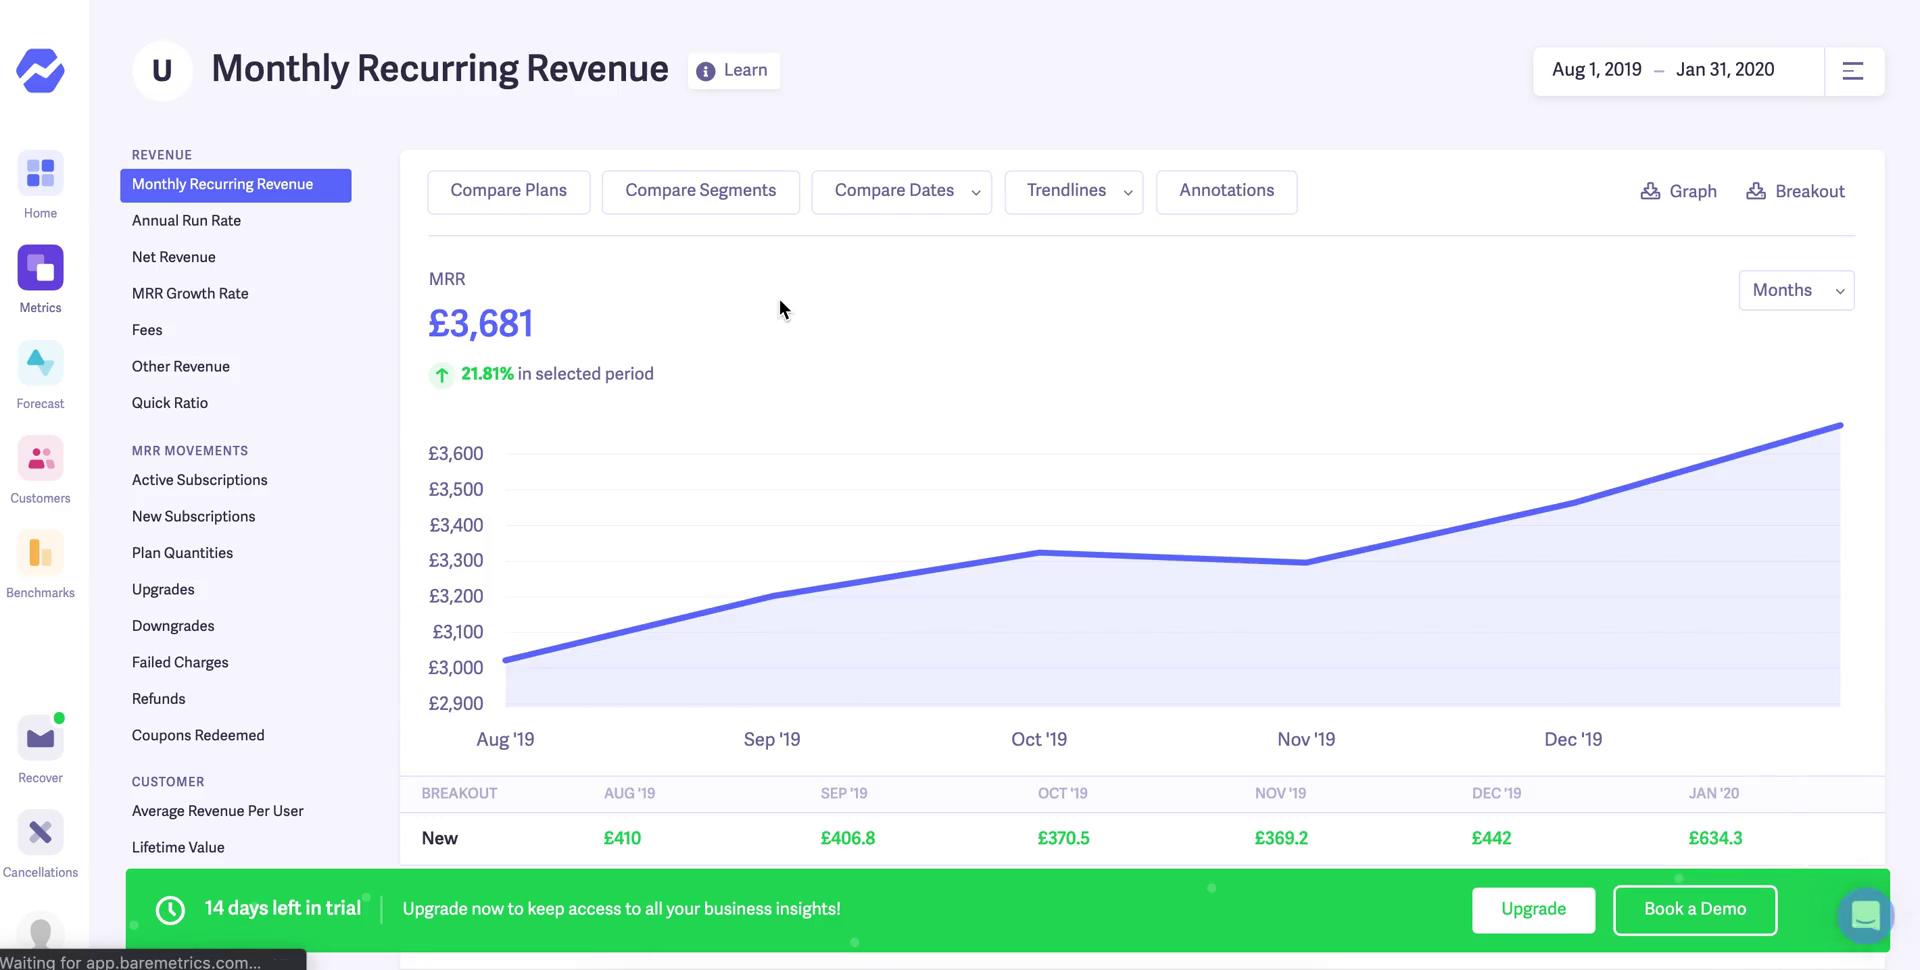
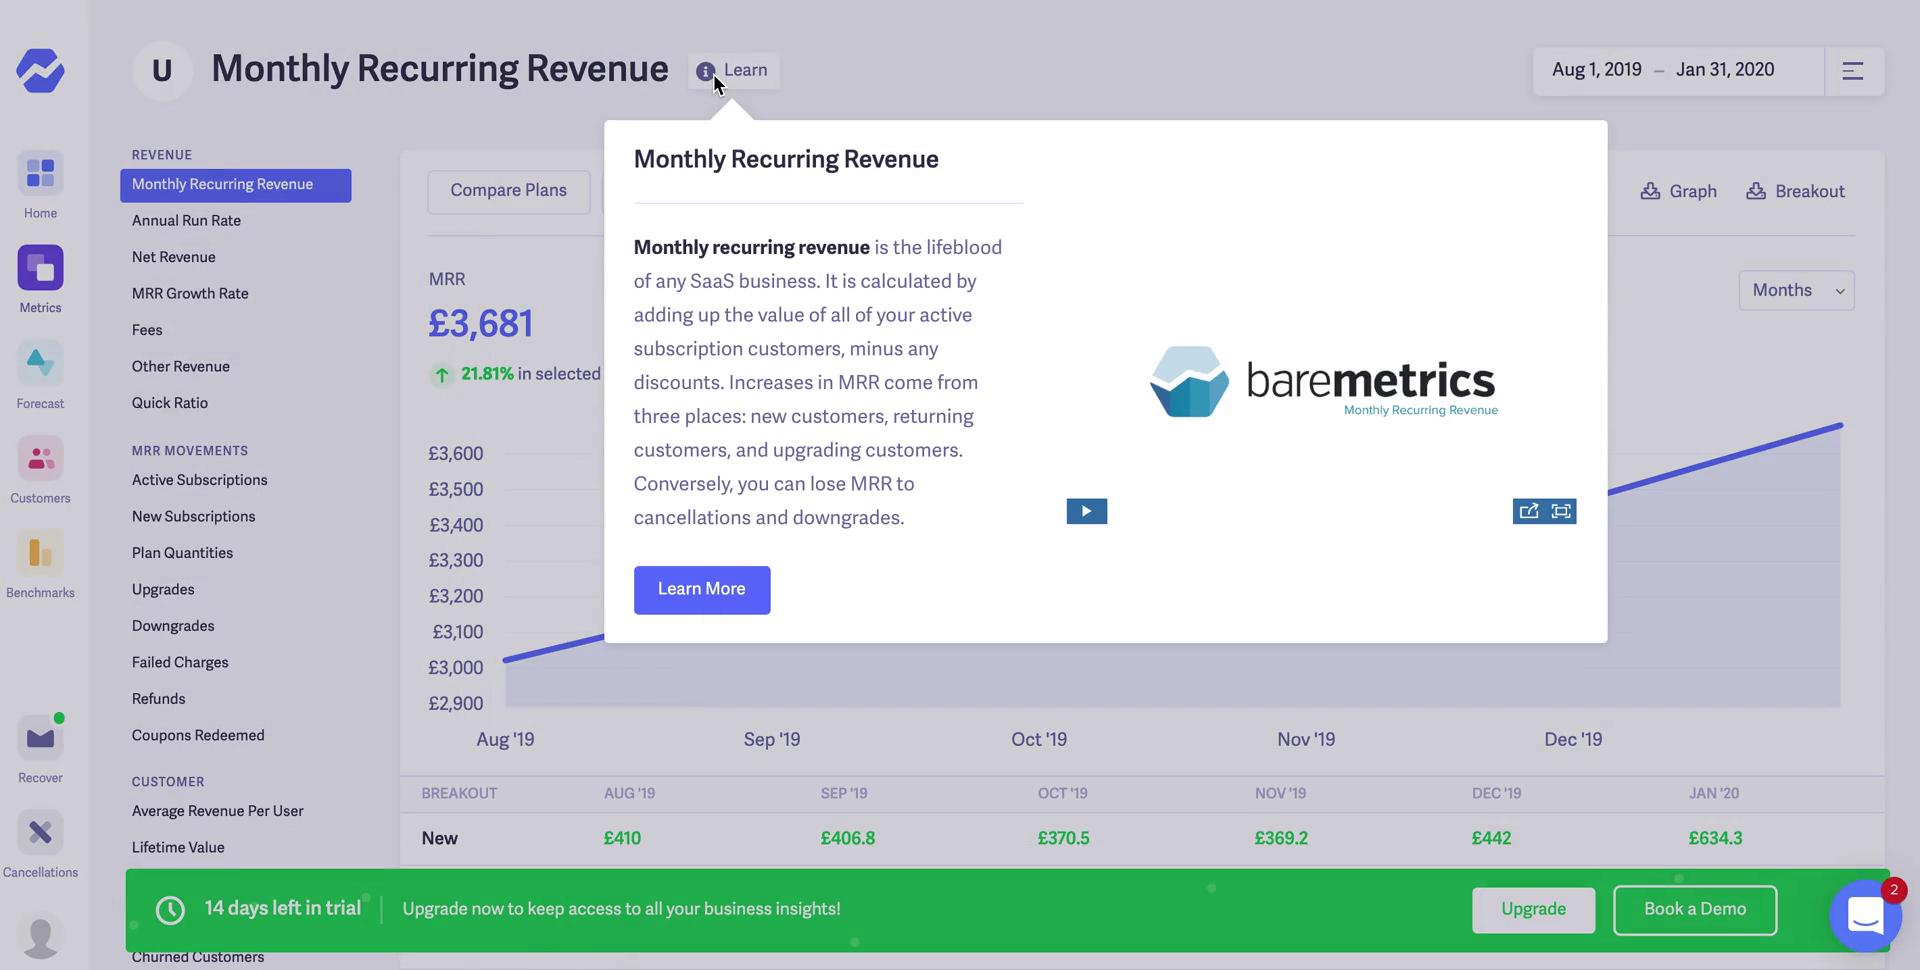
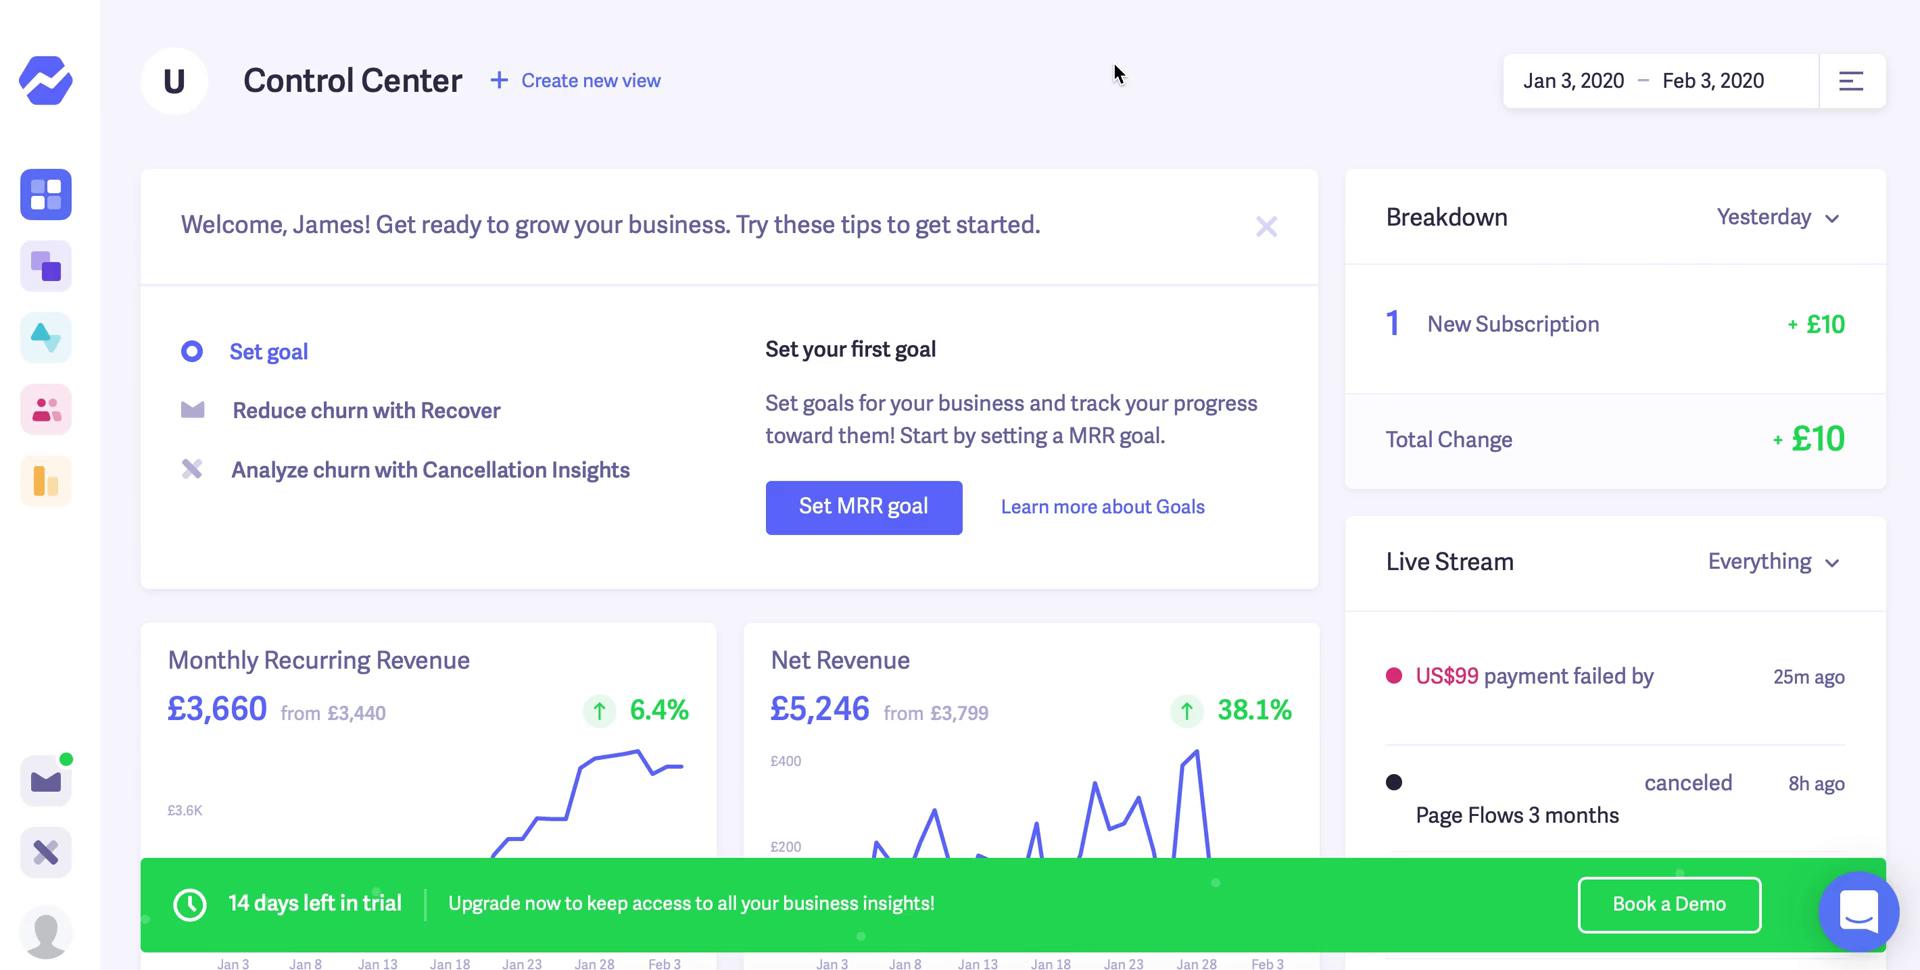
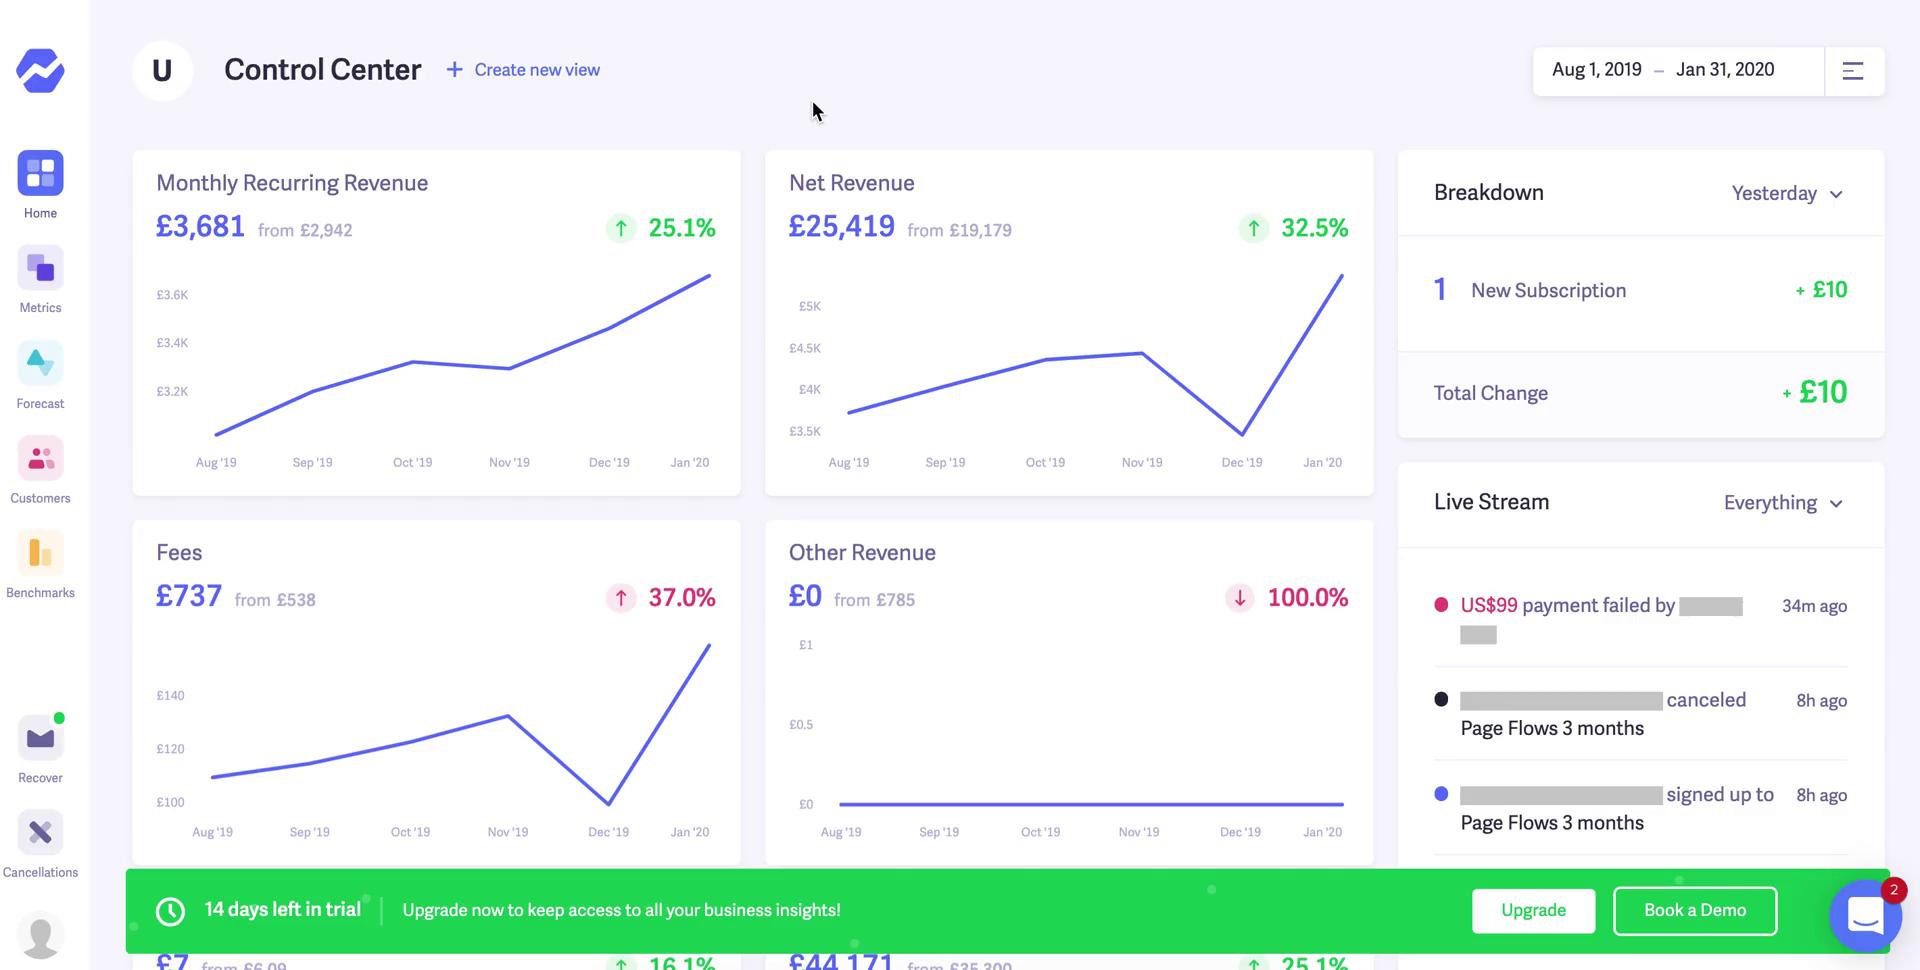
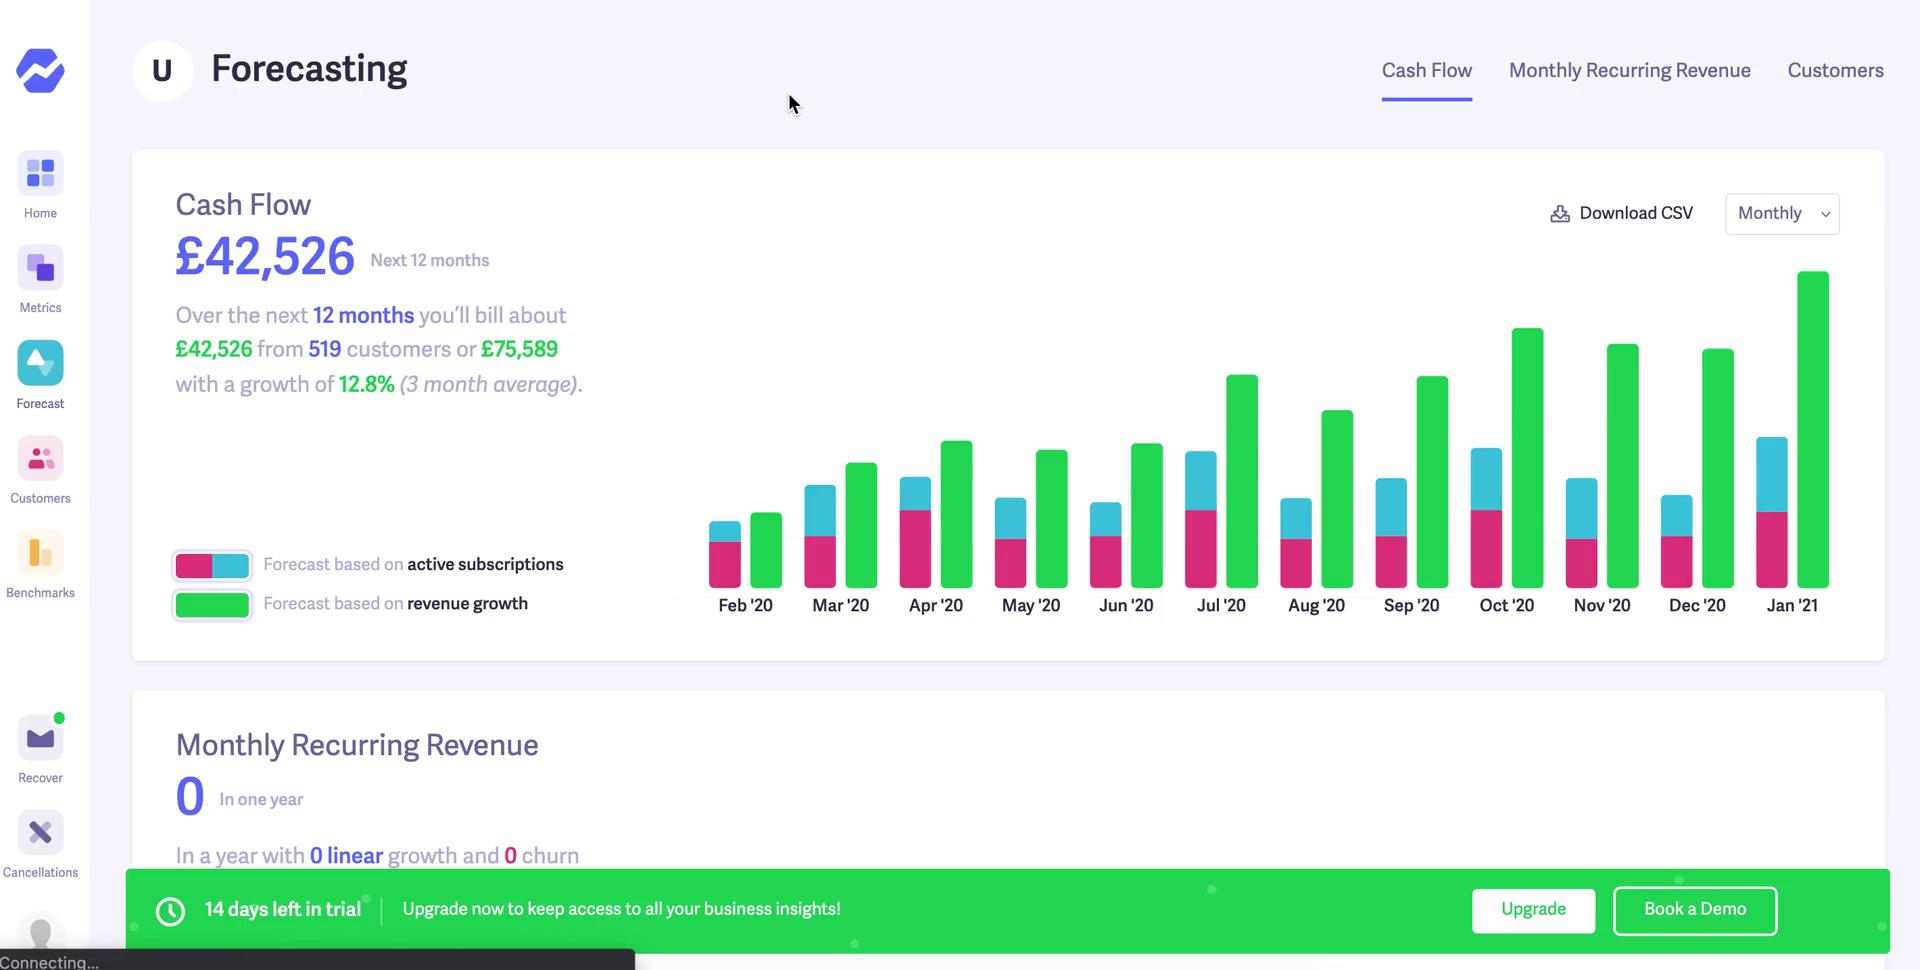
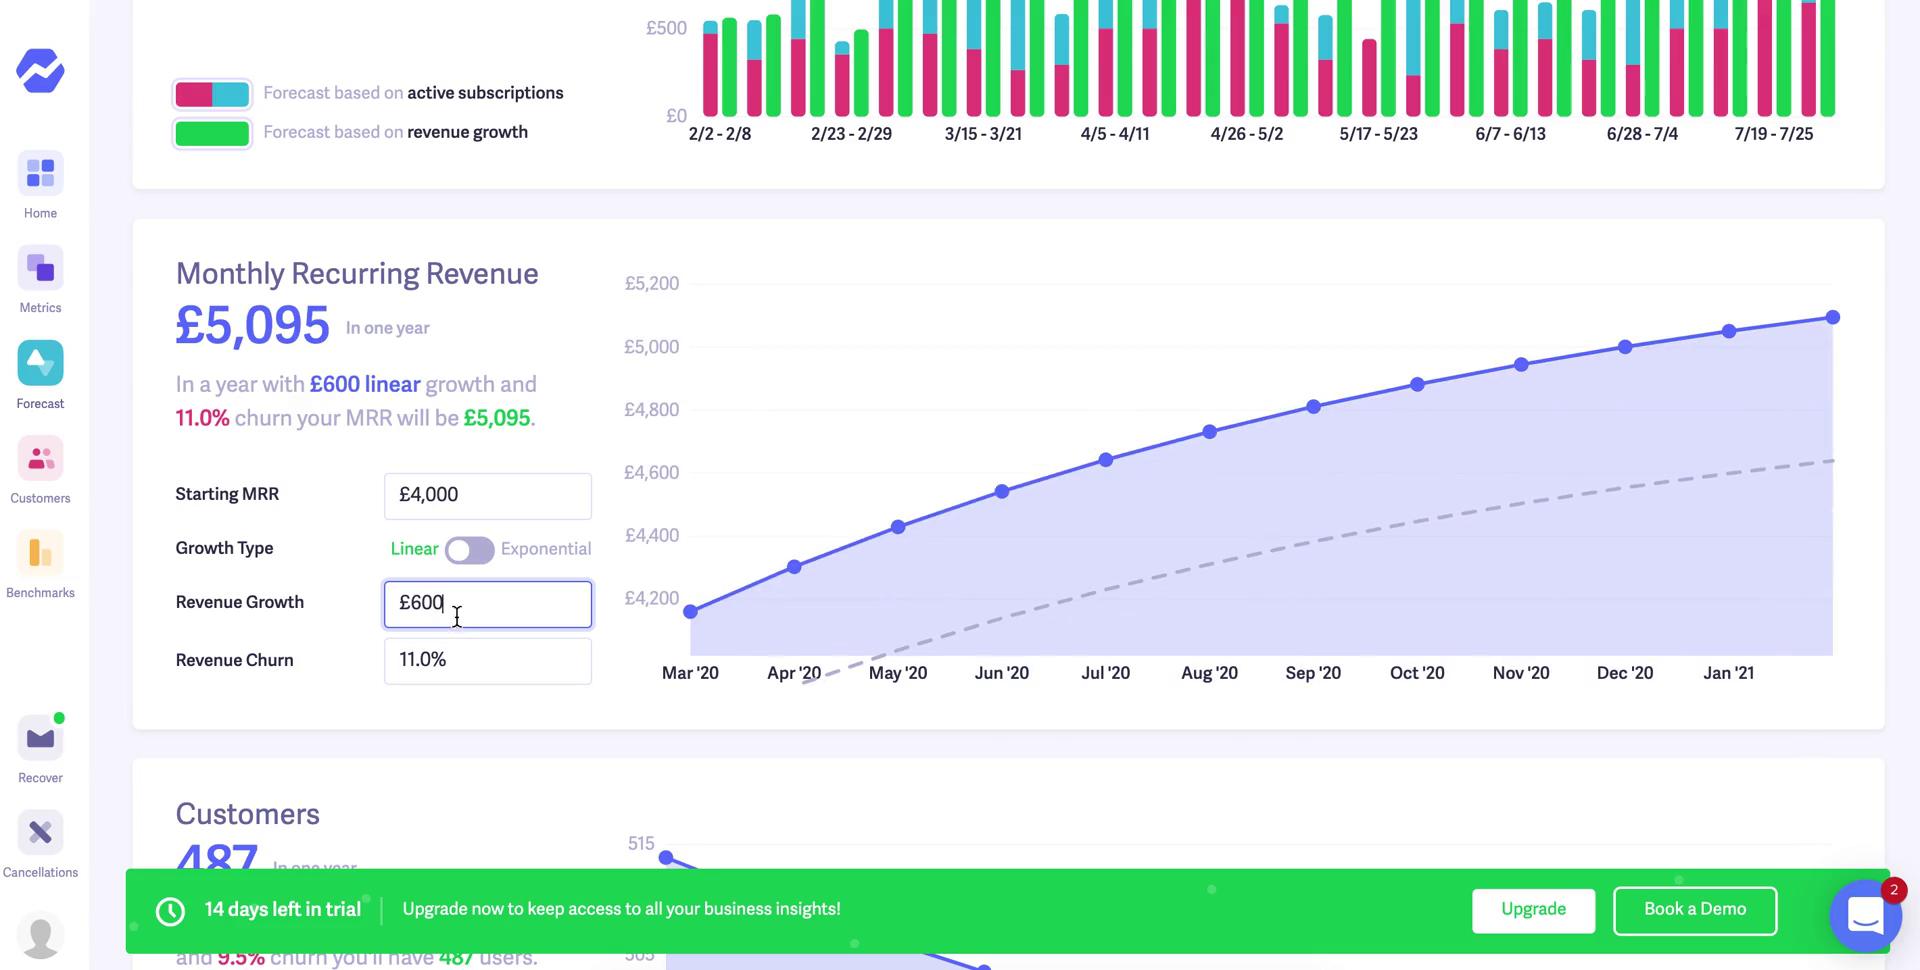
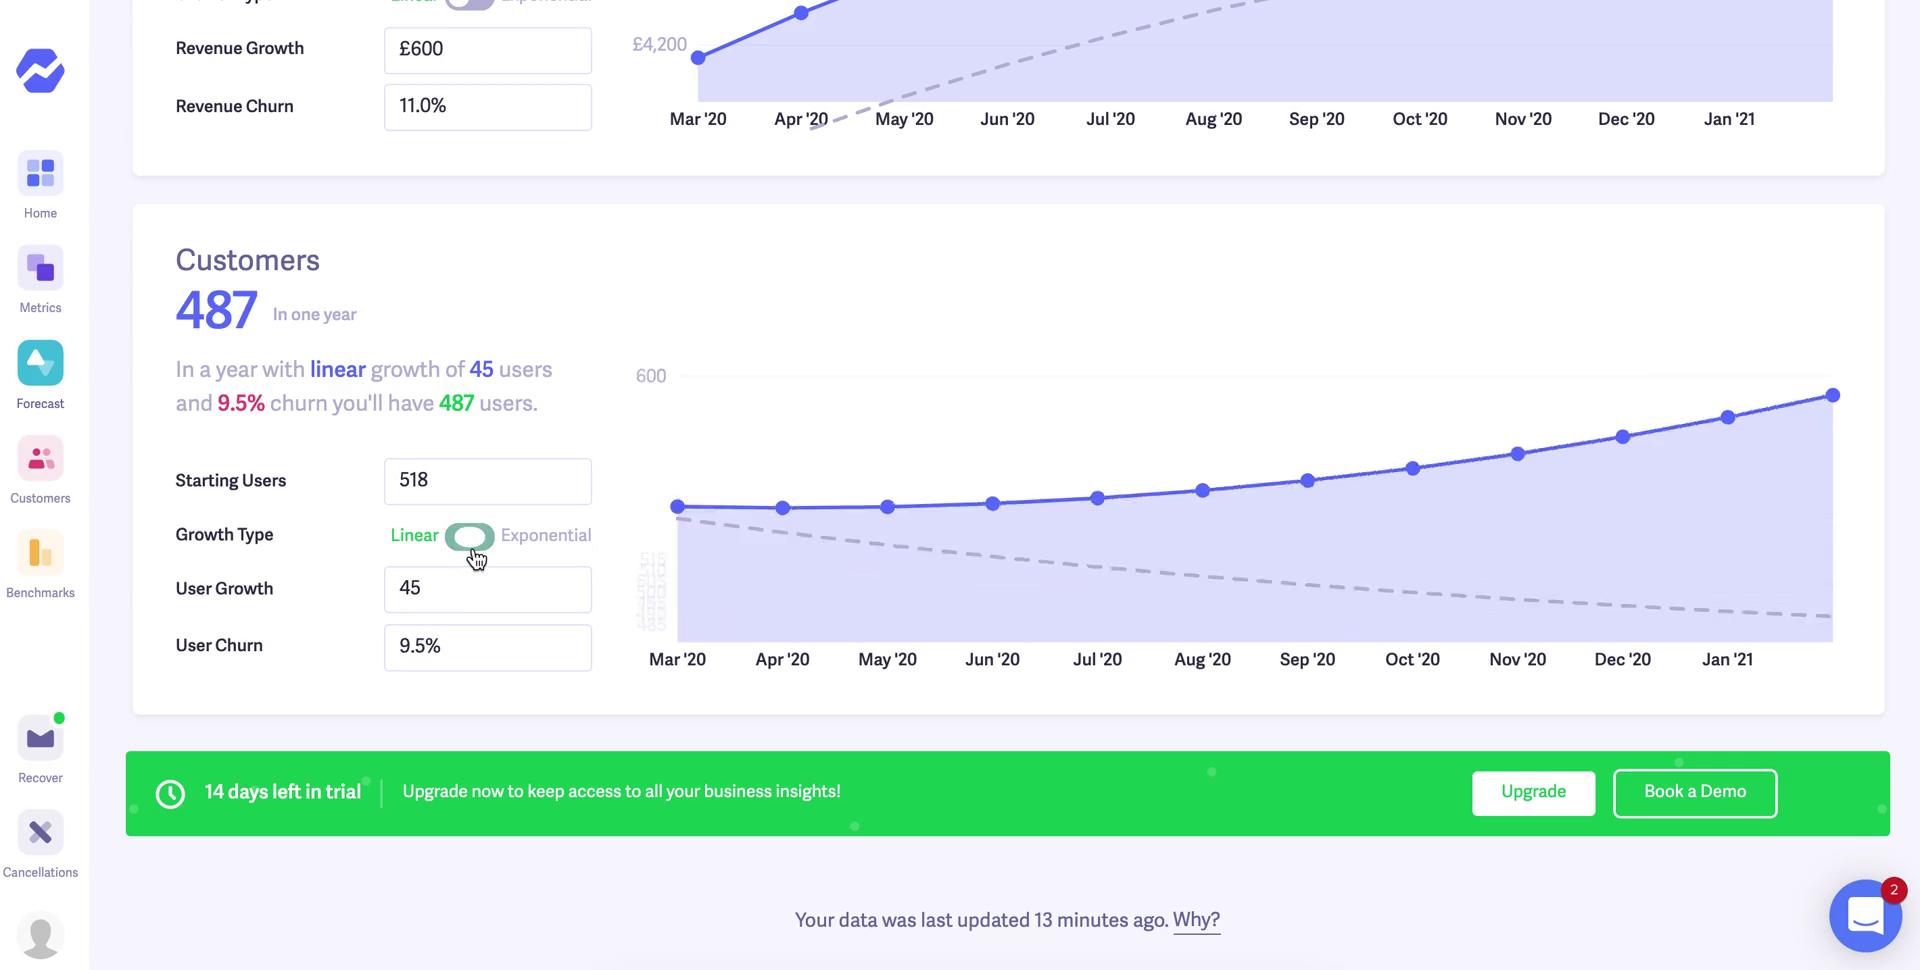
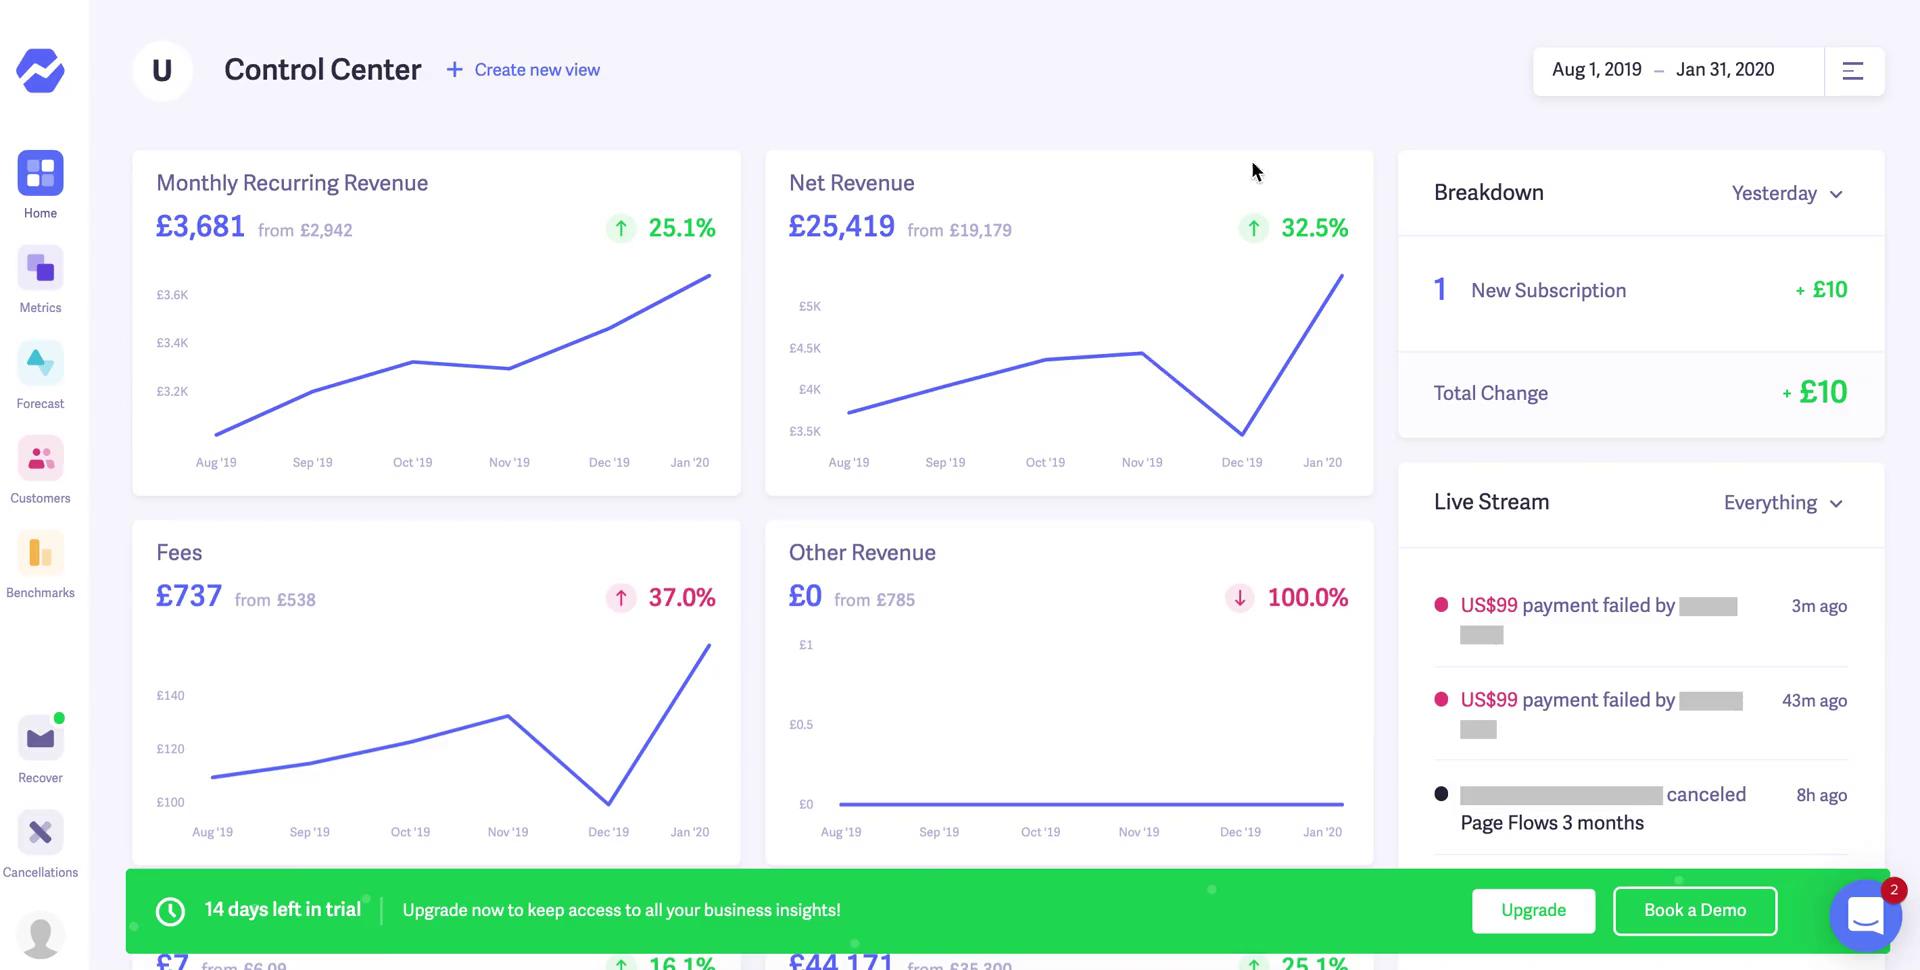
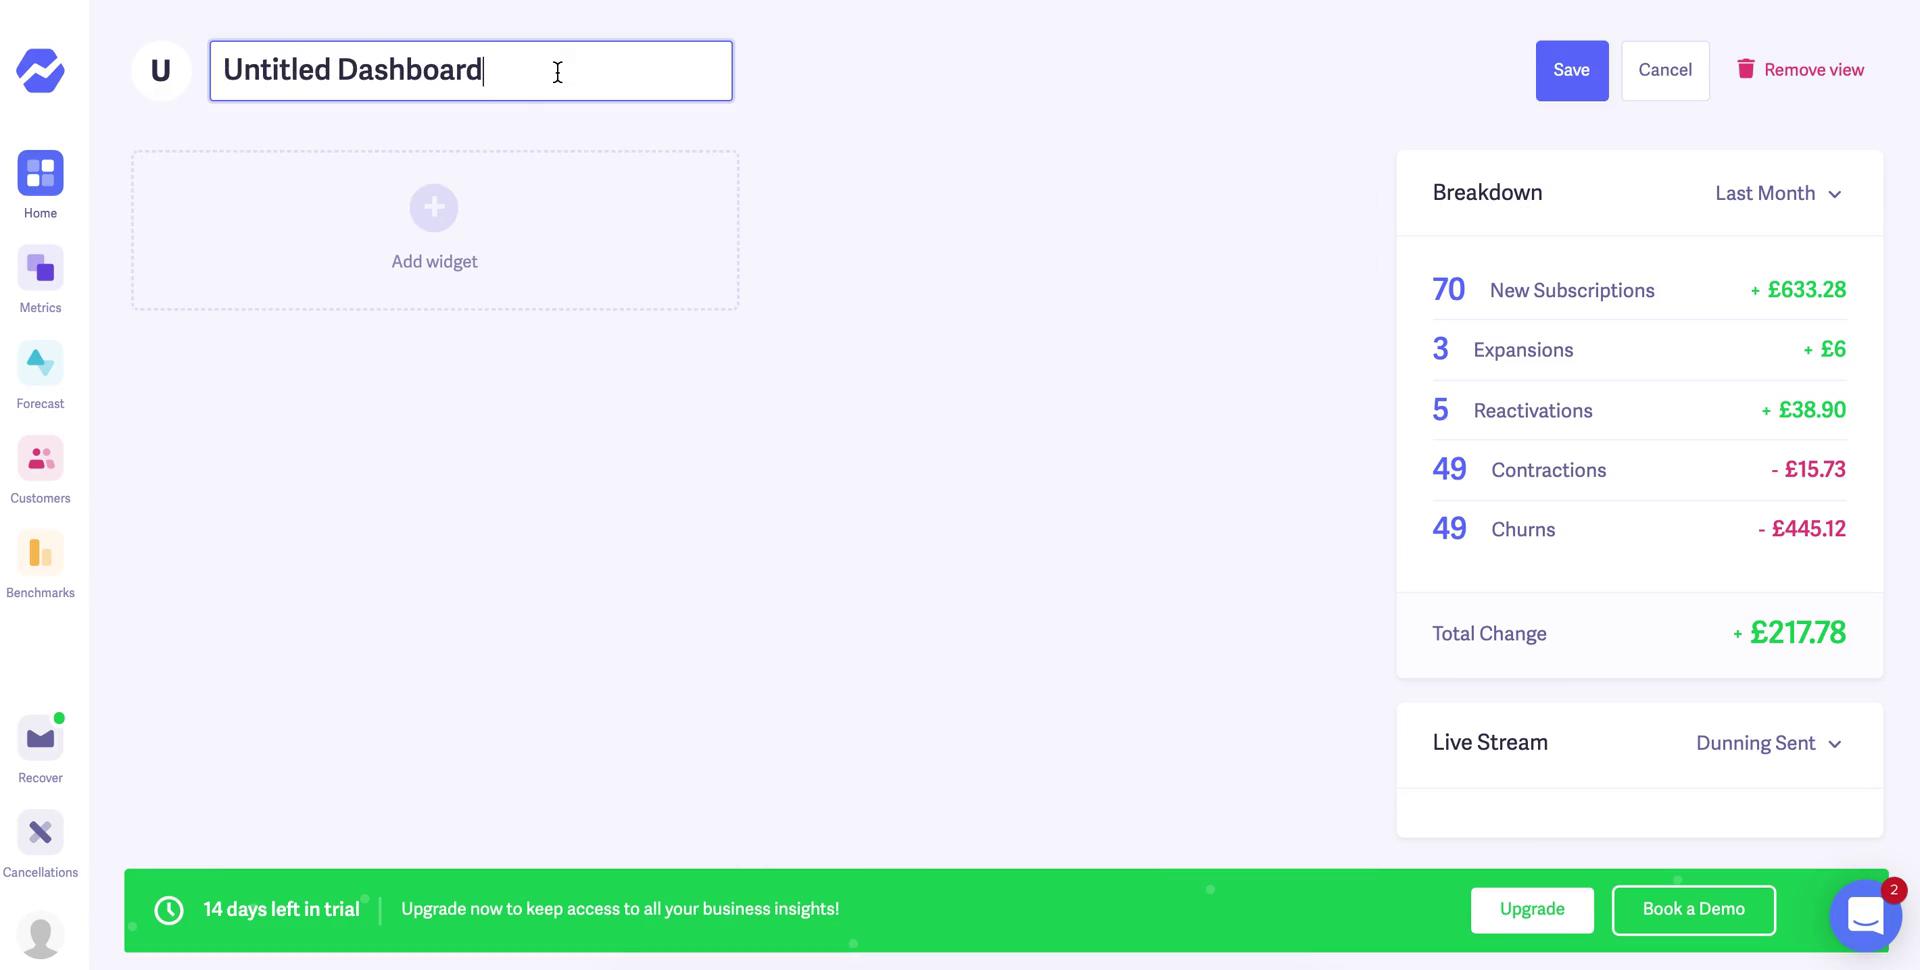
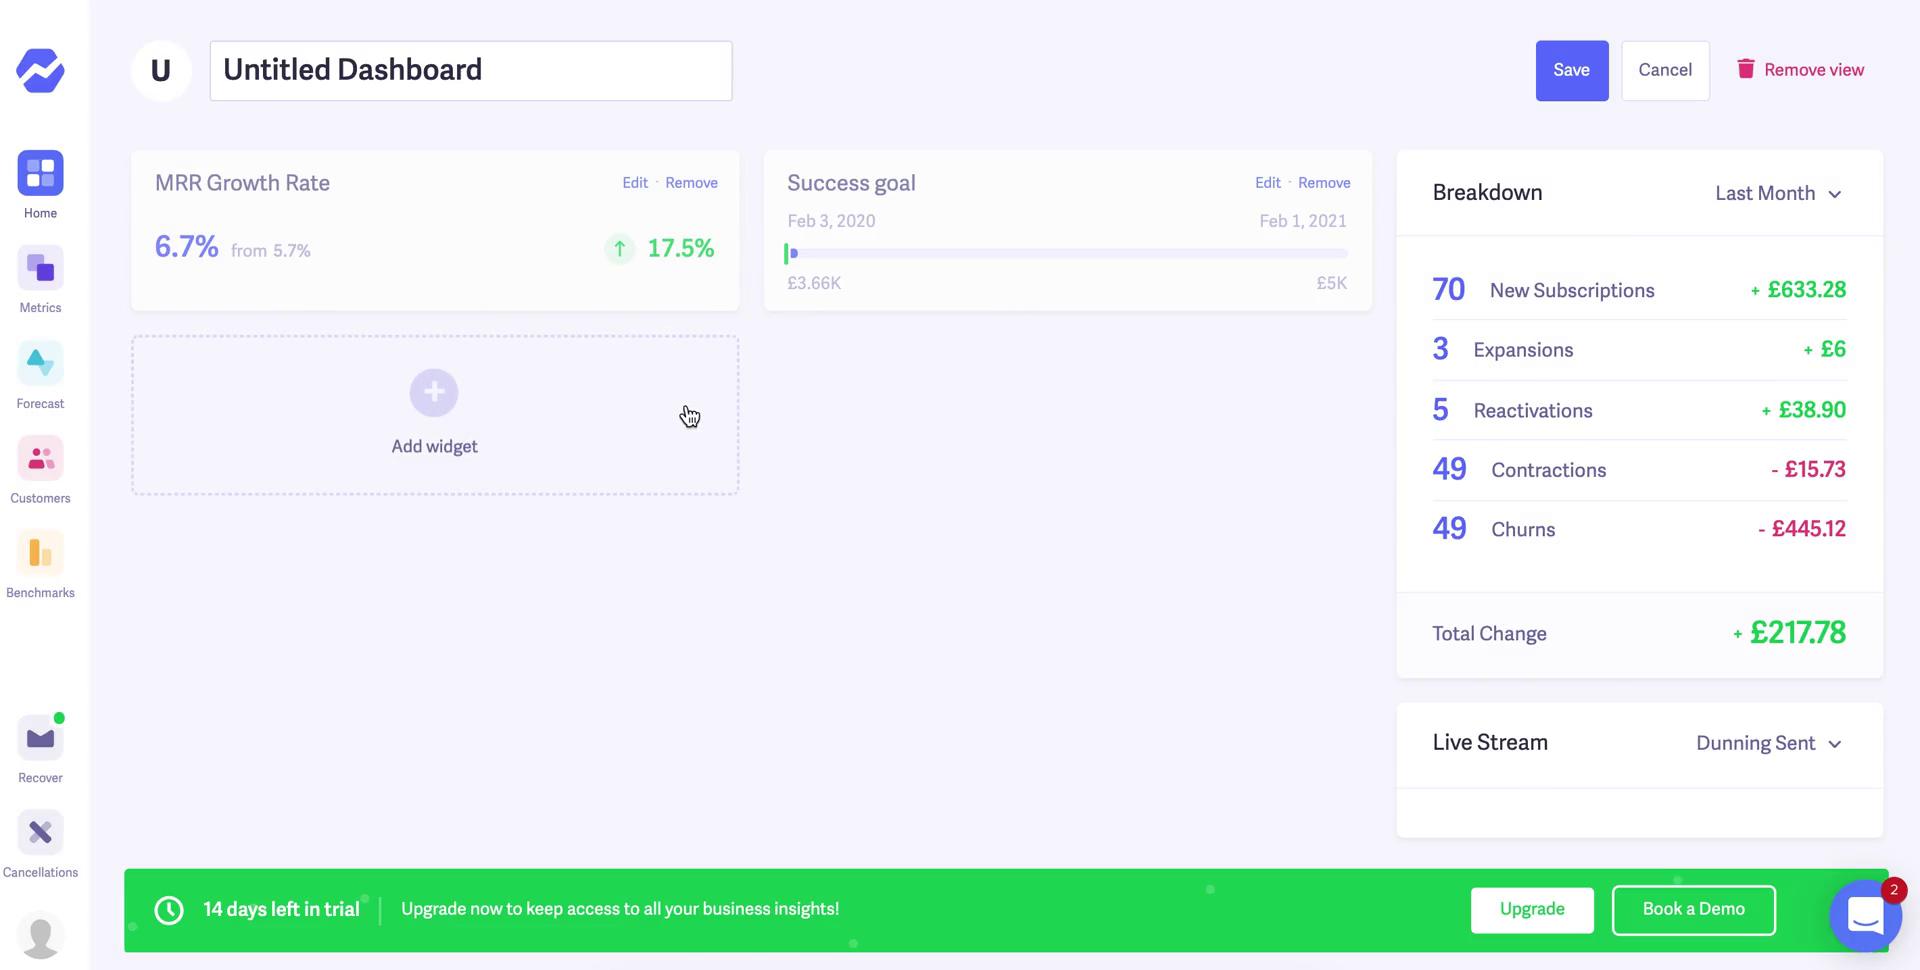
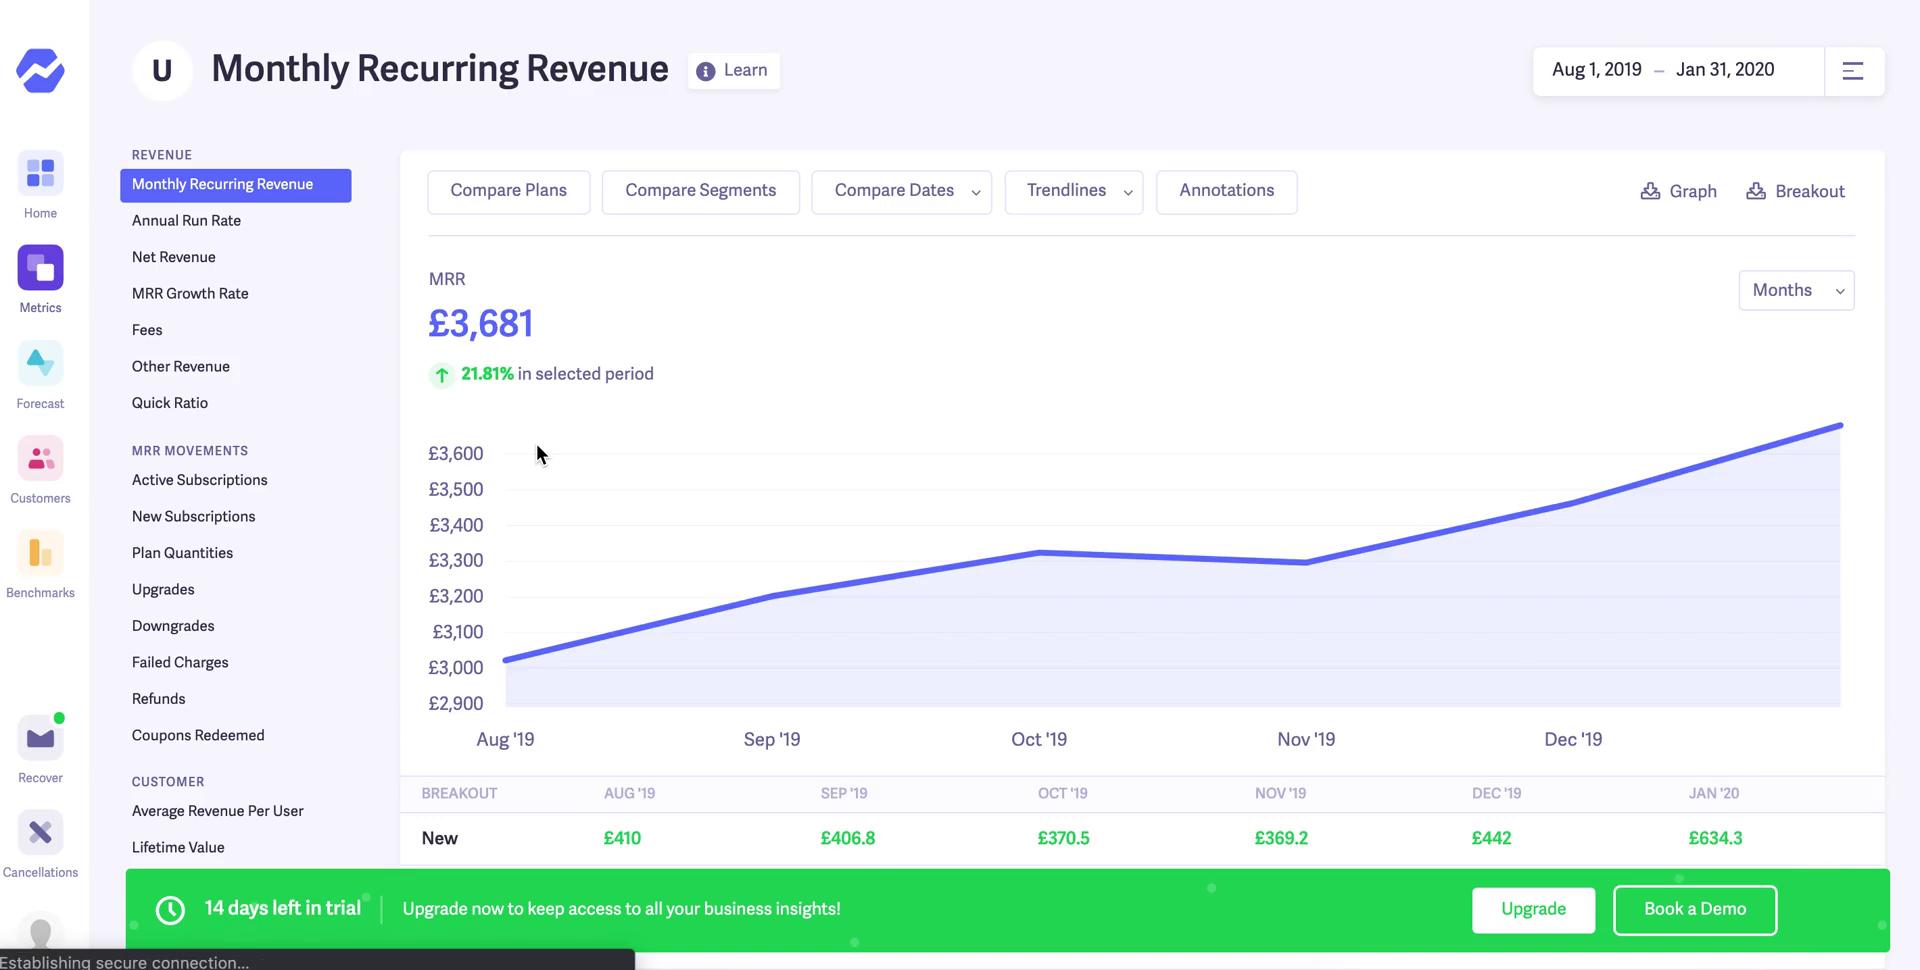
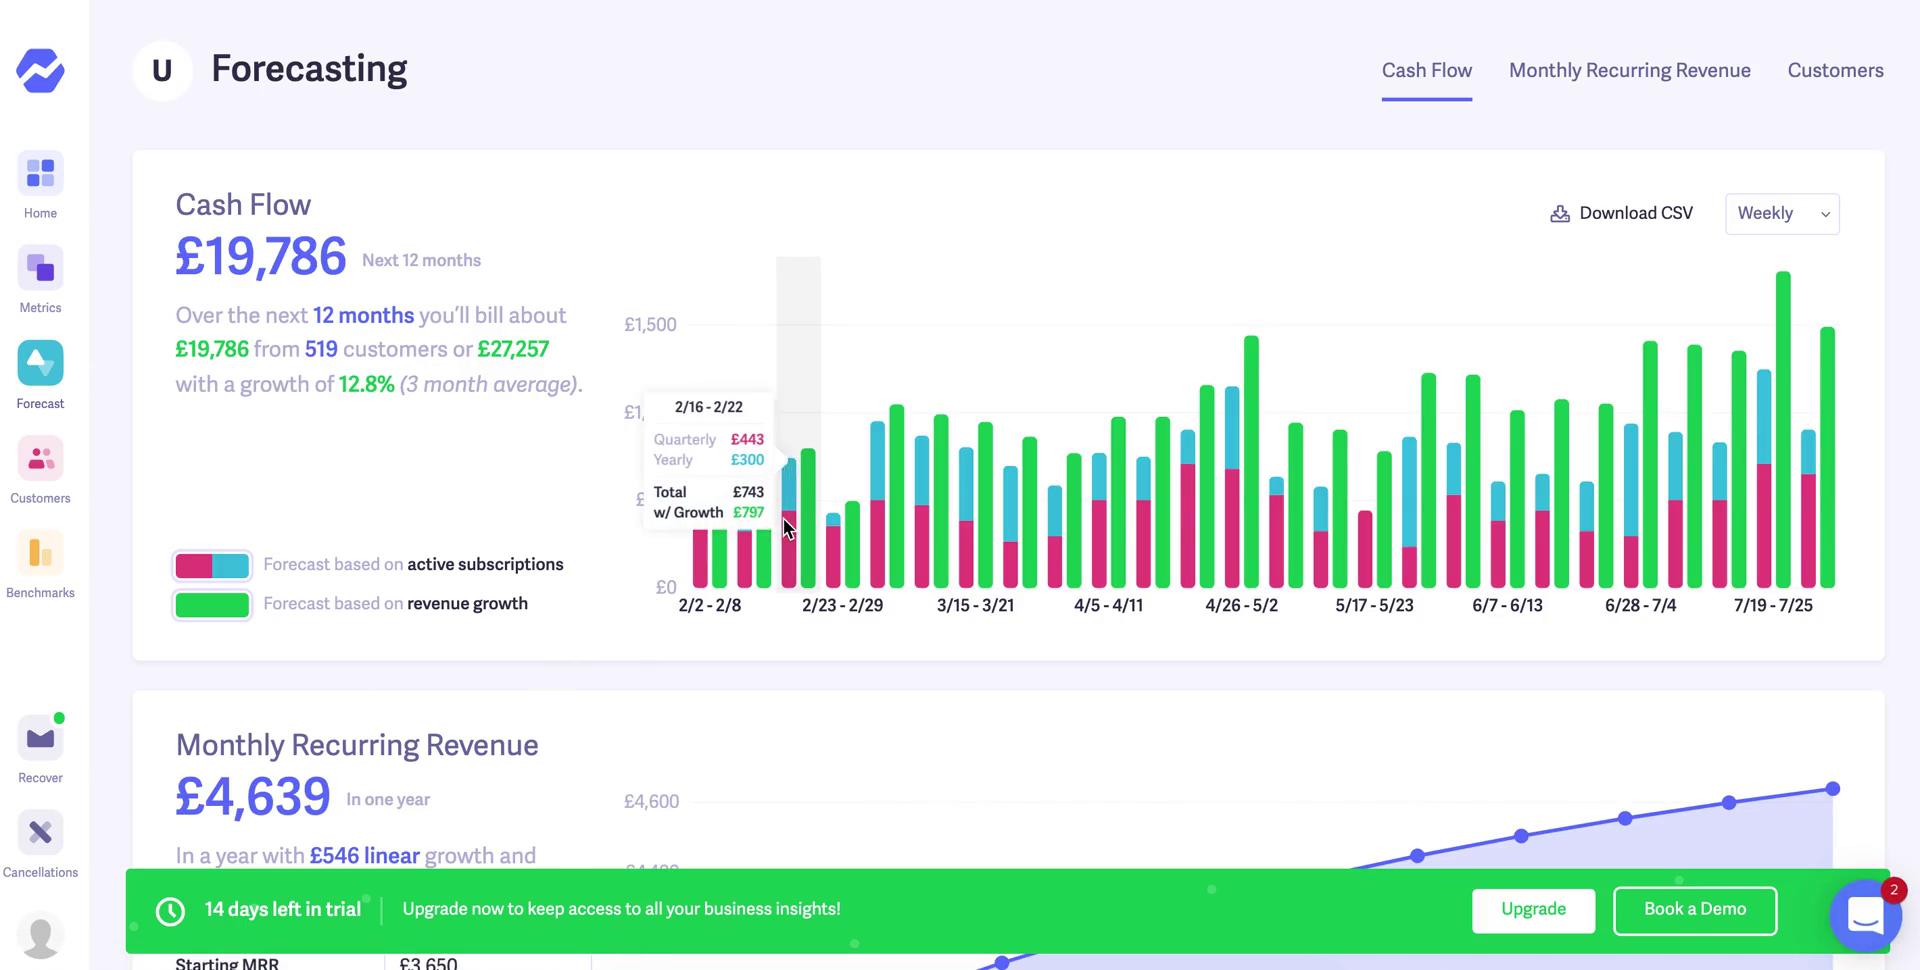
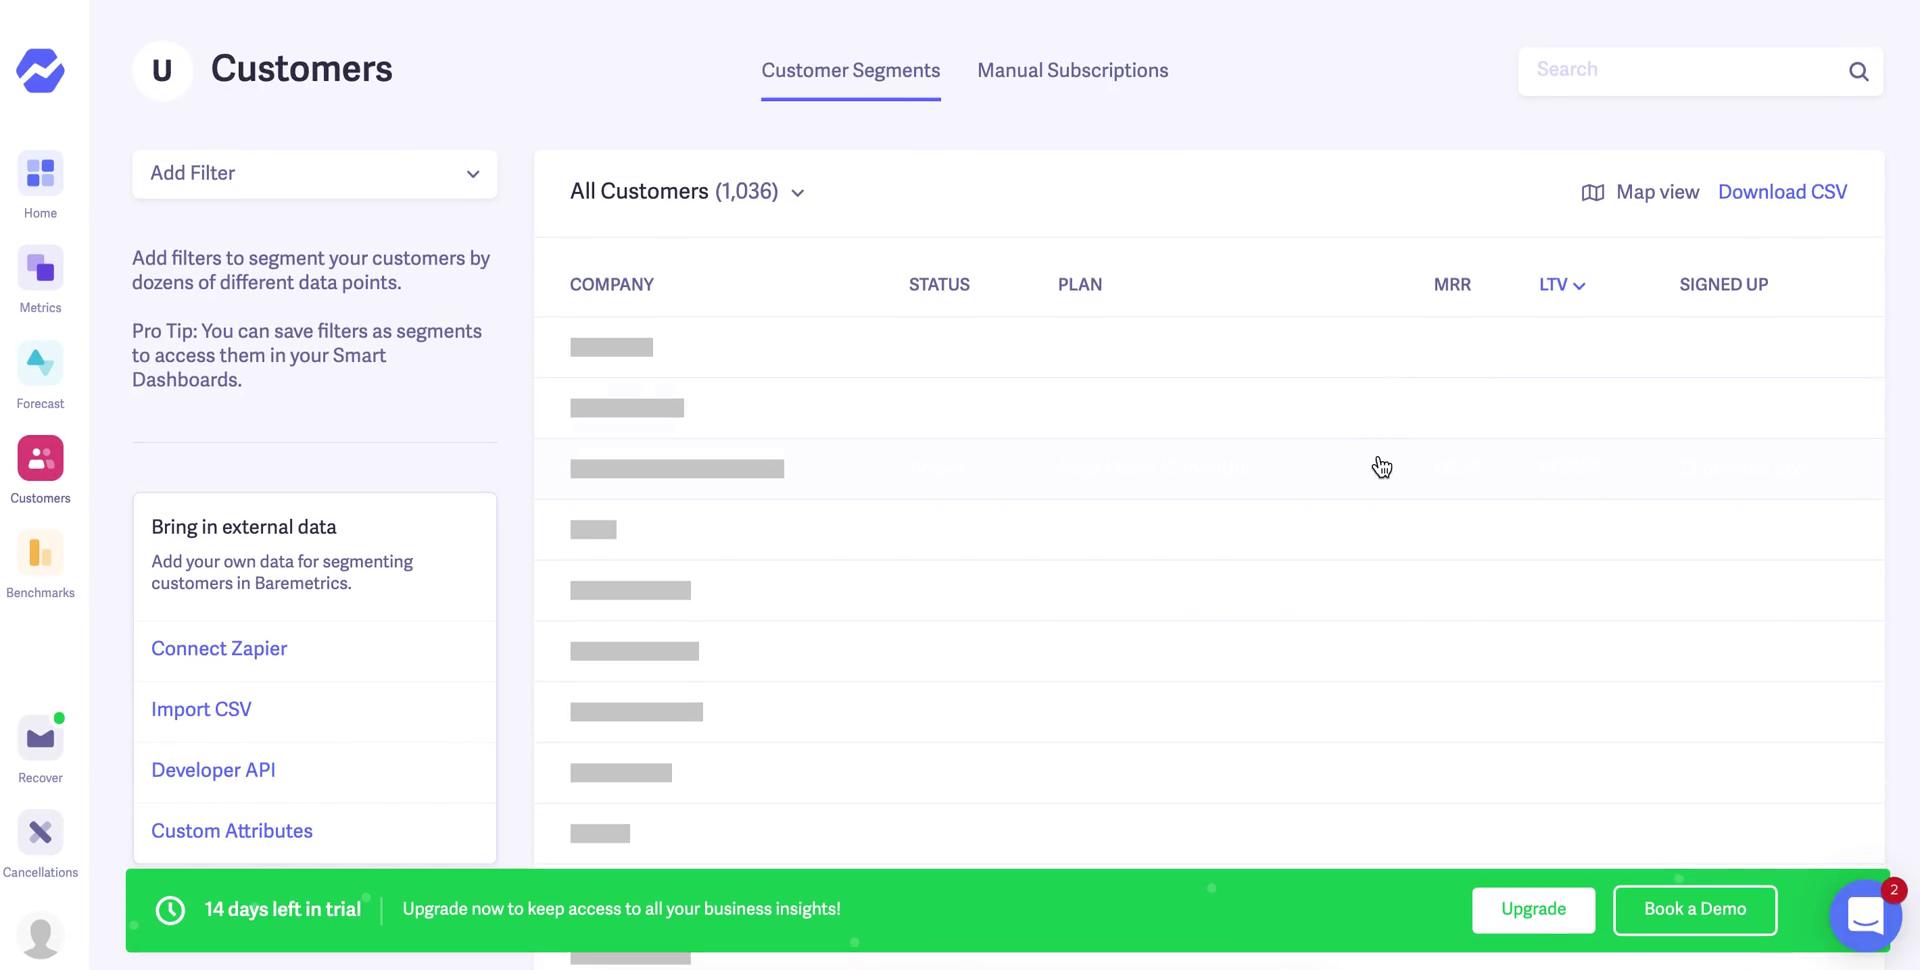
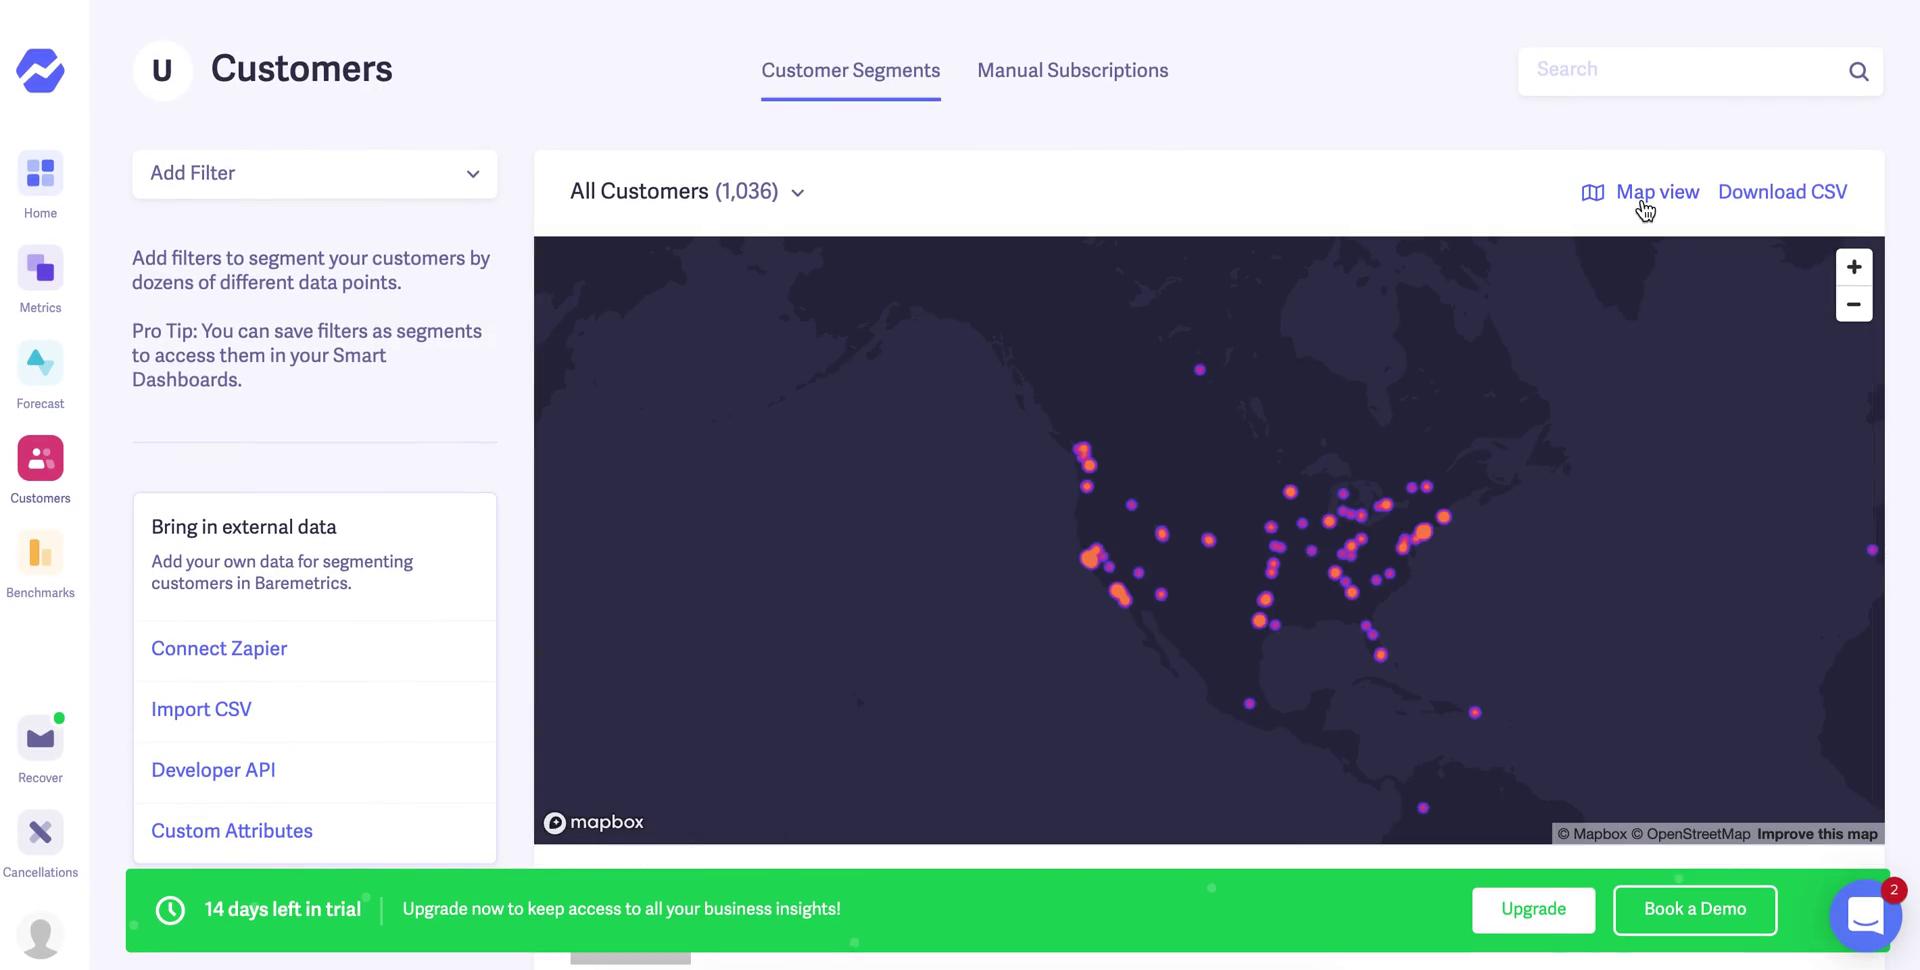
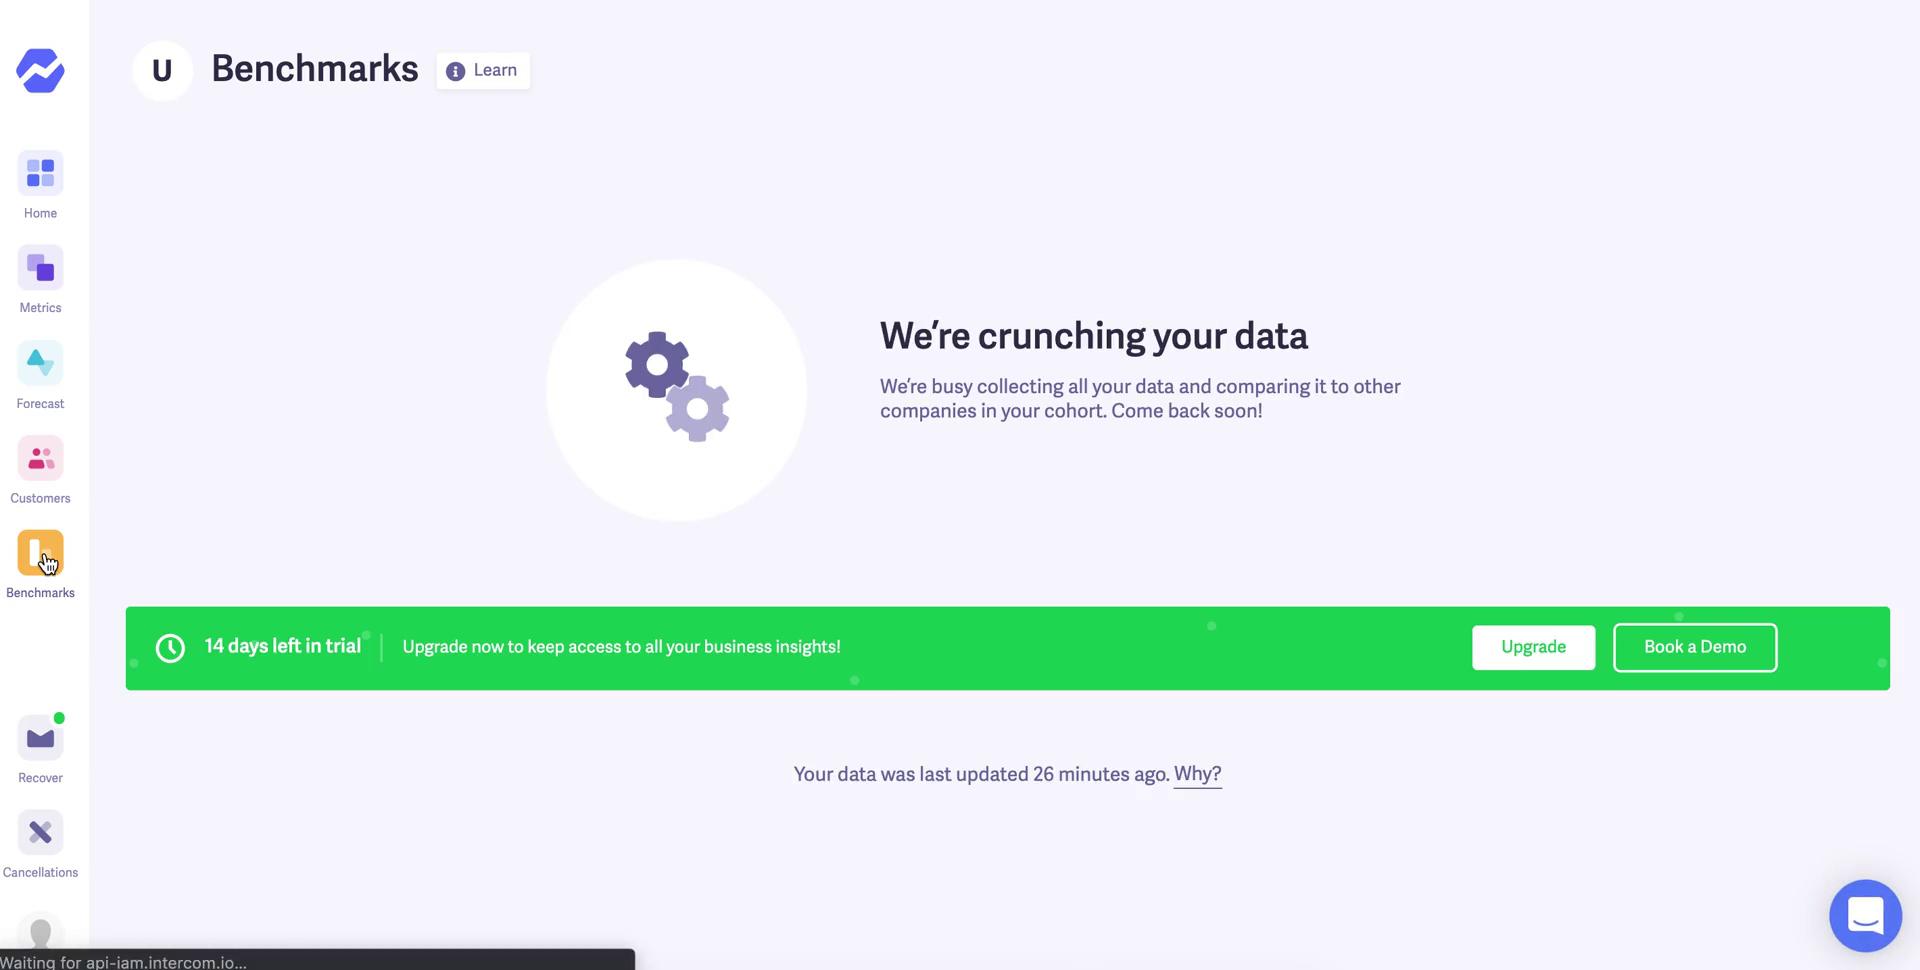
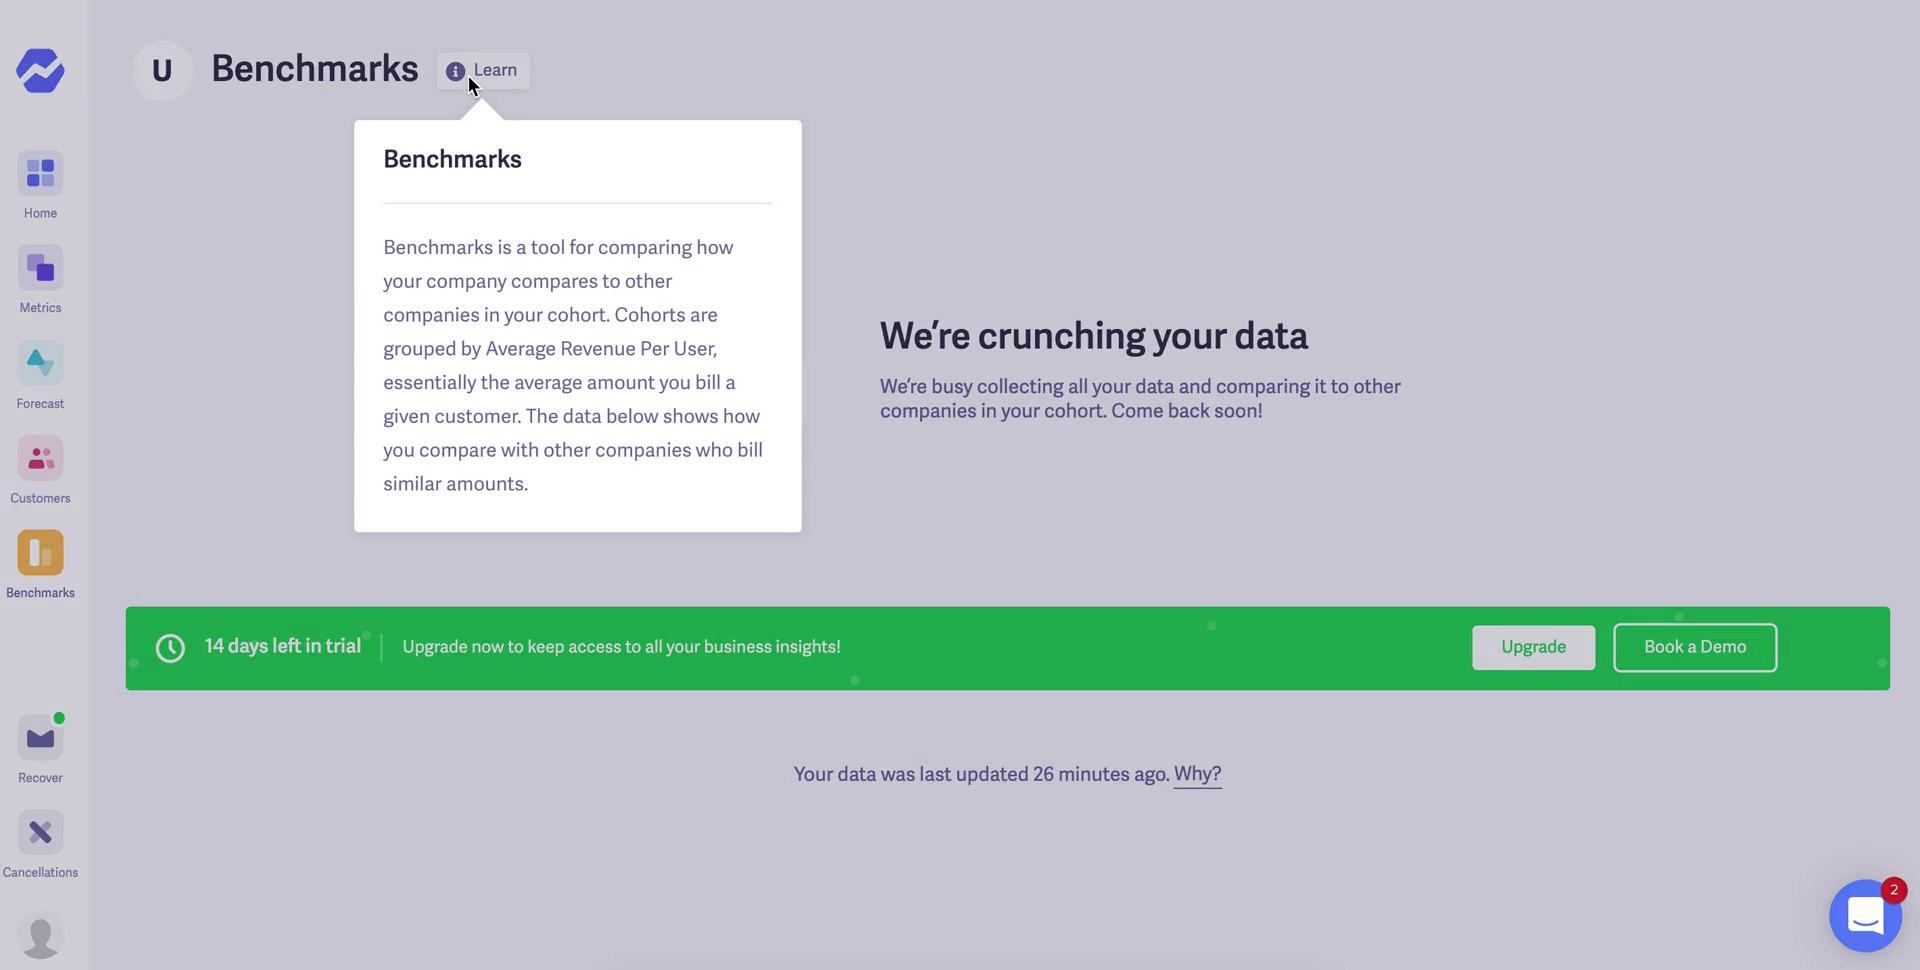
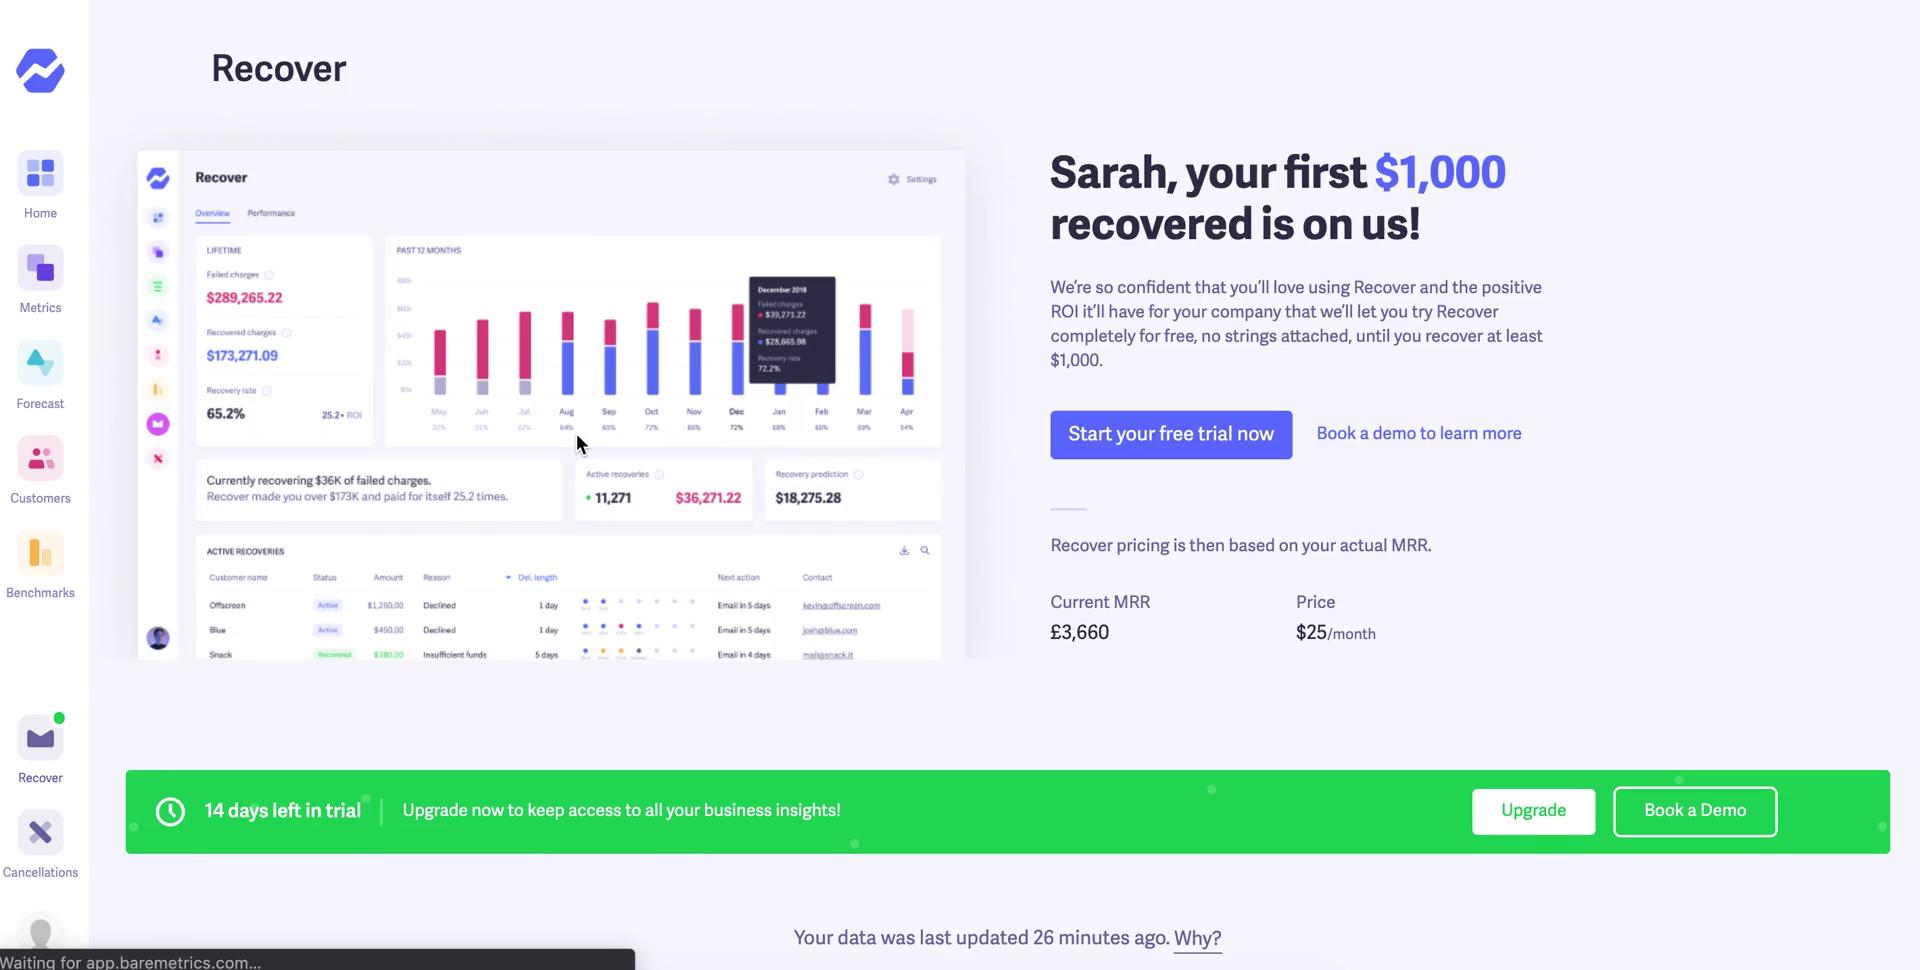
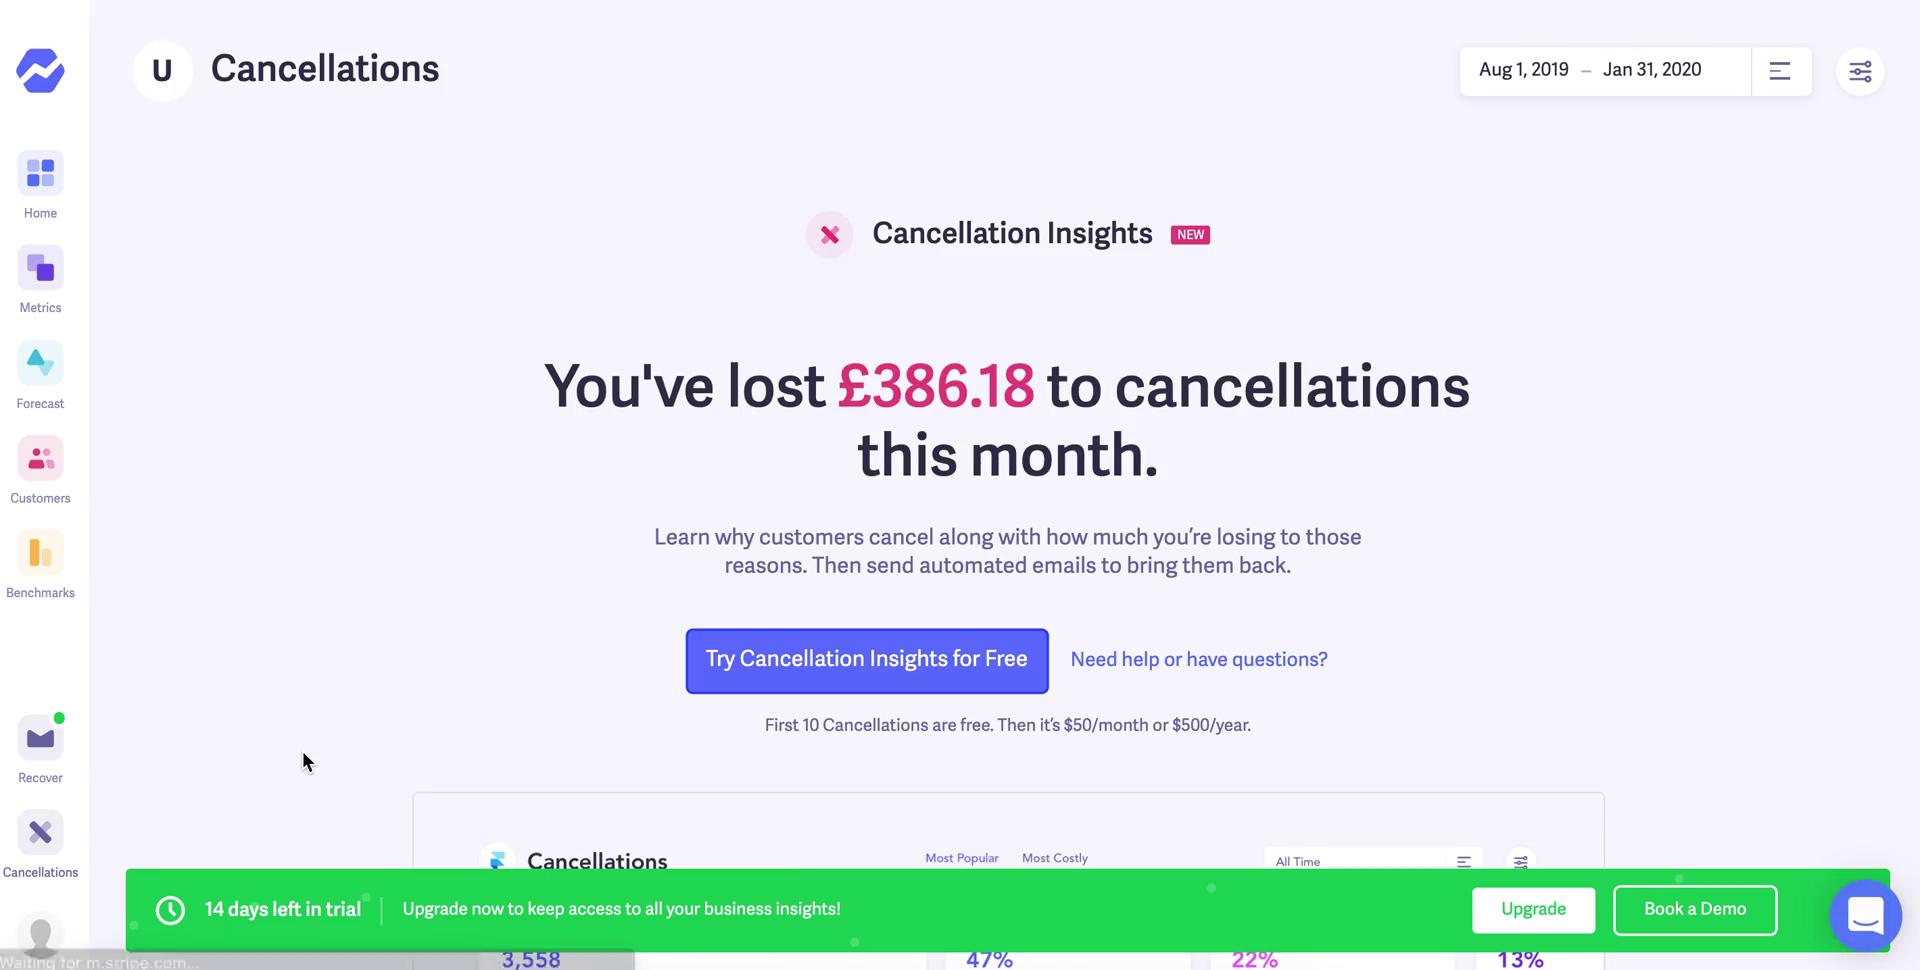
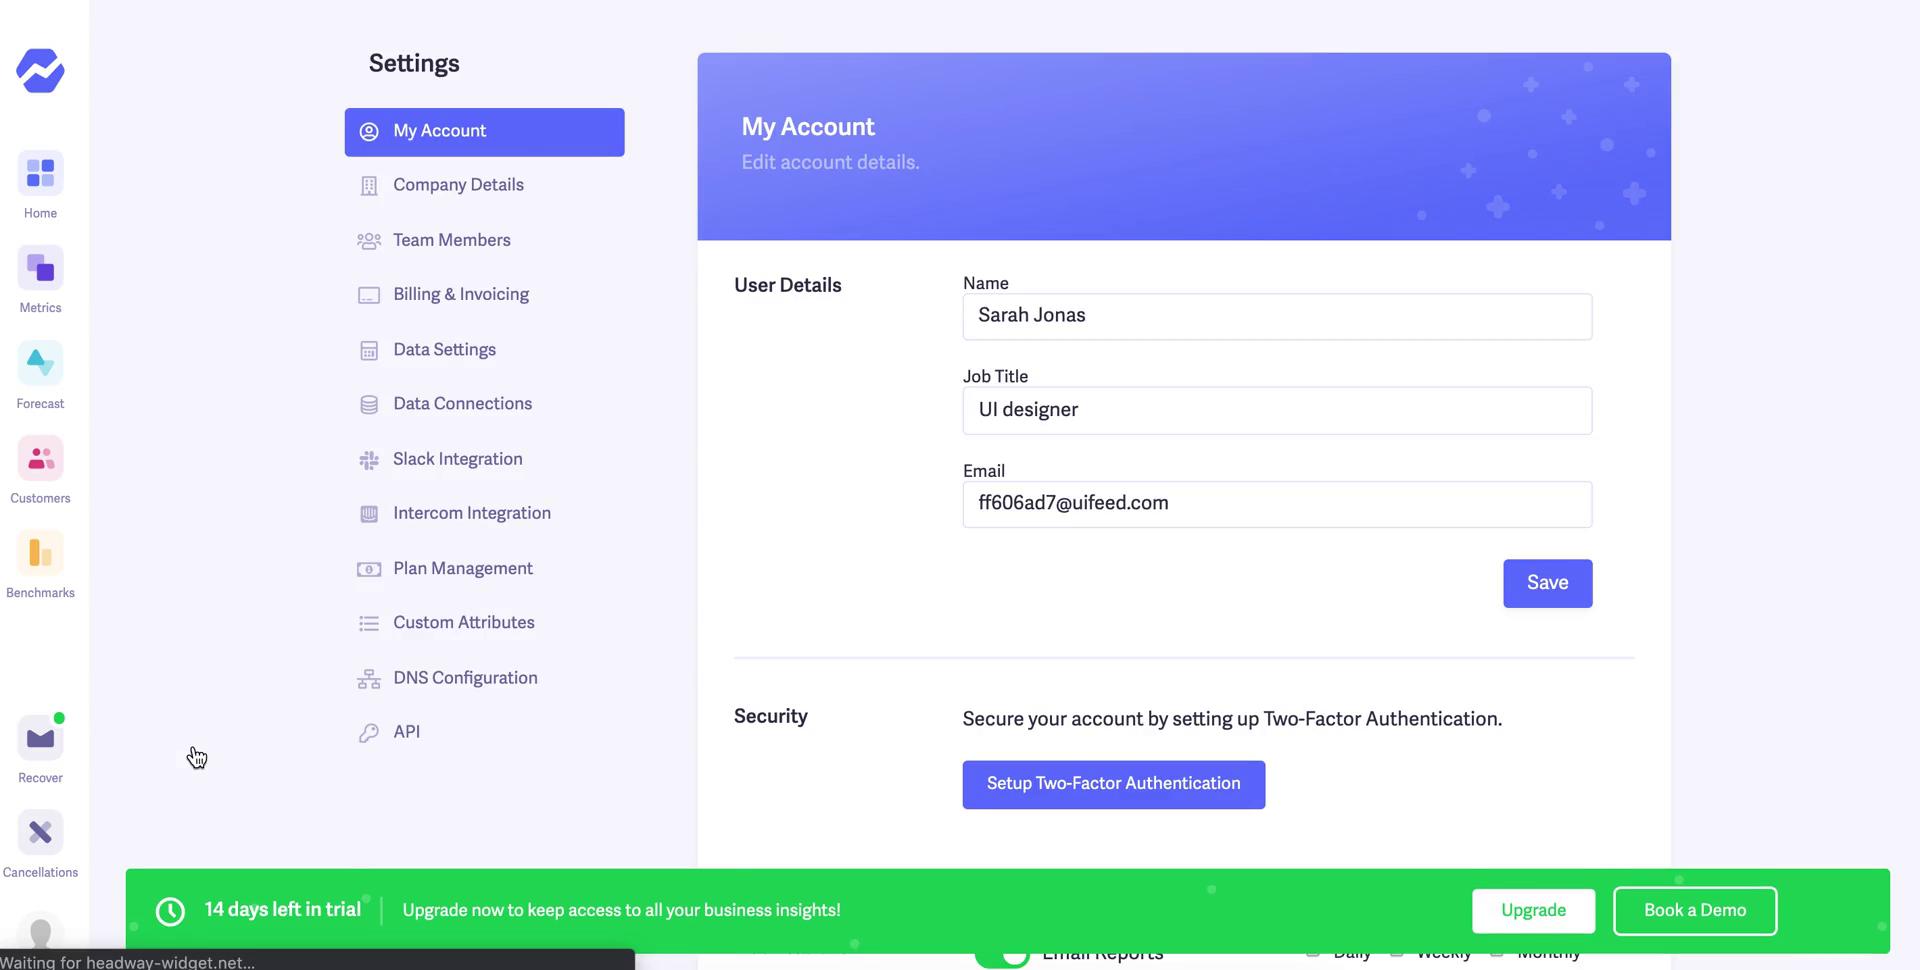
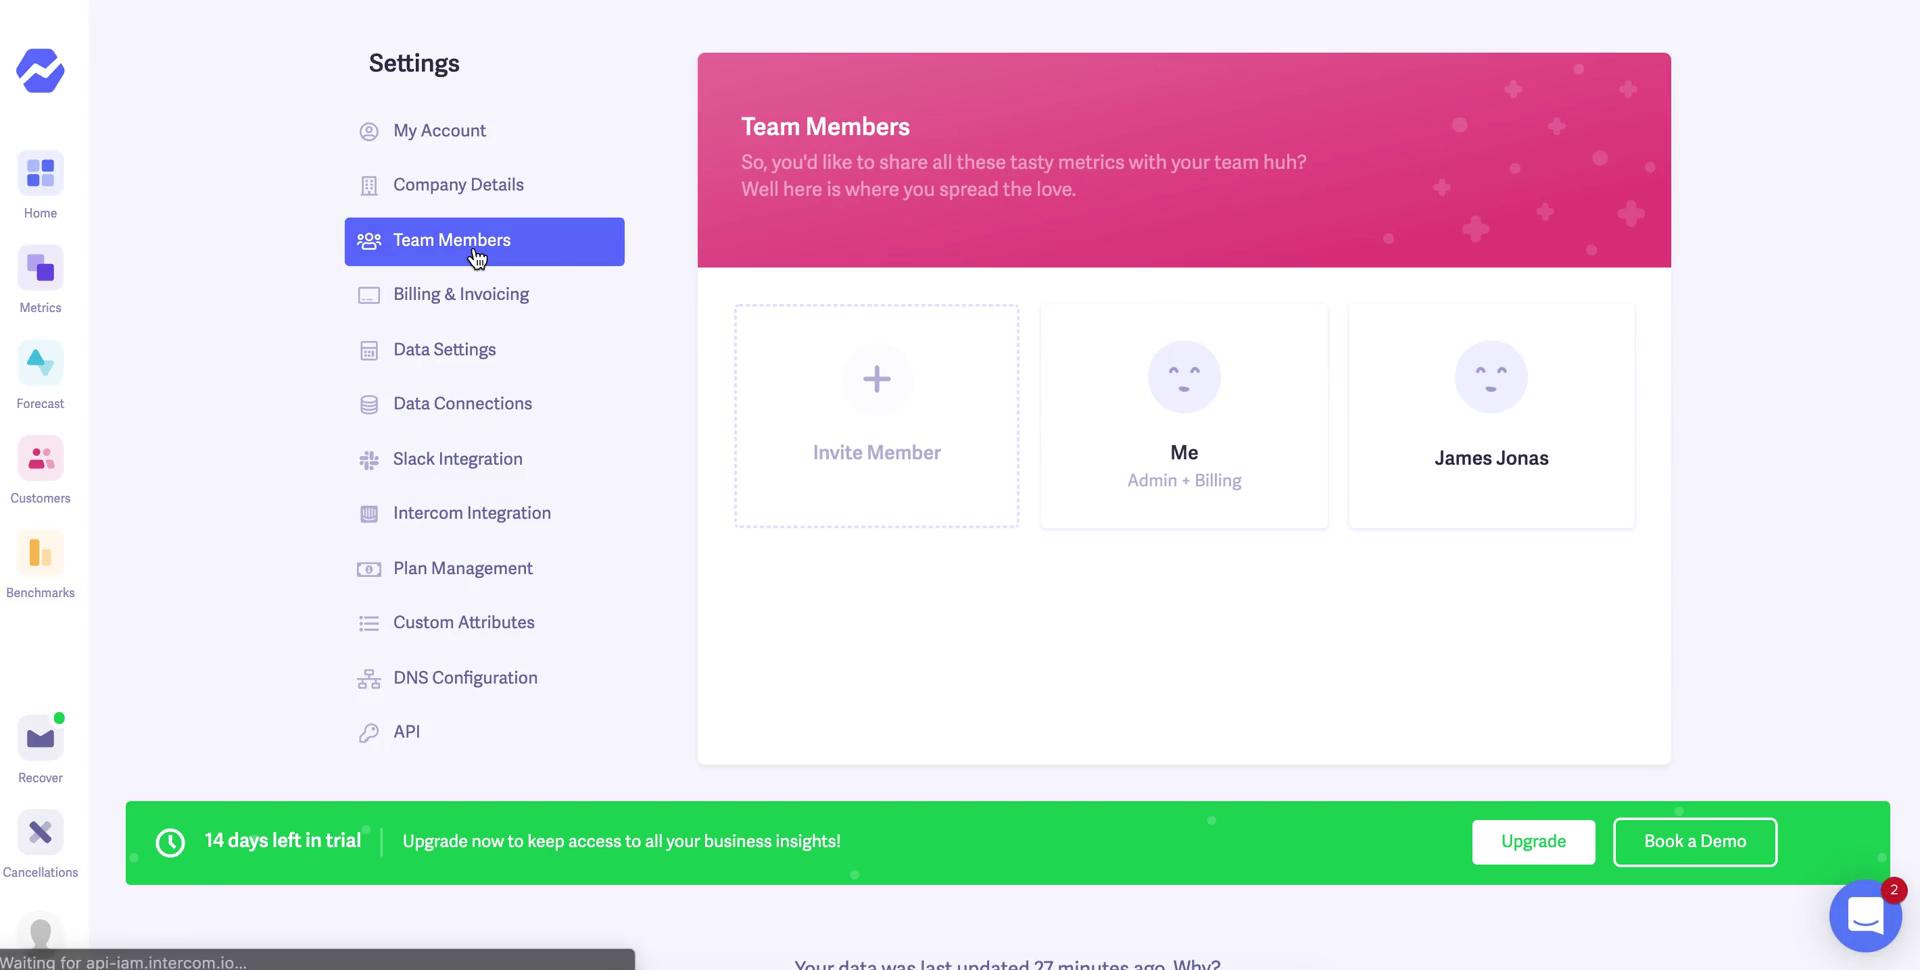
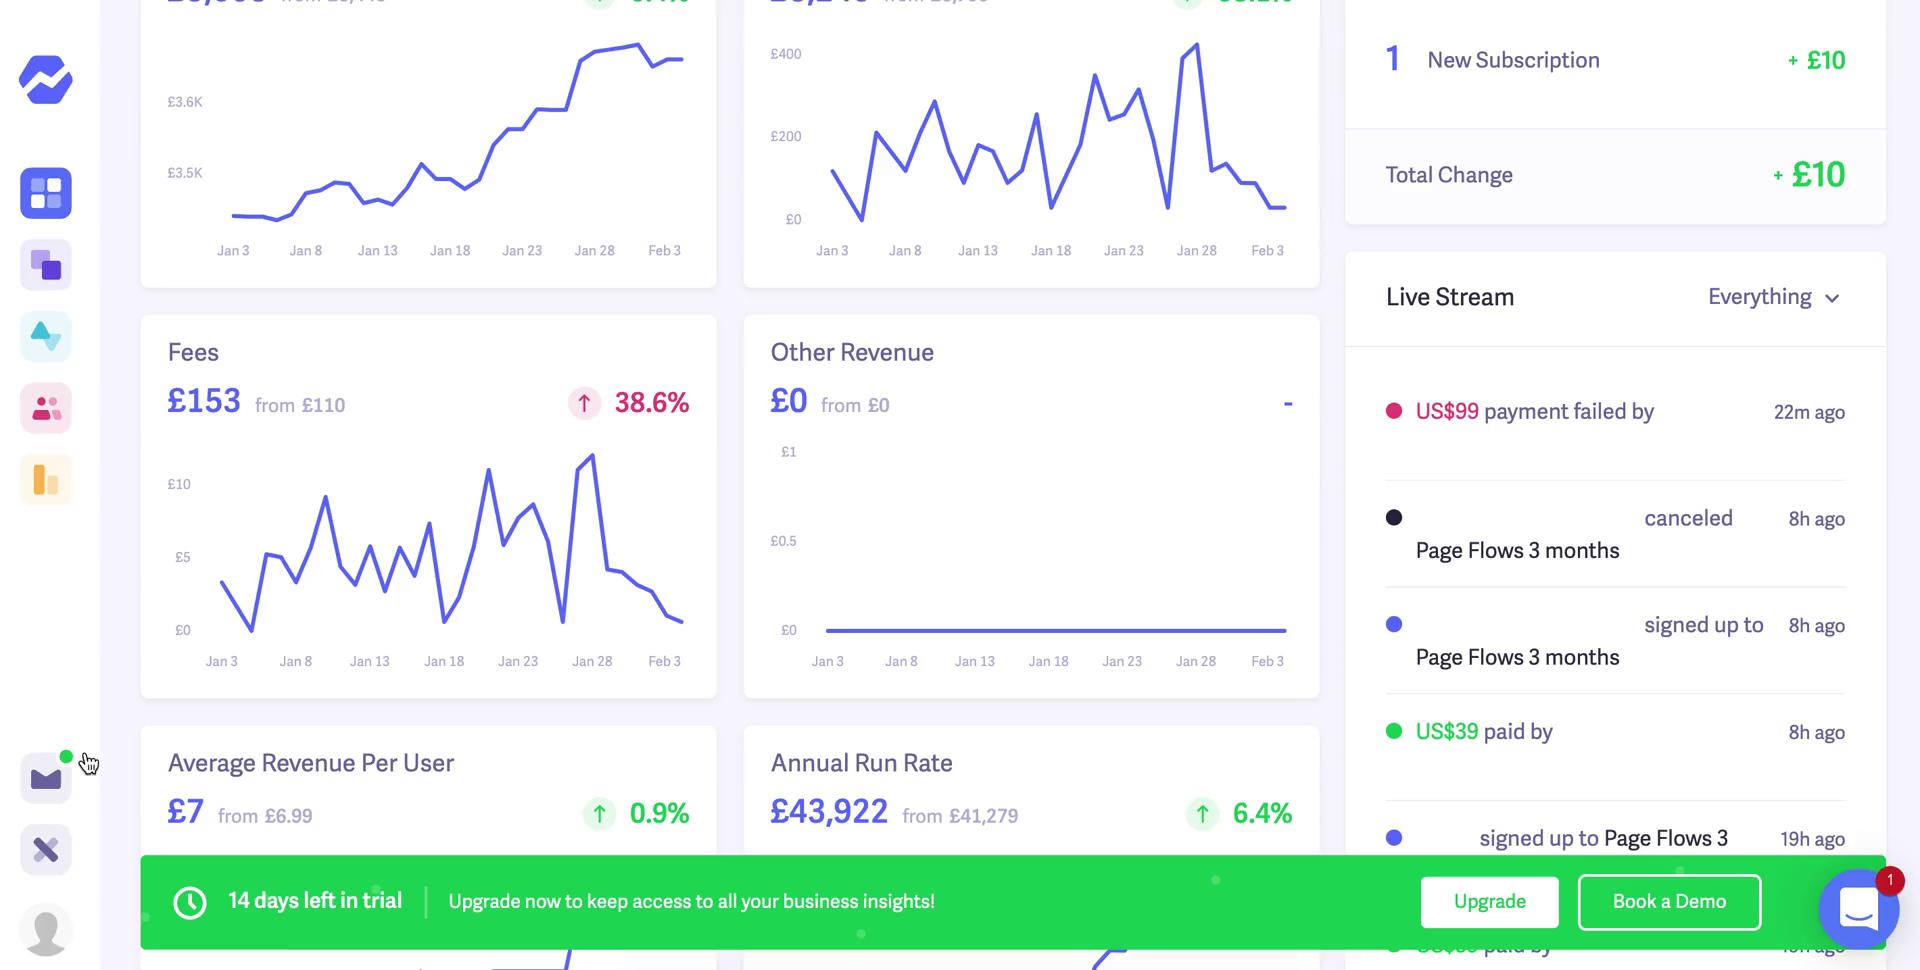
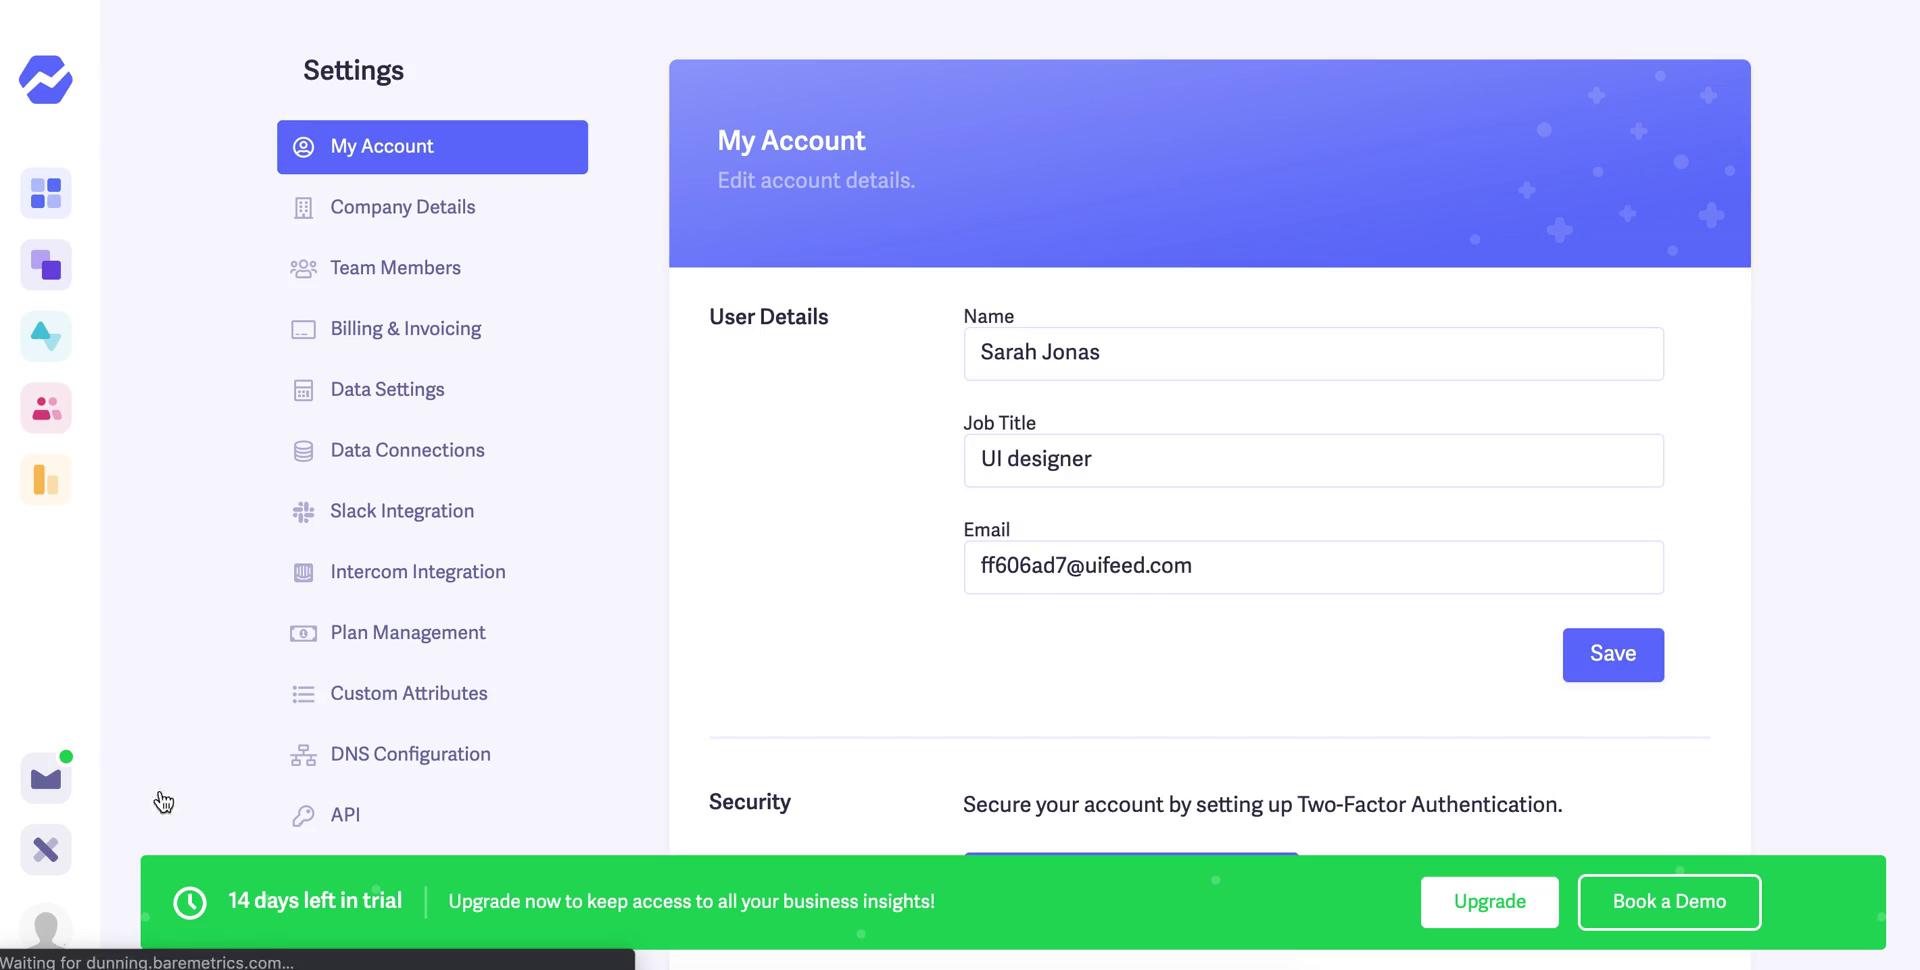
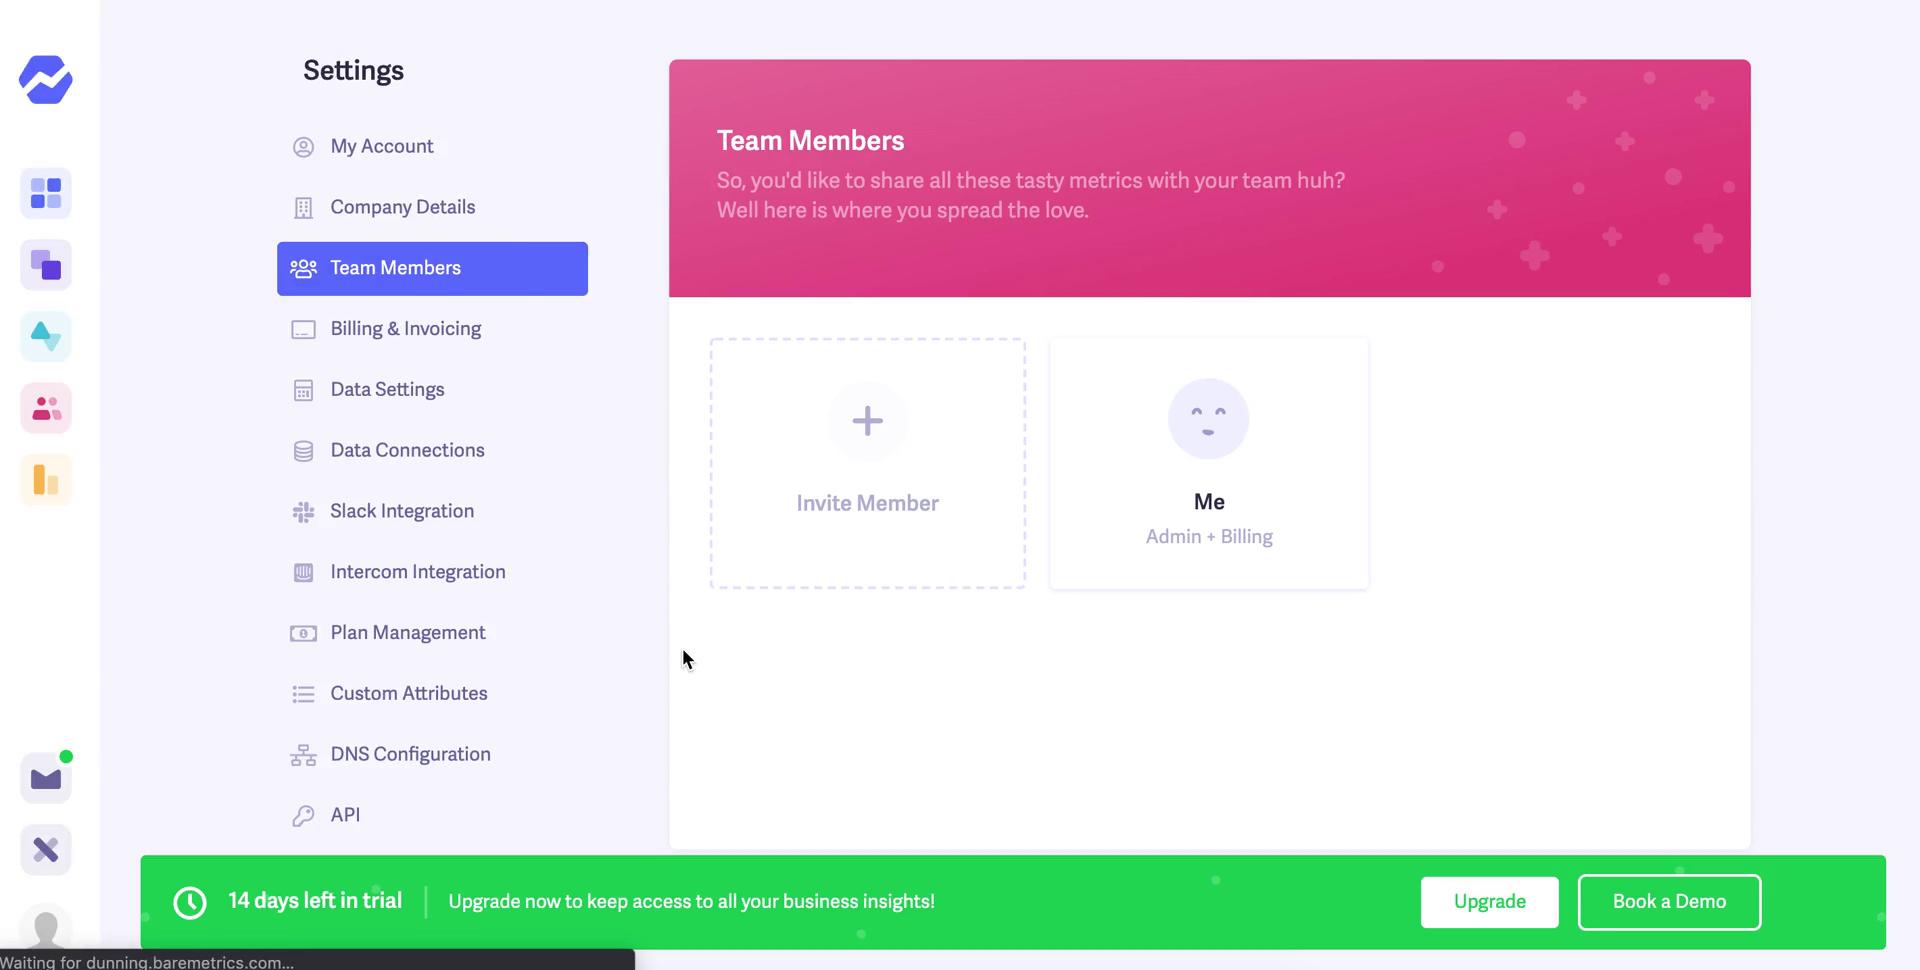
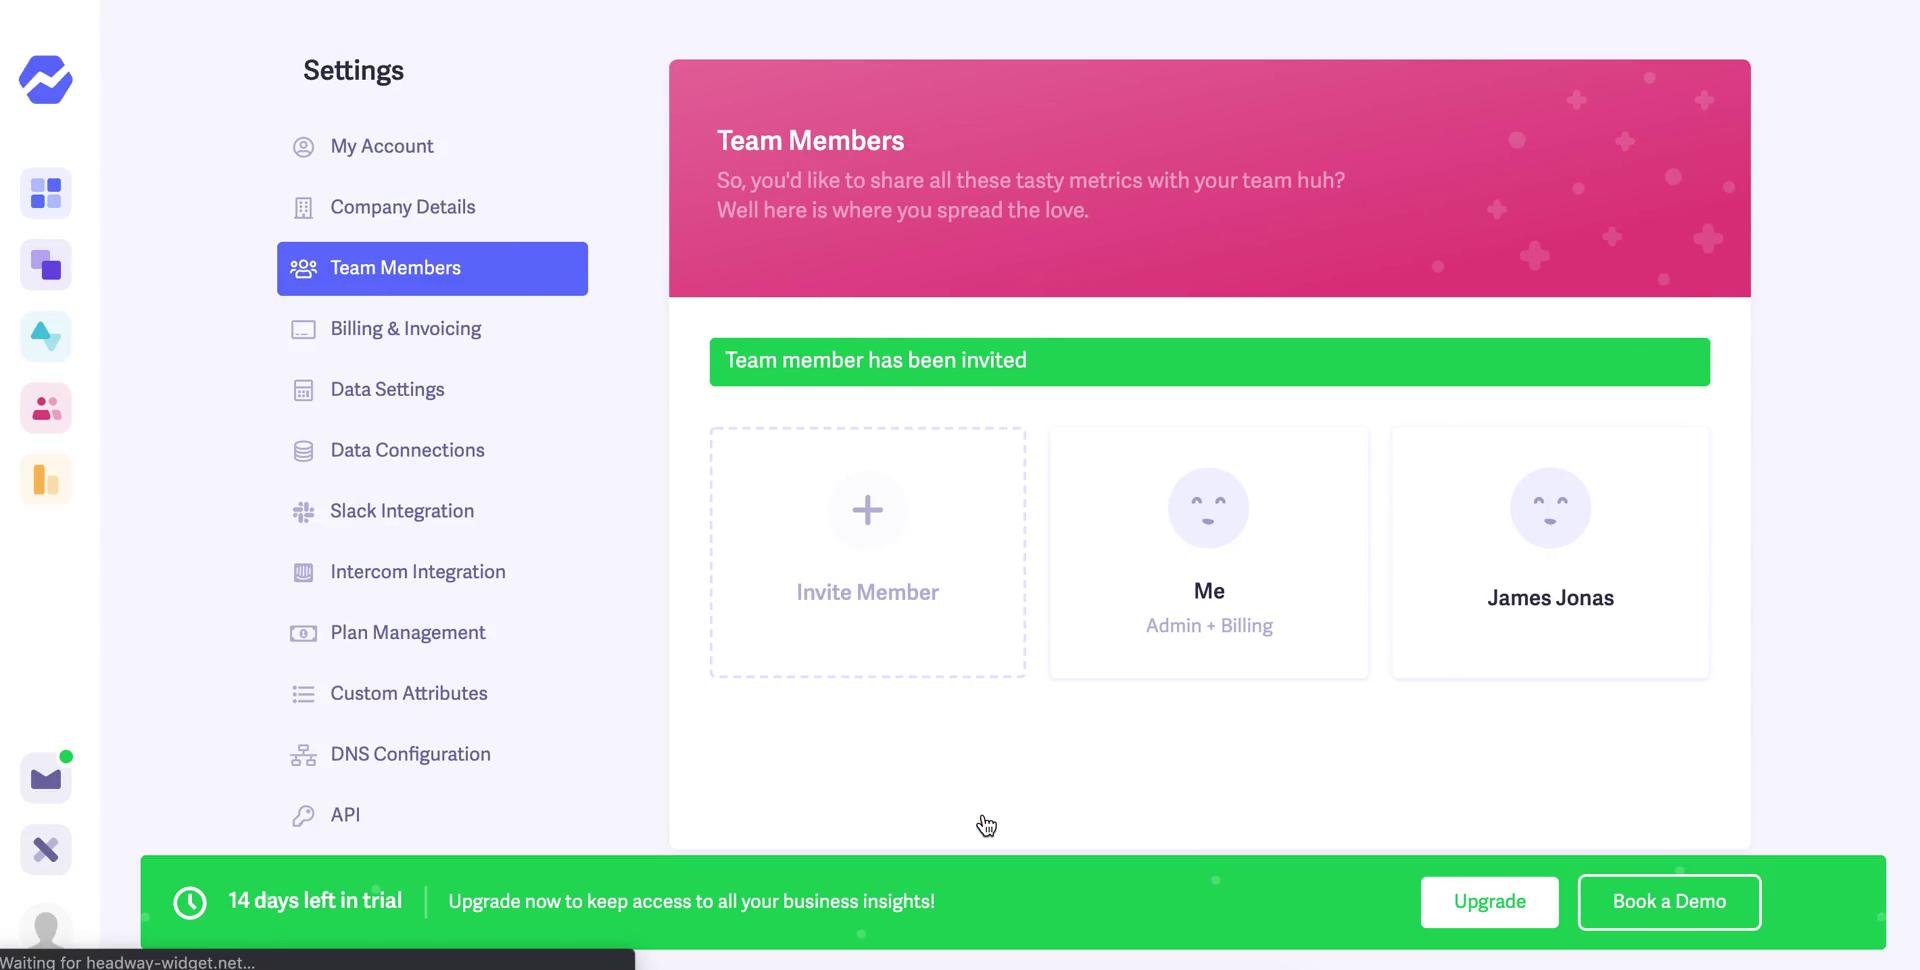
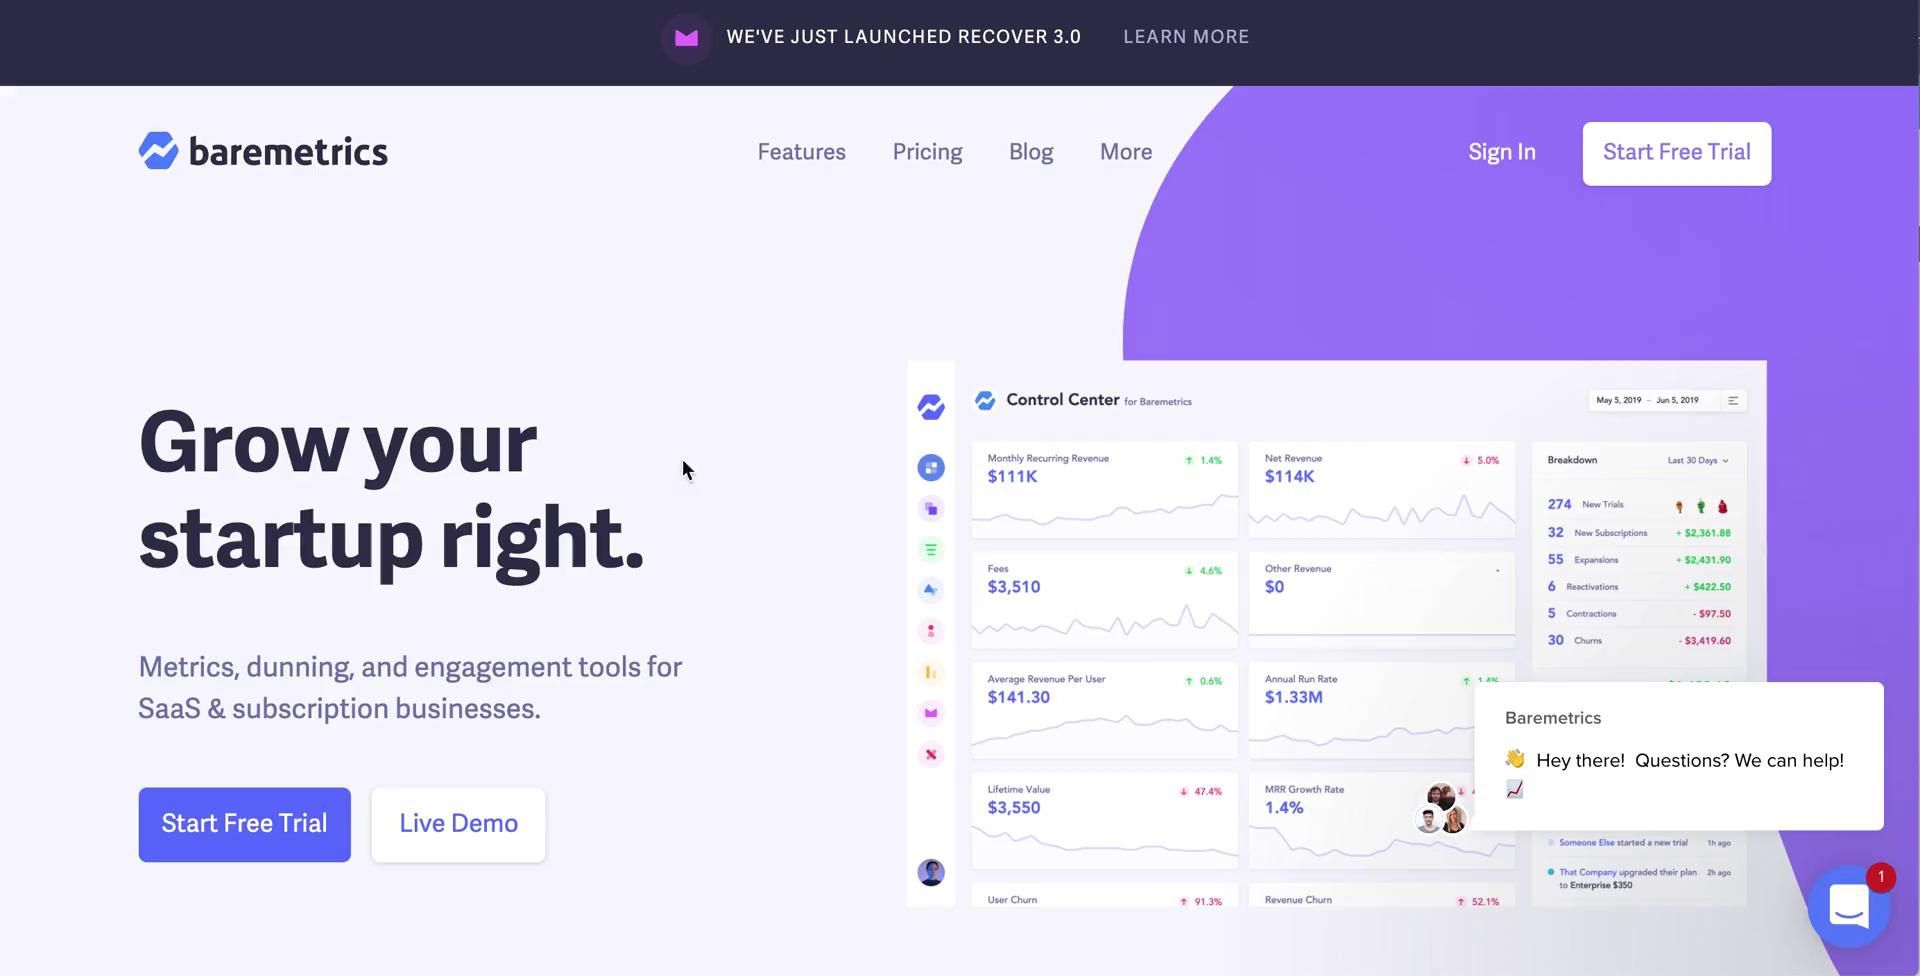
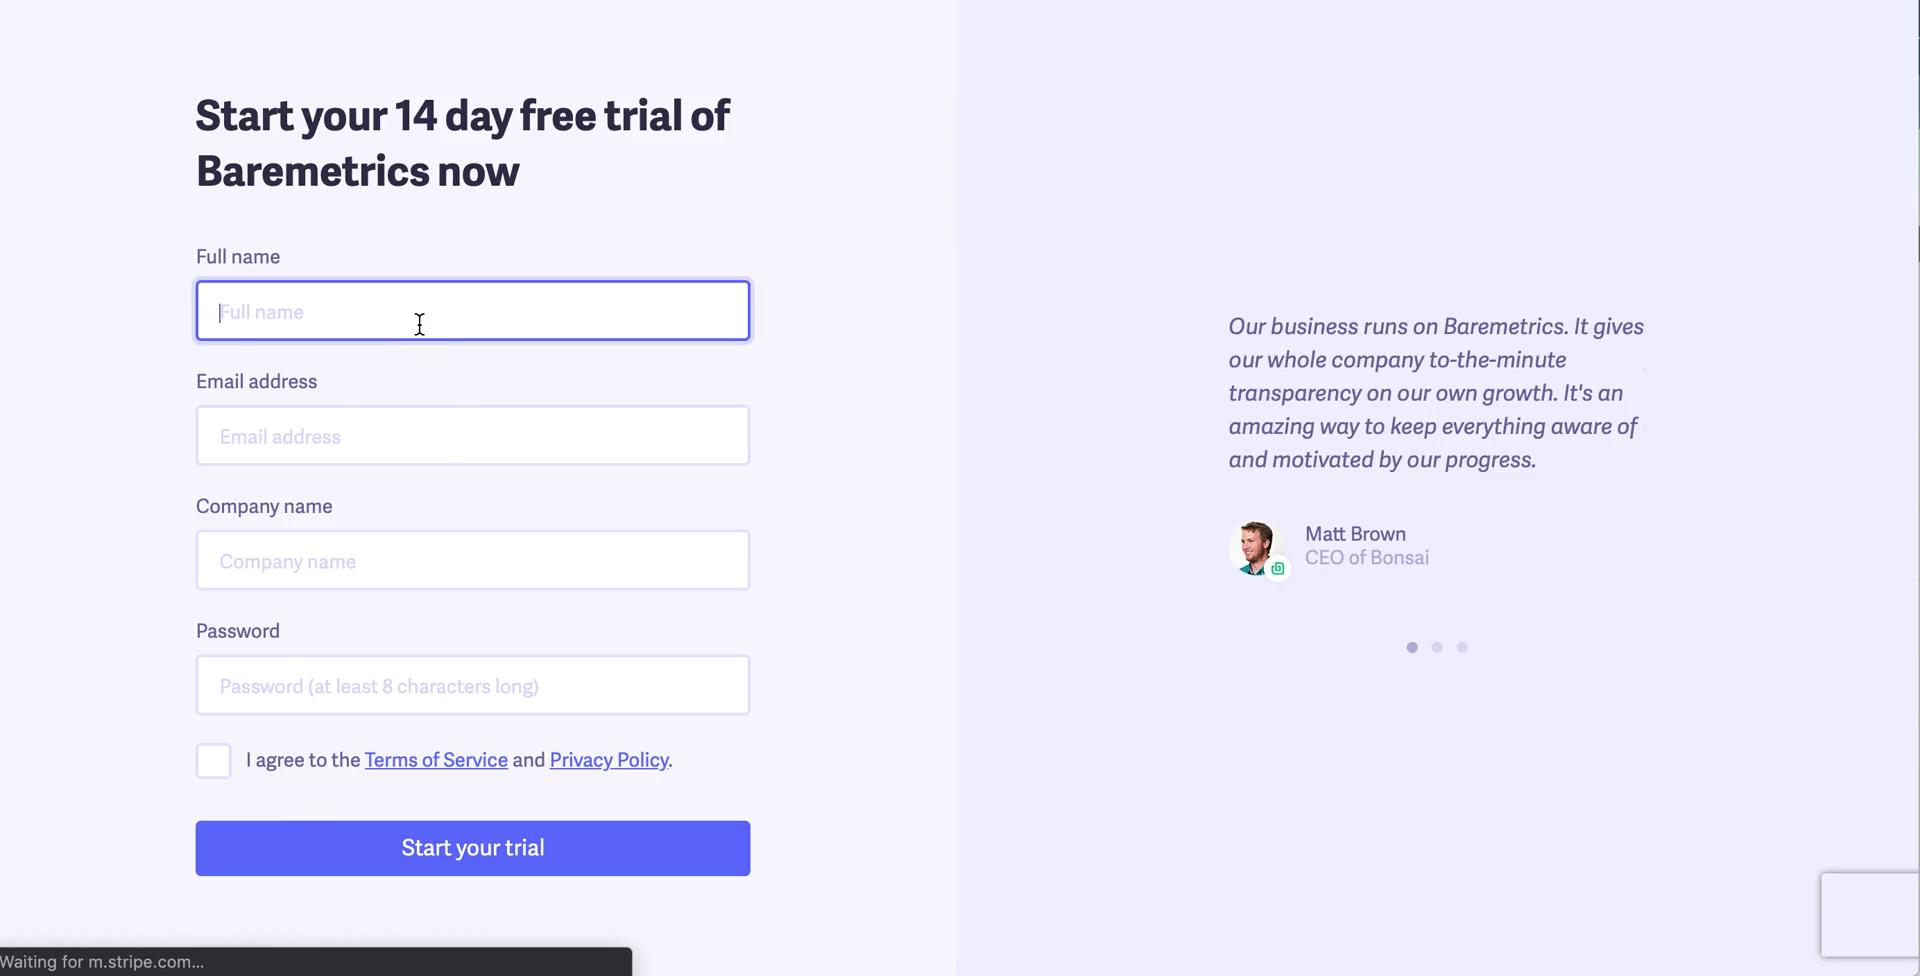
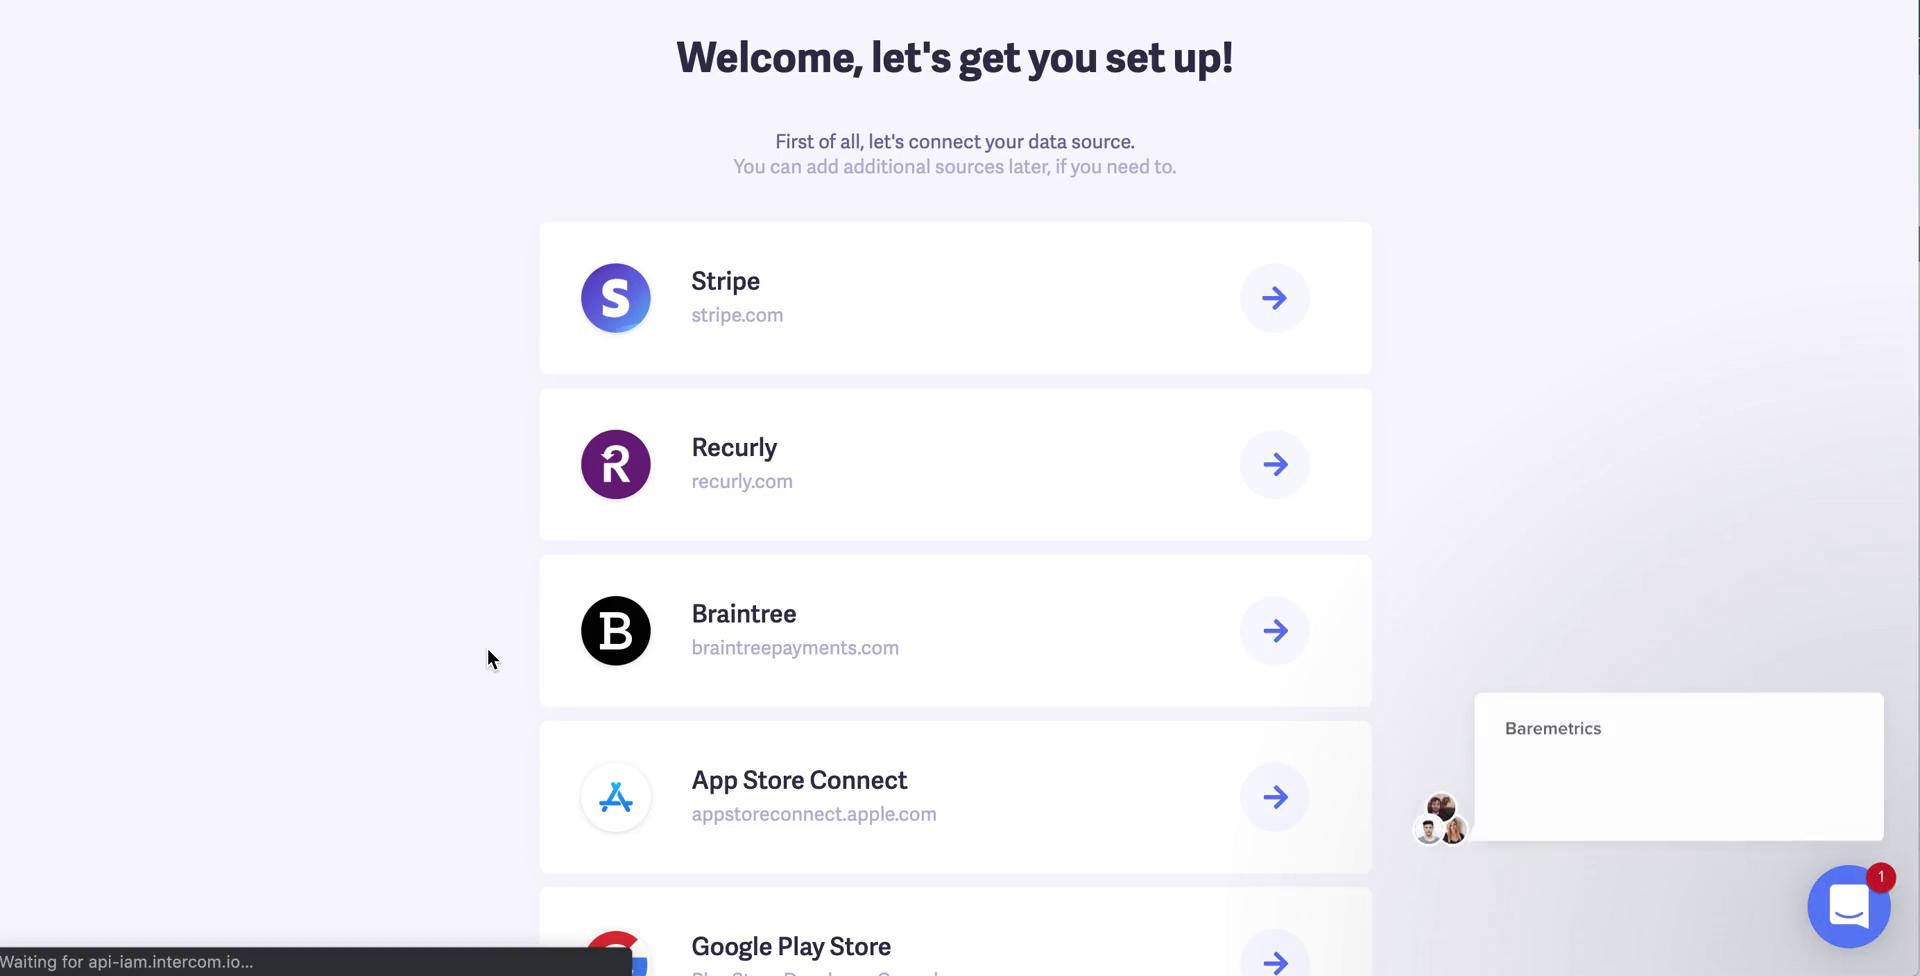
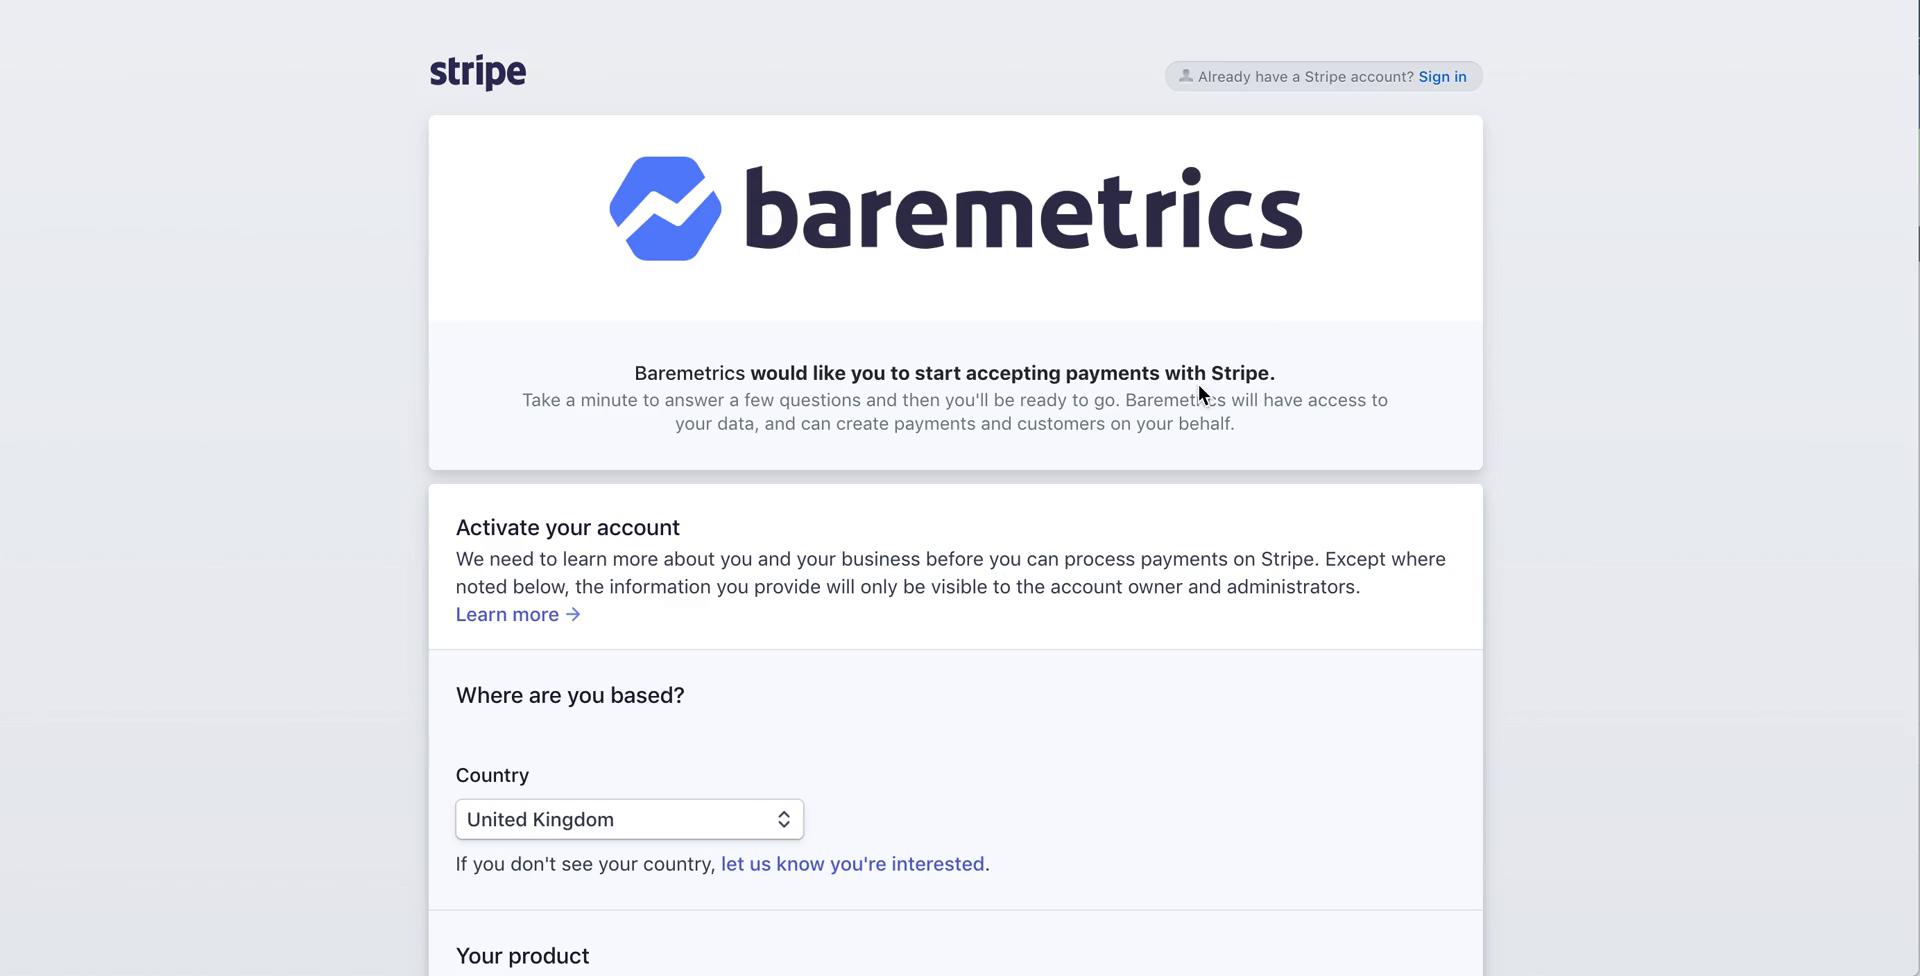
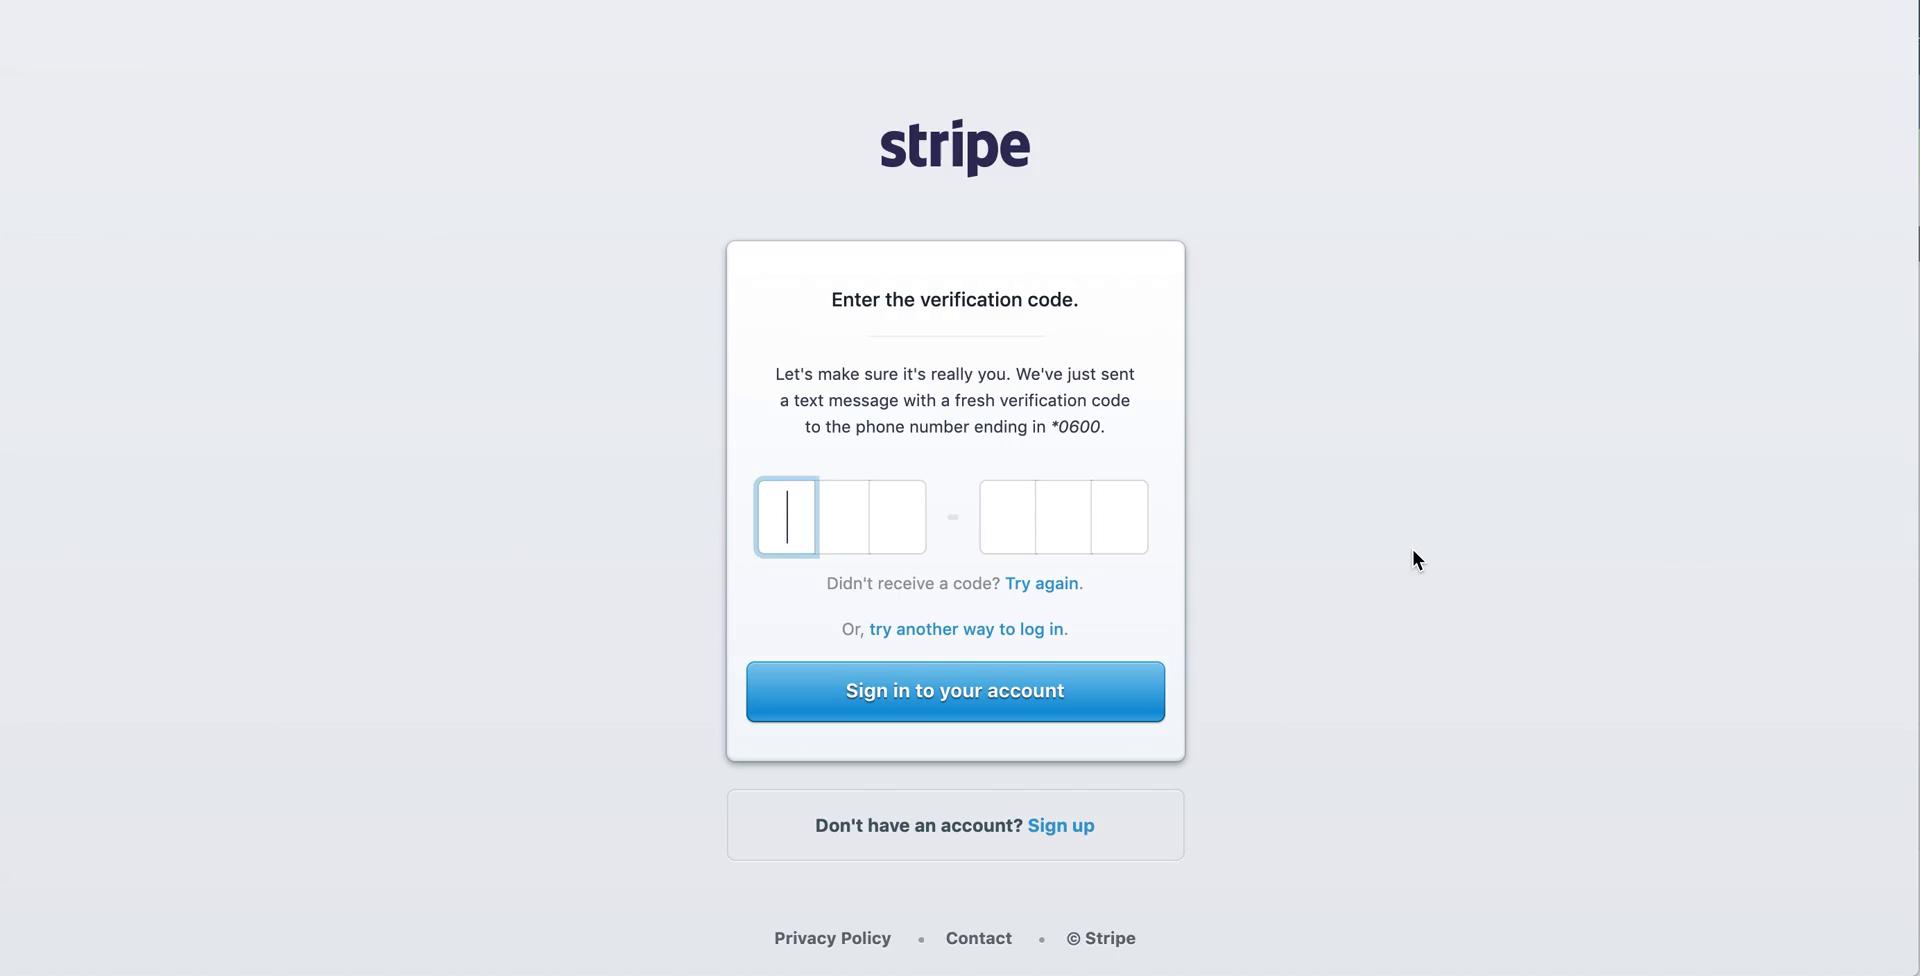
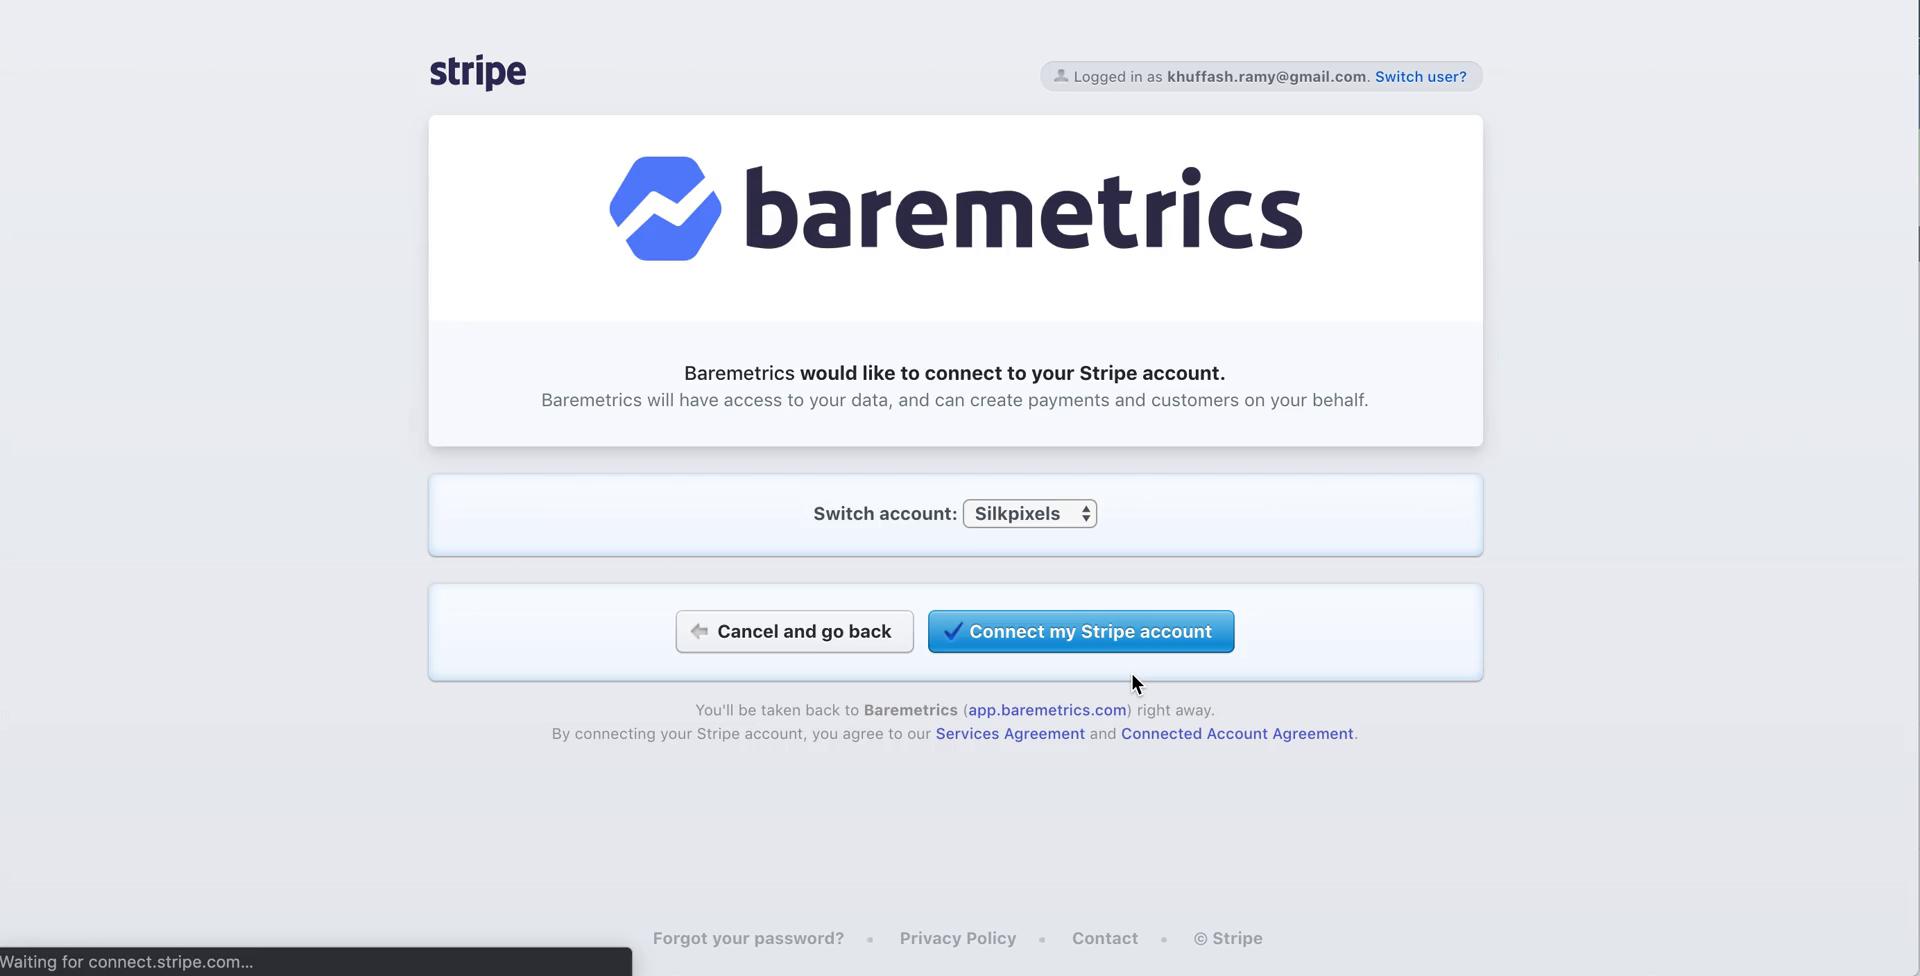
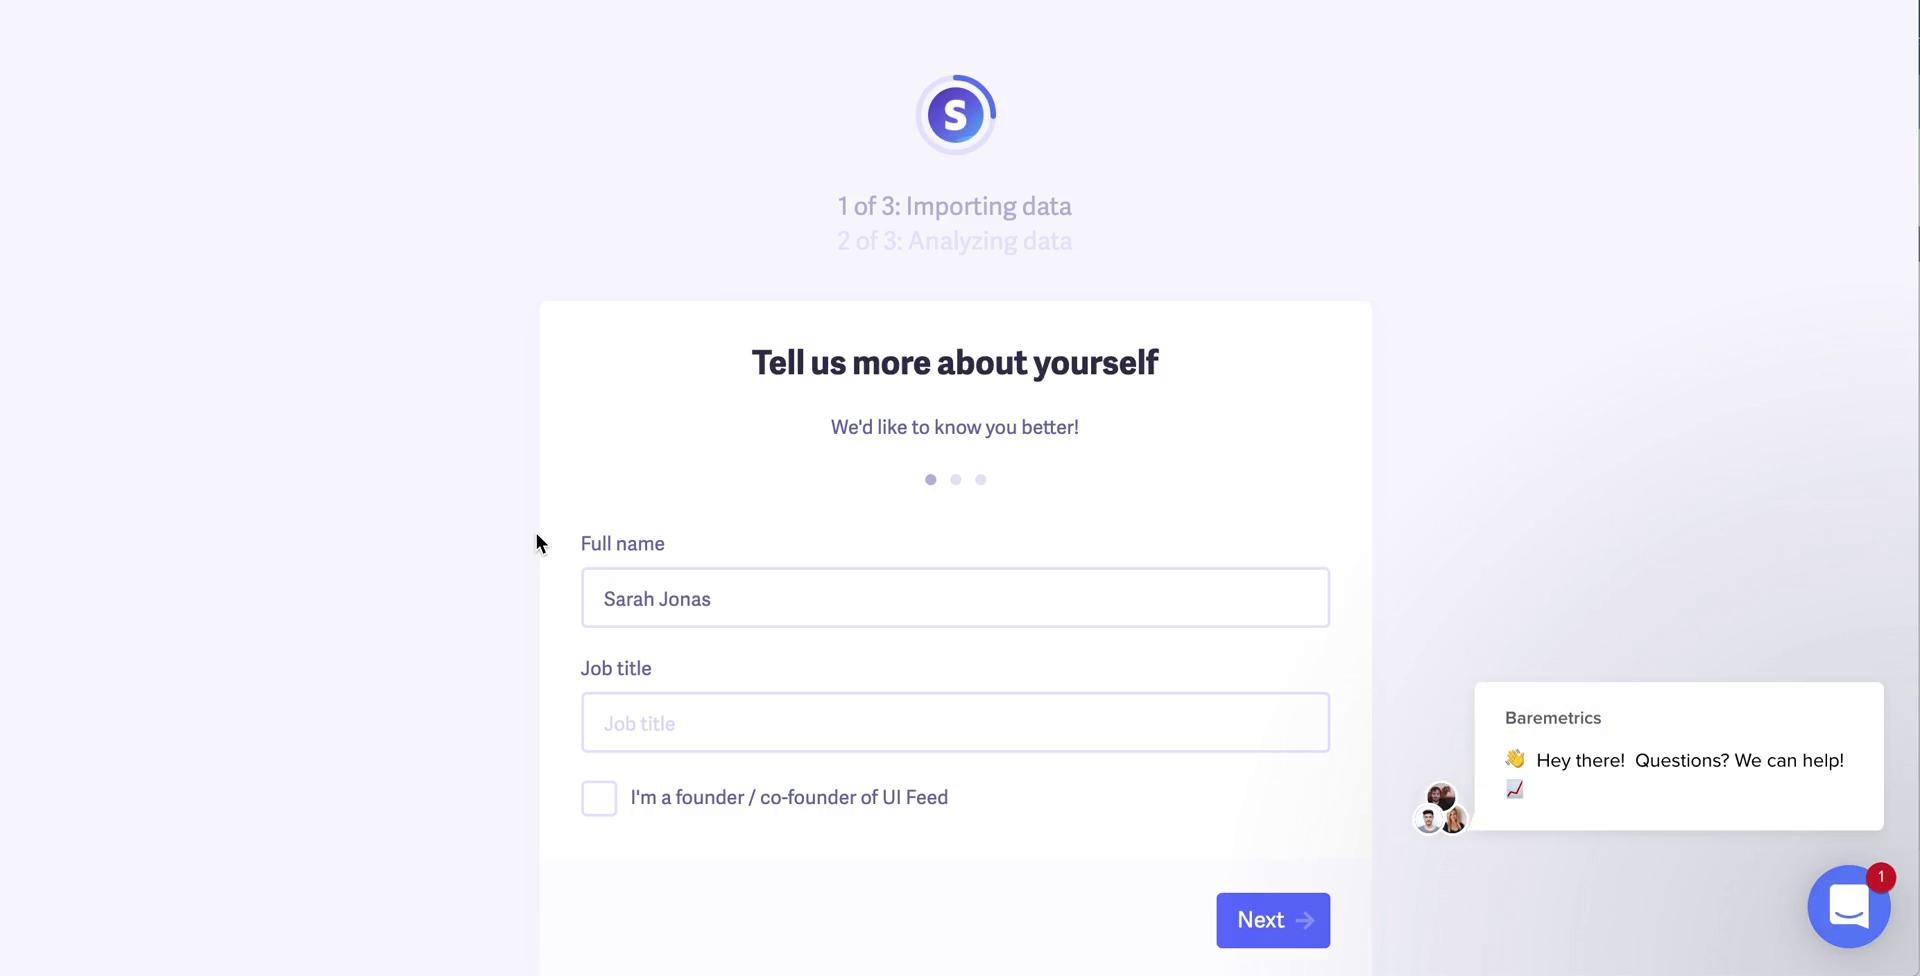
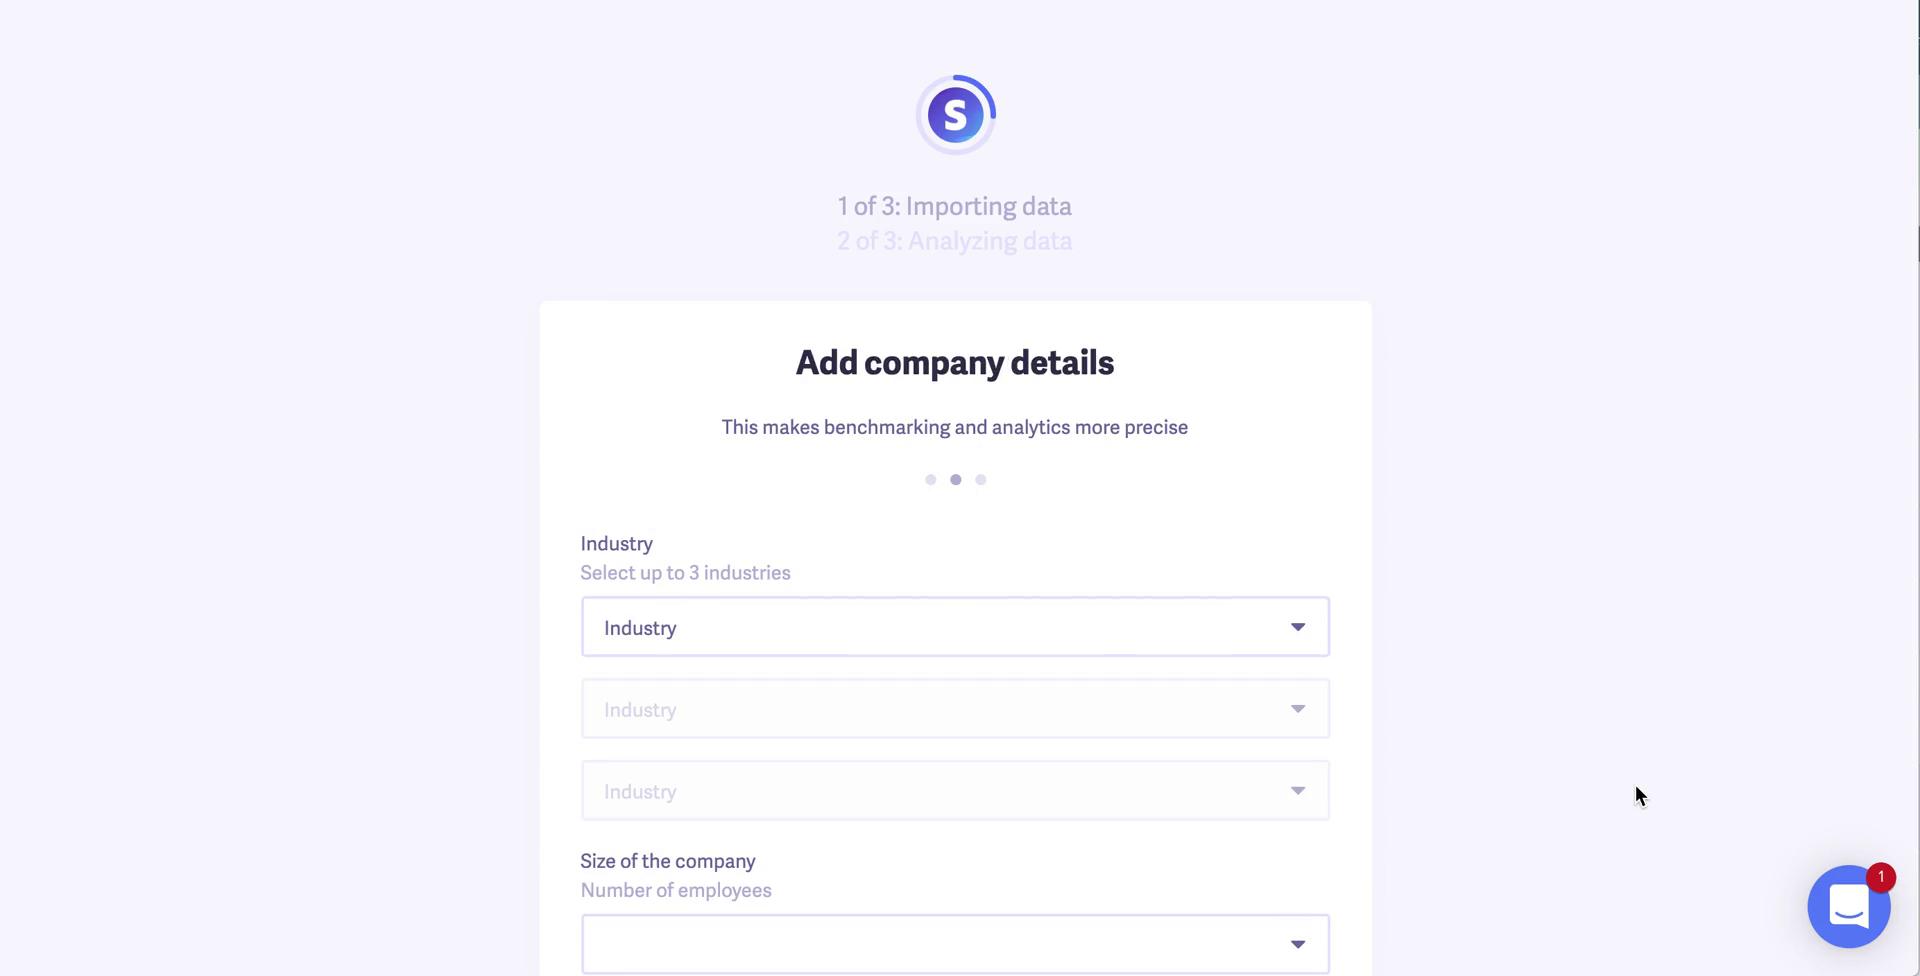
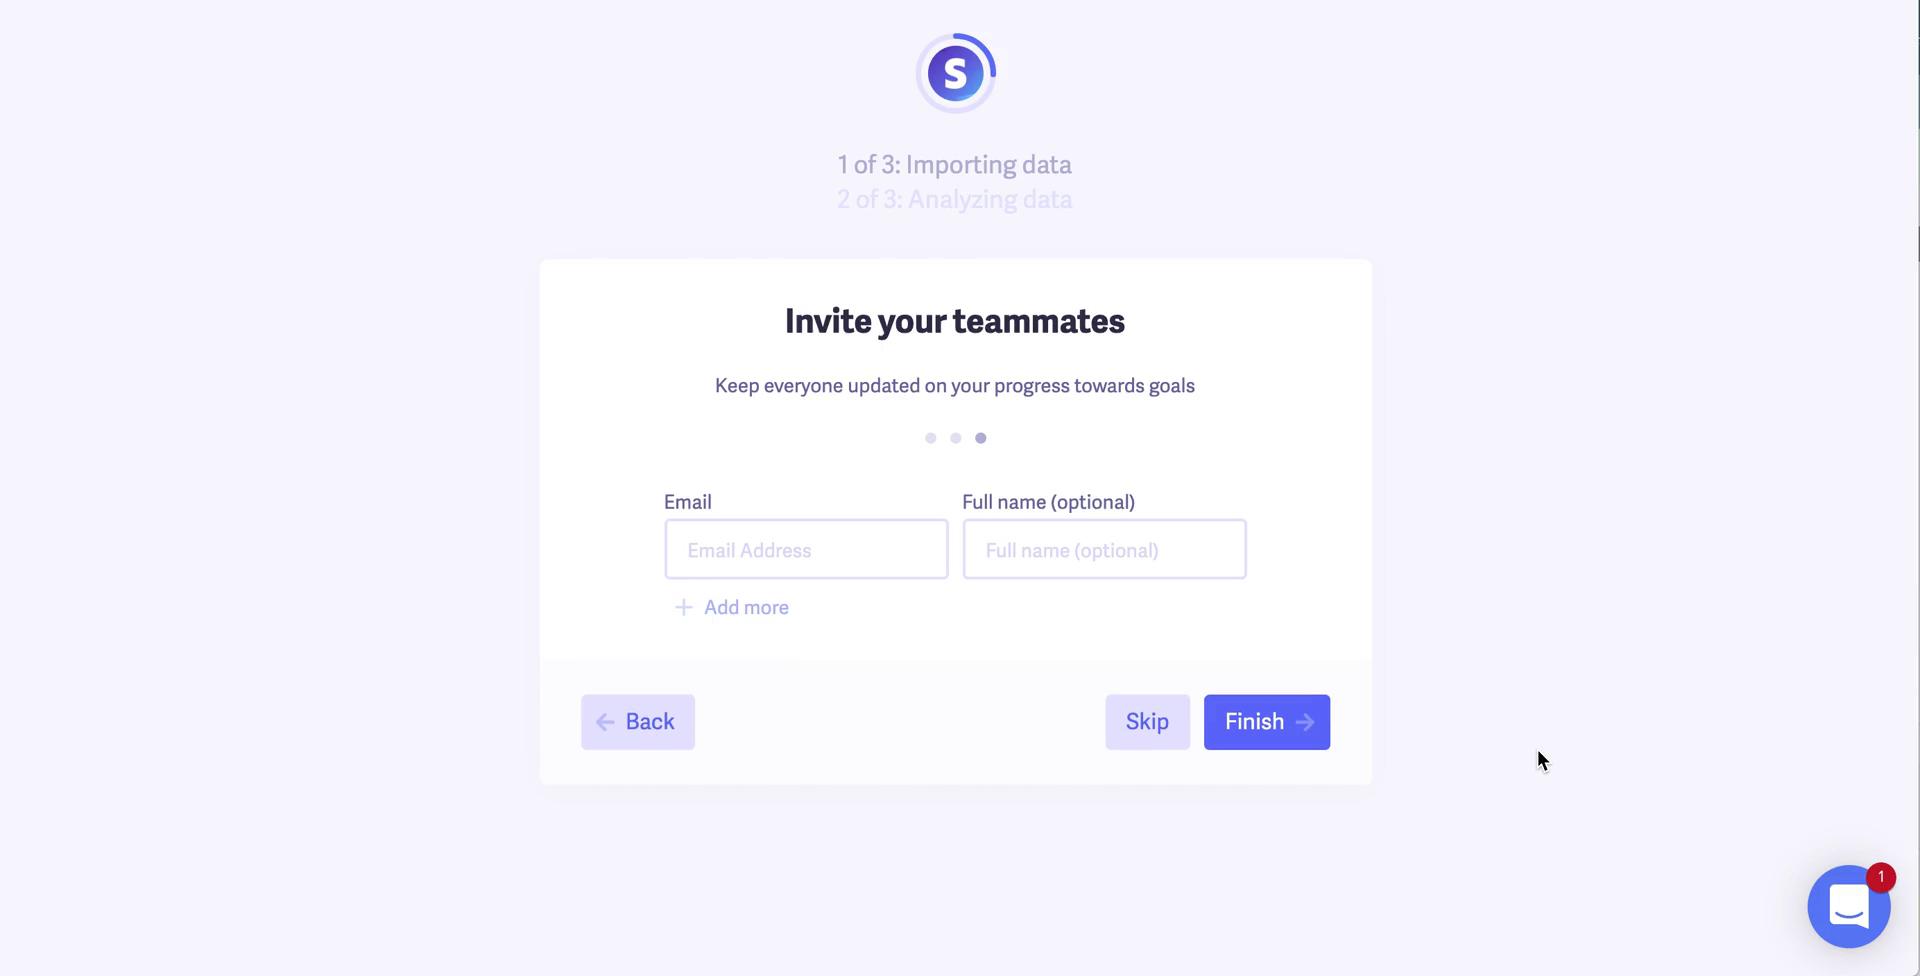
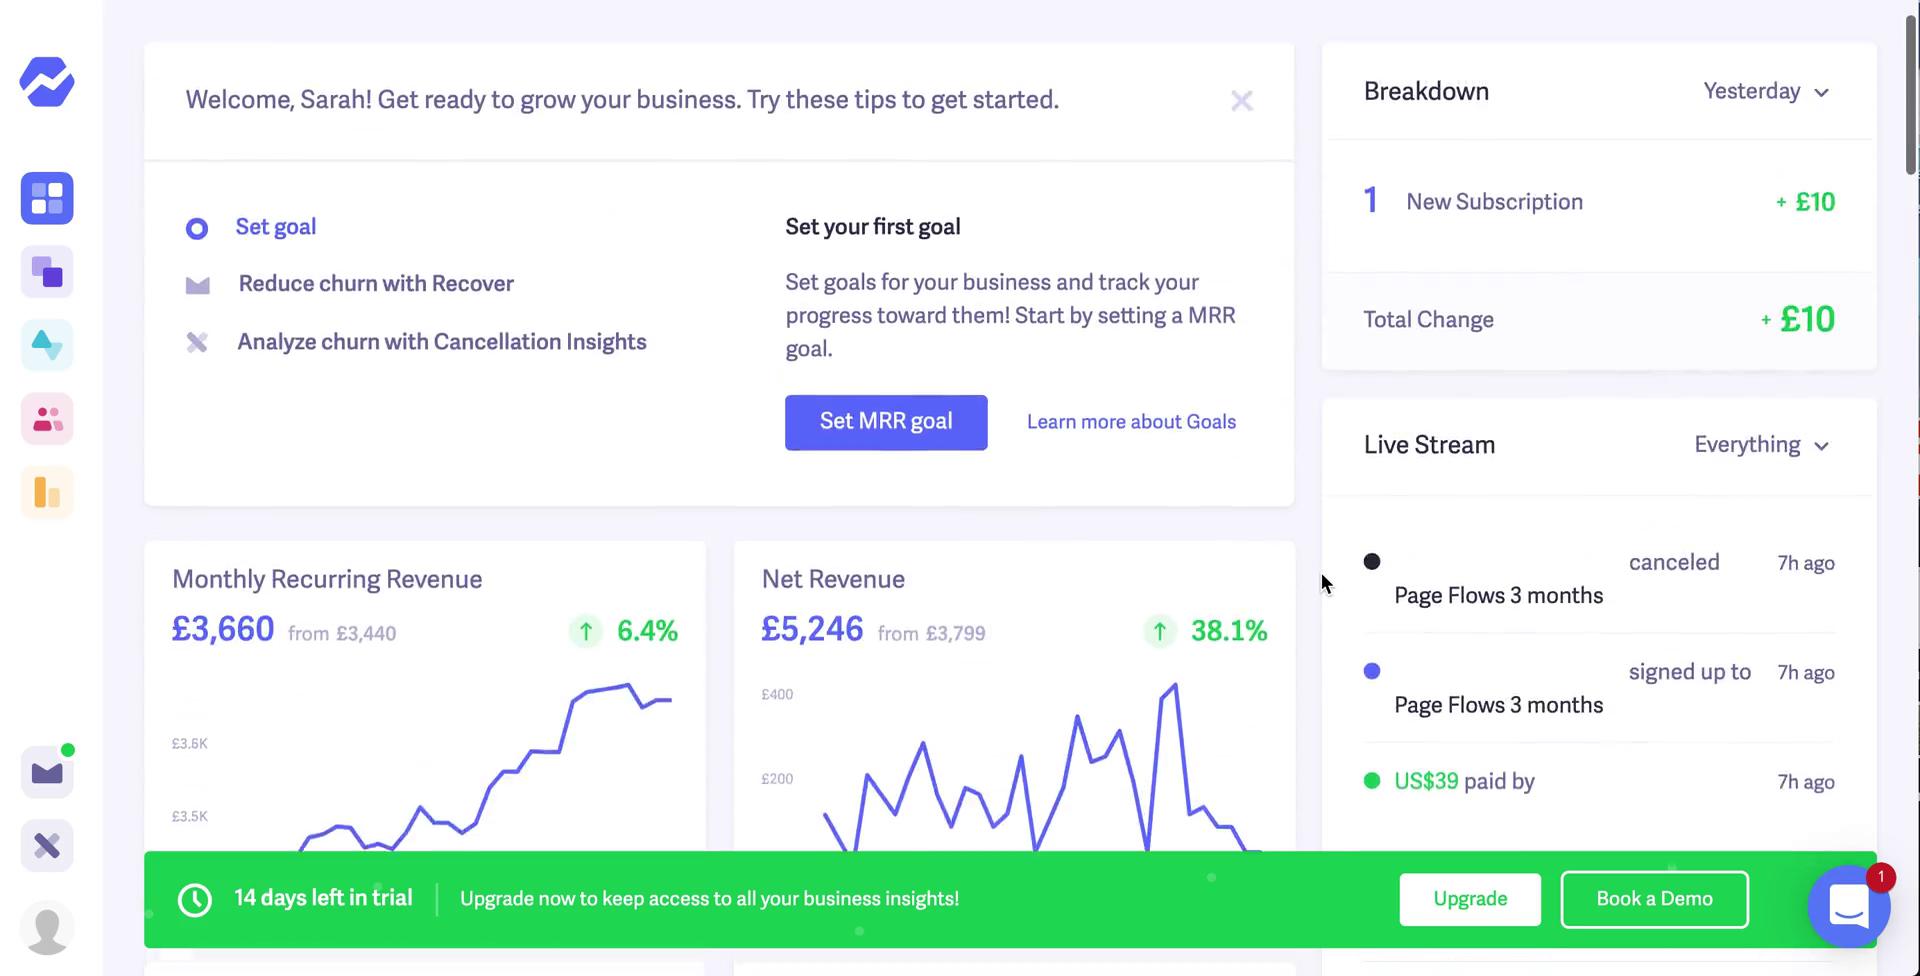
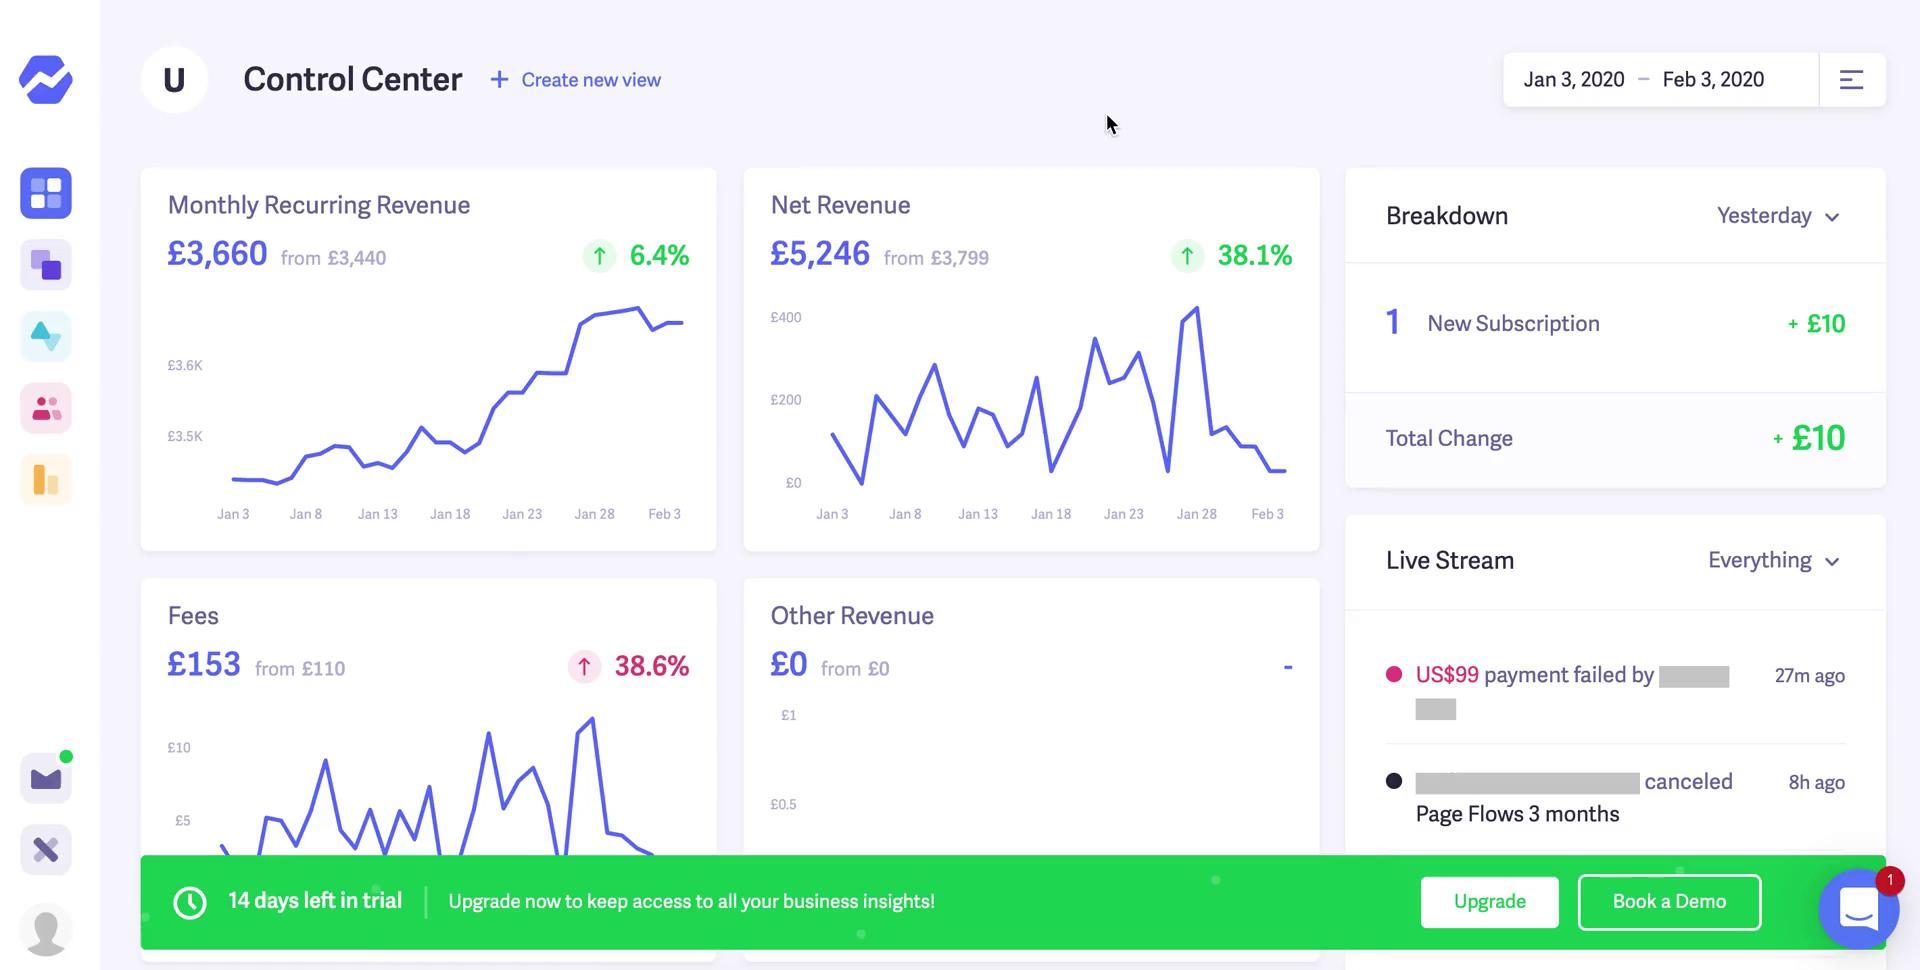
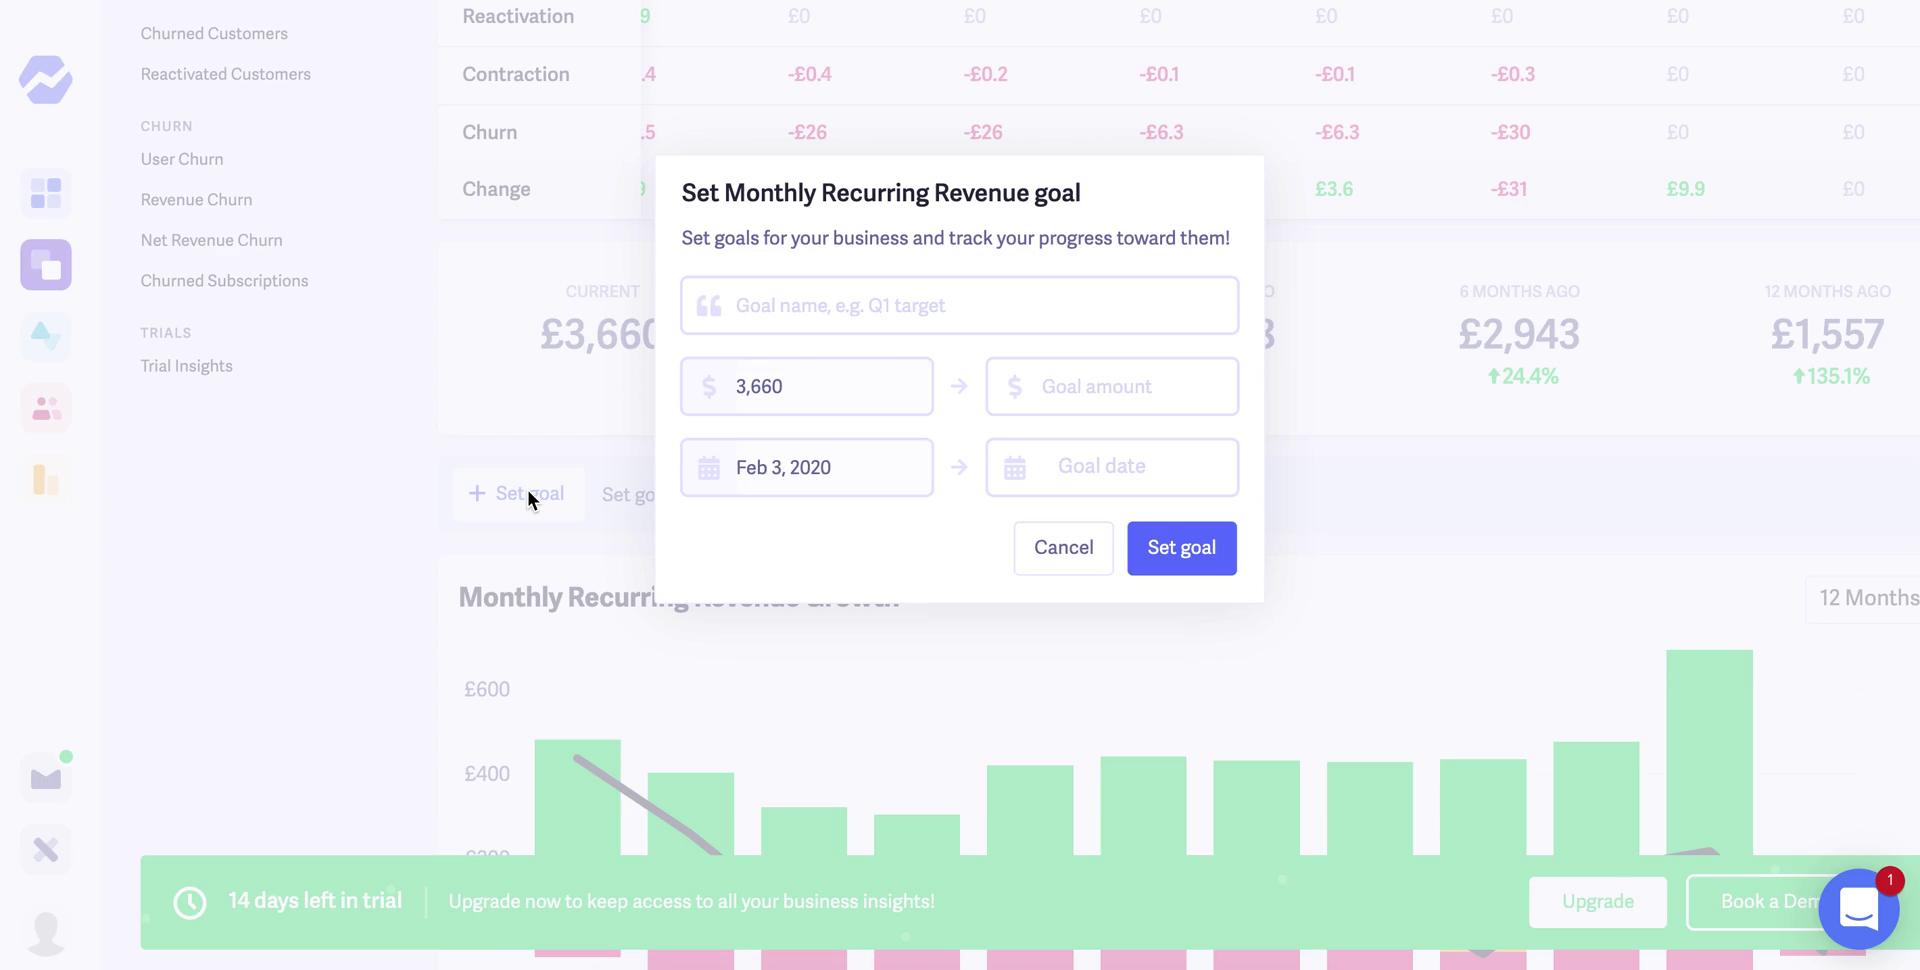
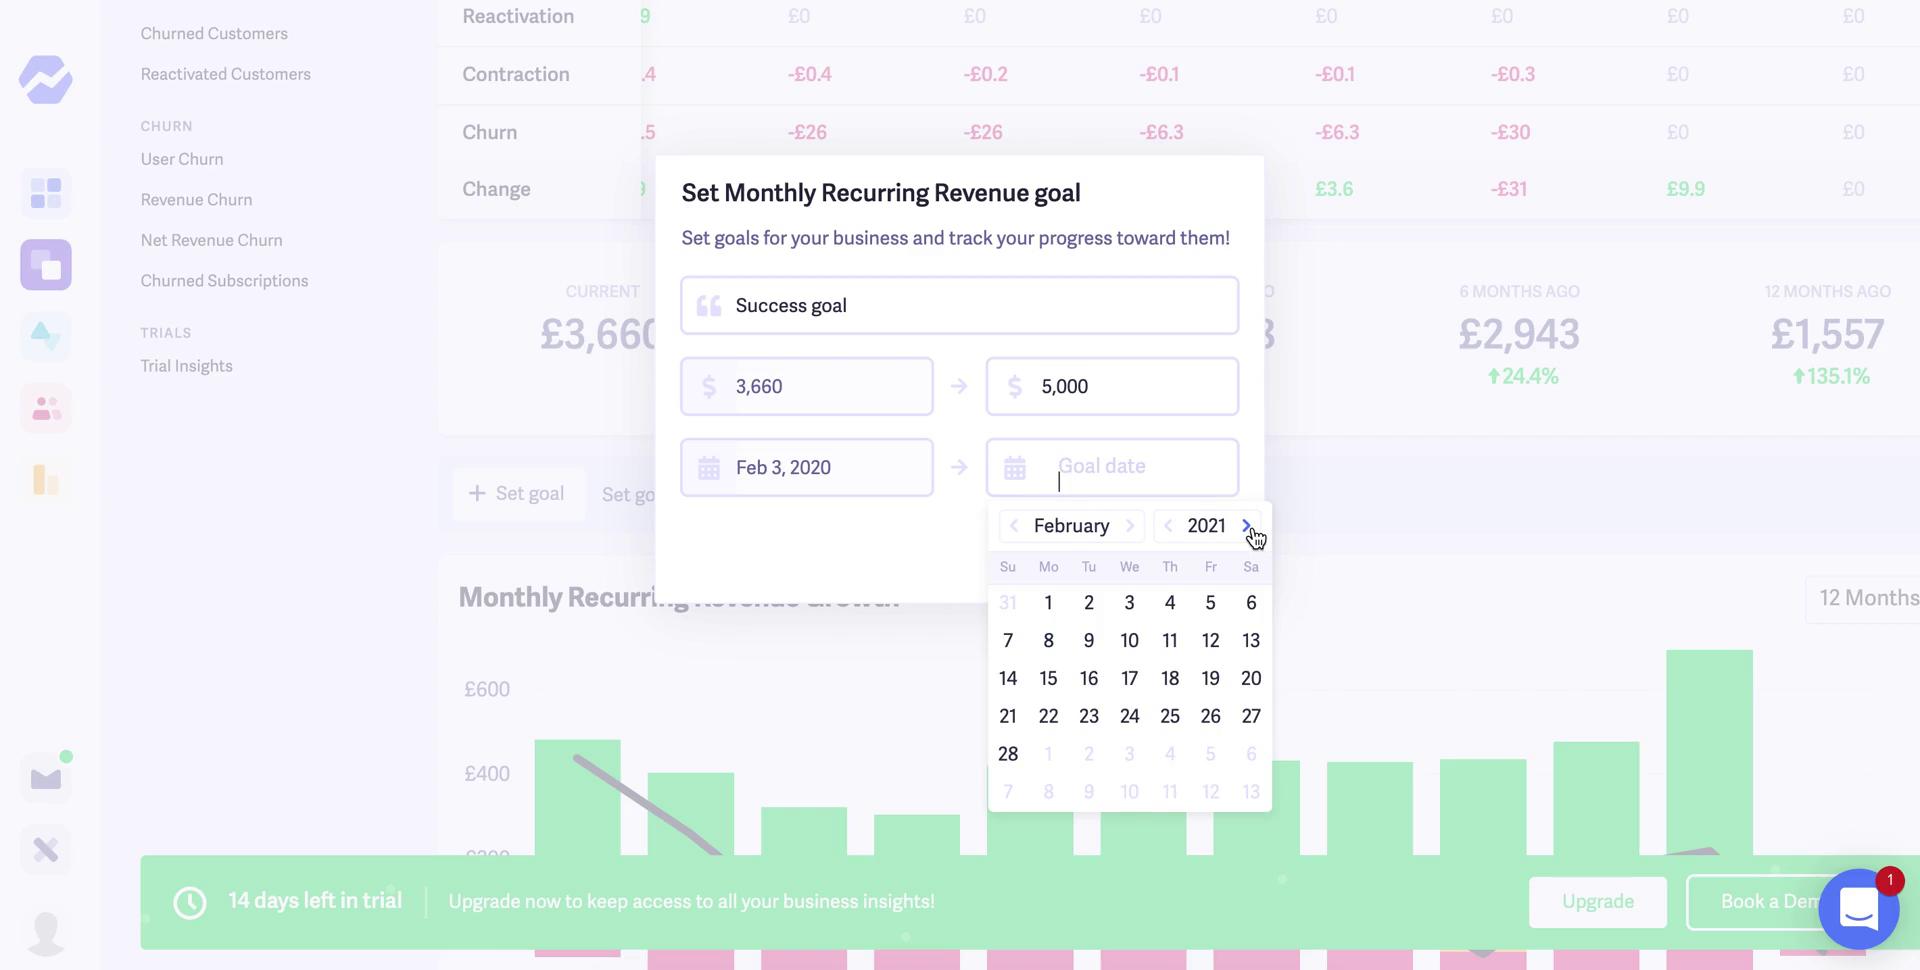
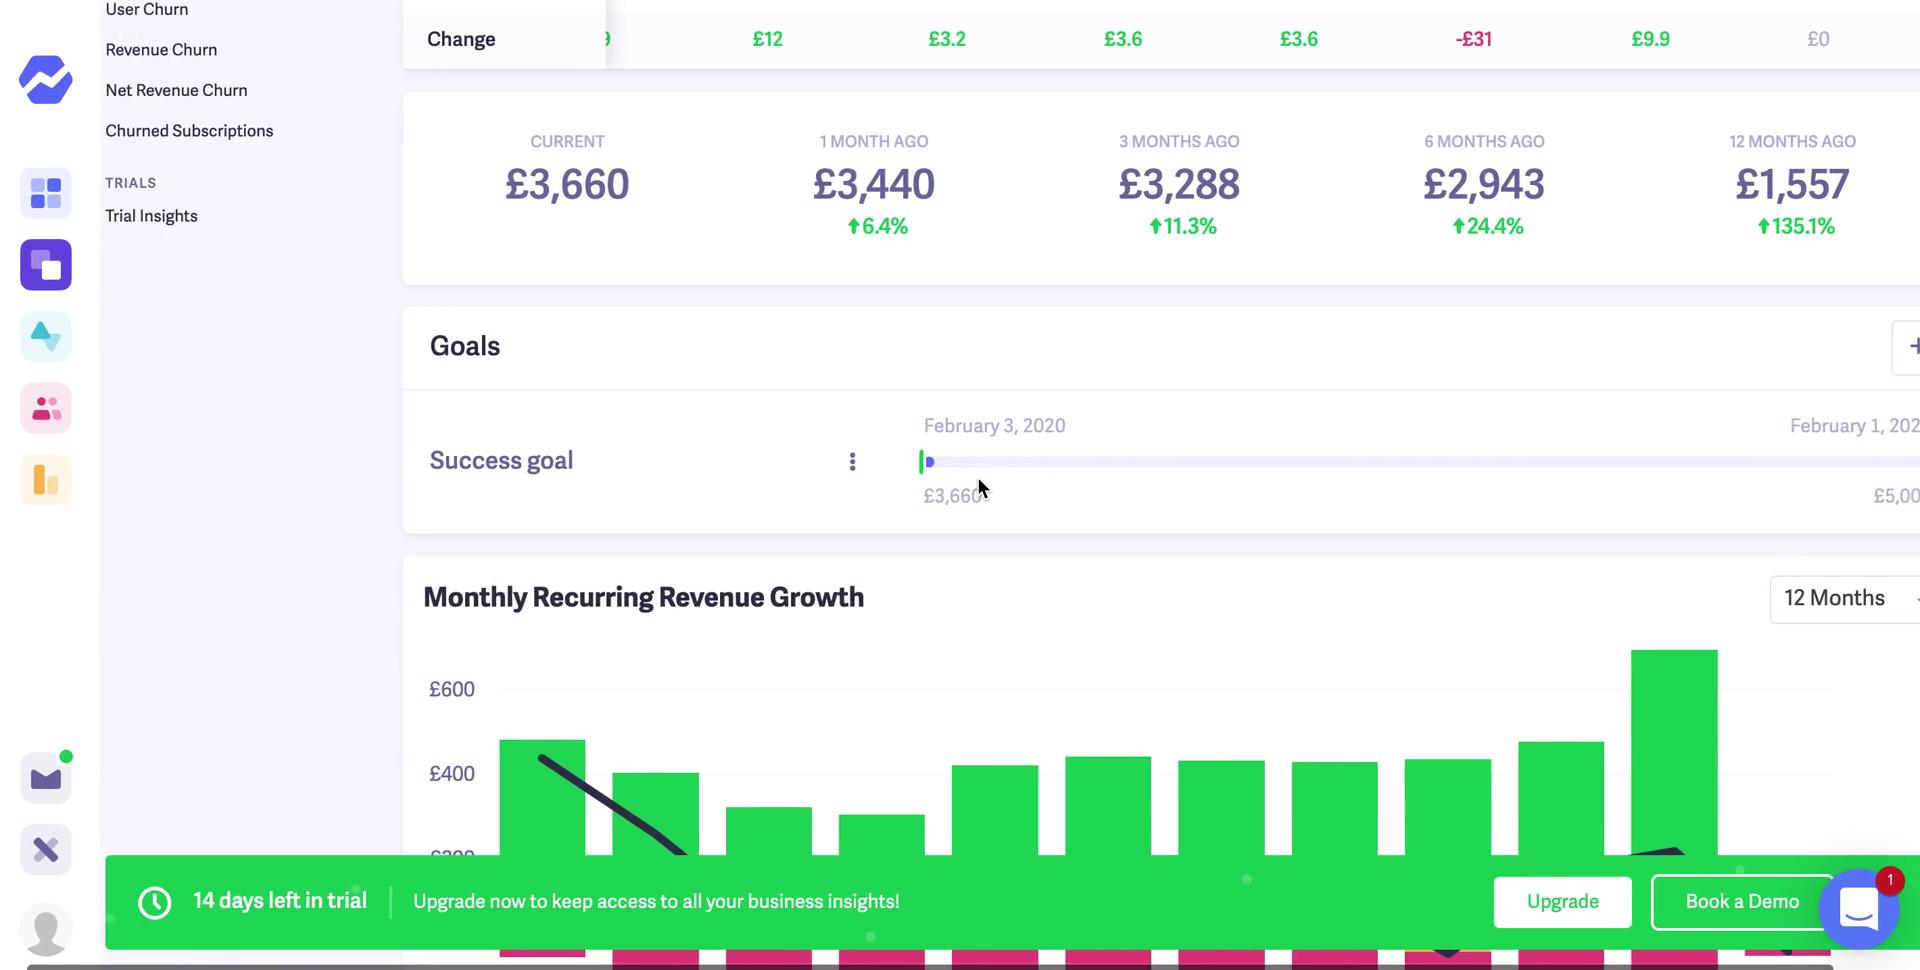
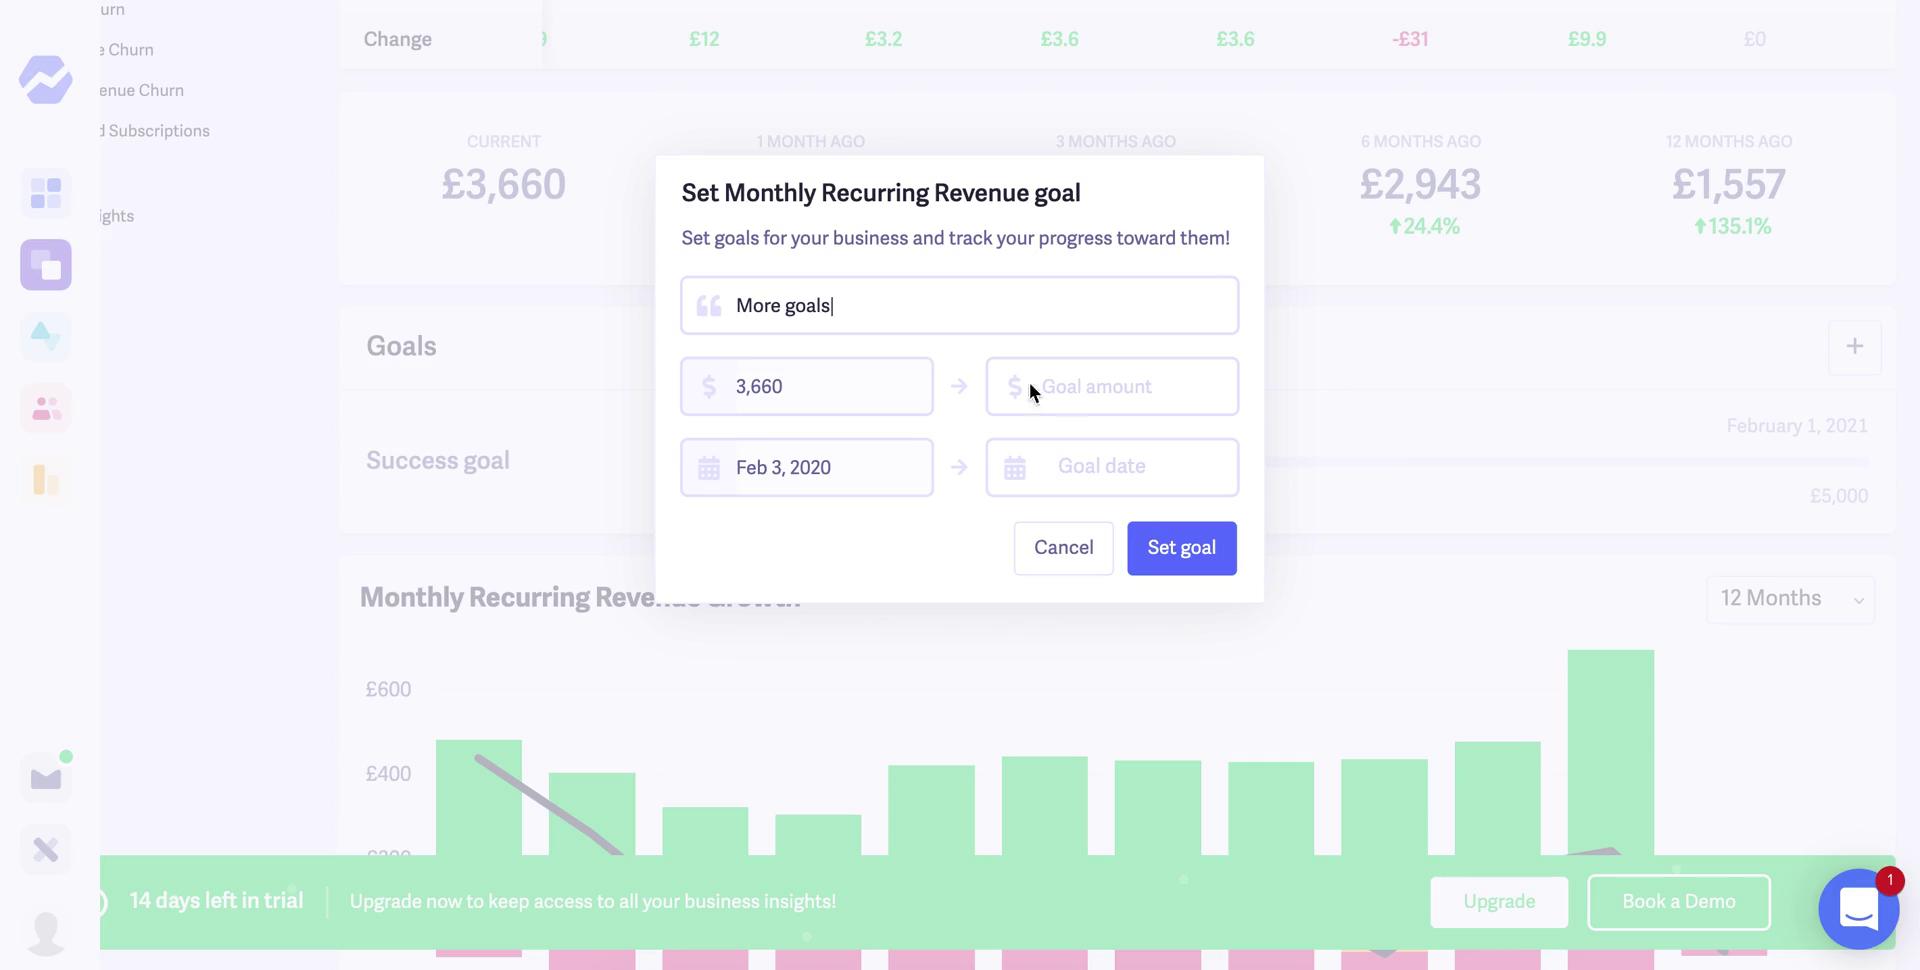
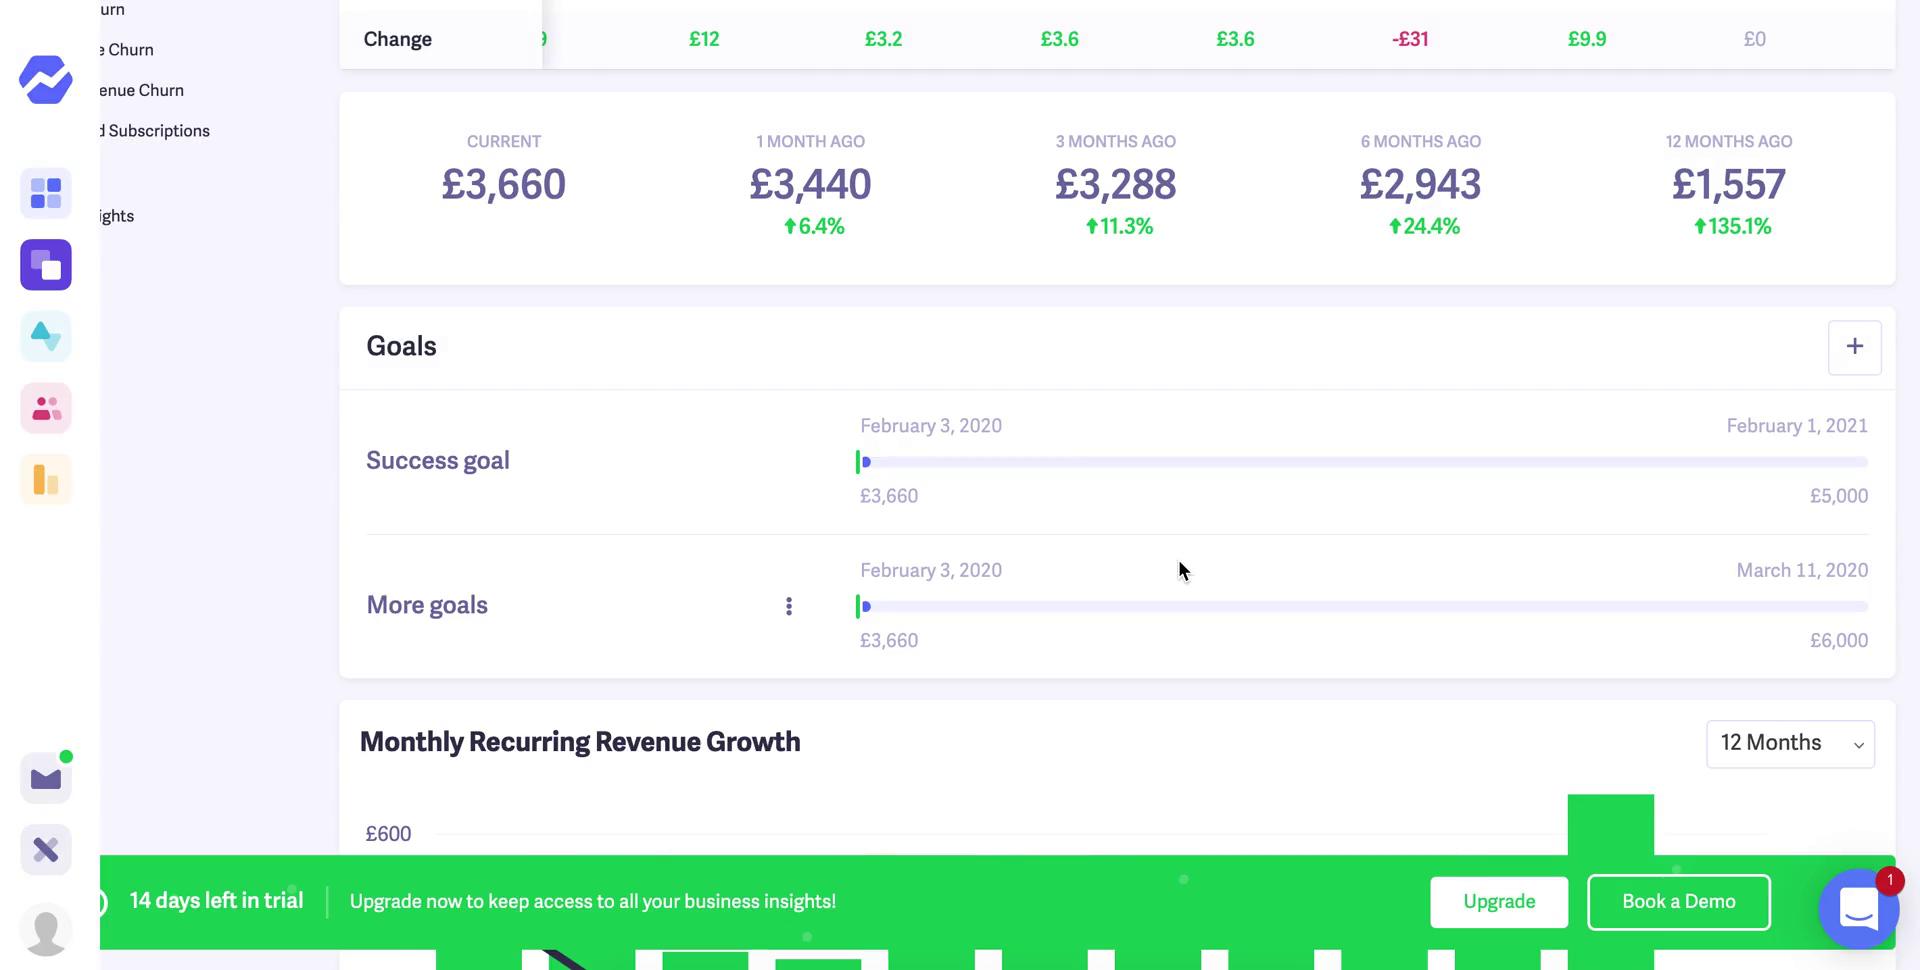
- Baremetrics
- Binance
- Cash App
- Chase
- Clearpay
- Crypto.com
- Curve
- Expensify
- Finimize
- Freetrade
- Klarna
- Lemonade
- Moneybox
- Monzo
- N26
- PayPal
- Plum
- QuickBooks
- Revolut
- Robinhood
- Square
- Stripe
- SumUp
- Venmo
- Wealthsimple
- Wise
- Xero
- YNAB
- eToro
- Airtable
- Amie
- Any.do
- Asana
- Beehiiv
- Charma
- ClassDojo
- Clearbit
- ClickUp
- Clockwise
- Coda
- ConvertKit
- Craft
- Crisp
- Day One
- Docusign
- Drip
- Dropbox Paper
- Flodesk
- Front
- Gamma
- Ghost
- Grammarly
- Hashnode
- HelloSign
- Homerun
- Honey
- Jasper
- Jotform
- Journey
- Klaviyo
- Mailchimp
- Microsoft Loop
- Notion
- Productboard
- Raycast
- Reflect
- Substack
- Superhuman
- SurveyMonkey
- SurveySparrow
- Todoist
- Toggl Track
- Twist
- Typeform
- Writesonic
- Airbnb
- Bolt
- Booking.com
- Citymapper
- Dott
- Expedia
- Go-Jek
- Going
- Gojek
- Grab
- Hopper
- Hostelworld
- HotelTonight
- Jump Bikes
- Kayak
- Klook
- Lime
- Lyft
- Marriott Bonvoy
- Ryanair
- Skyscanner
- TIER
- Touch Stay
- Trainline
- Tripadvisor
- Uber
- Vrbo
- Waze
- Bubble
- ClickFunnels
- Duda
- Ghost
- Glide
- Launchaco
- Leadpages
- Shopify
- Squarespace
- Teachable
- Unbounce
- Universe
- Webflow
- Wix
- WordPress
- Babbel
- Busuu
- ClassDojo
- Coursera
- Drops
- Duolingo
- Duolingo Math
- Elevate
- Headway
- Kajabi
- Memrise
- Mimo
- Pluralsight
- Podia
- Quizlet
- Scribe
- Seesaw
- Skillshare
- Teachable
- Udemy
- Uptime
- BeReal.
- Clay - Story Templates
- Disney+
- Hopin
- Hulu
- Kick
- Netflix
- Now TV
- Quibi
- Shudder
- TouchNote
- Twitch
- VEED.IO
- VideoAsk
- Vidyard
- Vimeo
- Wistia
- YouTube
- BeReal.
- Beacons
- Bumble
- Buy Me a Coffee
- Circle
- Clay
- Clubhouse
- Discord
- GoFundMe
- Hallow
- Hashnode
- Kick
- Kickstarter
- Patreon
- Racket
- Shuffles
- Snapchat
- Threads
- TikTok
- Twitch
- Burger King
- Caviar
- DoorDash
- Foodvisor
- Glovo
- Go-Jek
- Gojek
- Gopuff
- Gorillas
- Gousto
- Grab
- Grubhub
- Instacart
- Just Eat
- OpenTable
- Postmates
- Too Good To Go
- Uber Eats
- Wolt
- Yelp
- foodpanda
- ASOS
- Airbnb
- Amazon
- Beacons
- Booking.com
- Clearpay
- Craigslist
- DICE
- Depop
- Dollar Shave Club
- EE
- Etsy
- Fiverr
- Glovo
- Goat
- Gopuff
- Gorillas
- Grubhub
- Gumroad
- IKEA
- Indeed
- Instacart
- Klaviyo
- Meetup
- Mercari
- Moonpig
- OfferUp
- Otta
- Poshmark
- SNKRS by Nikes
- Shein
- Shop
- Shpock
- TouchNote
- Udemy
- Vinted
- Wallapop
- Walmart
- Whatnot
- Zola
- eBay
- thredUP
- Amplitude
- Better Stack
- Cloudflare
- GitHub
- Jira
- Linear
- Pluralsight
- Rainforest
- Raycast
- Replit
- Trustpilot
- Twilio
- Uxcel
- AllTrails
- Balance
- Calm
- ClassPass
- Clue
- DailyBean
- FitOn
- Fitbit
- Fitbod
- Flipd
- Flo
- Foodvisor
- Glo
- Glow
- Gyroscope
- Headspace
- Lifesum
- Me+
- MyFitnessPal
- Nike Run Club
- Noom
- Reflectly
- Sanvello
- ShutEye
- Strava
- Sweatcoin
- WW (Weight Watchers)
- Withings Healthmate
- Yuka
- Zero
- 1Password
- Ahrefs
- Aircall
- Airtable
- Amplitude
- Any.do
- Arc.dev
- Asana
- Baremetrics
- Basecamp
- Beehiiv
- Bitly
- Box
- Bubble
- Buy Me a Coffee
- Bynder
- Calendly
- Canny
- Circle
- Clearbit
- ClickFunnels
- ClickUp
- Clockwise
- Cloudflare
- Coda
- ConvertKit
- CopyAI
- Craft
- Customer.io
- Deputy
- Descript
- Docusign
- Dovetail
- Drip
- Dropbox
- Dropbox Paper
- Duda
- Eventbrite
- Evernote
- Fathom
- Figma
- Flodesk
- Framer
- Front
- Fullstory
- GatherContent
- Ghost
- GitHub
- Glide
- GoDaddy
- Grammarly
- Gumroad
- Guru
- Harvest
- Height
- HelloSign
- Help Scout
- HoneyBook
- Hopin
- Hotjar
- HubSpot CRM
- InVision
- Indeed
- Interact
- Intercom
- Jasper
- Jira
- Jotform
- Kajabi
- Klaviyo
- Lark
- Launchaco
- Leadpages
- Linear
- Linktree
- Litmus
- Loom
- Mailchimp
- Make.com
- Mercari
- Microsoft Teams
- Miro
- Mixpanel
- Monday
- Nolt
- Notion
- Otta
- PandaDoc
- PayPal
- Pipedrive
- Pitch
- Playbook
- Podia
- PostHog
- Process Street
- Productboard
- QuickBooks
- Quill
- Rainforest
- Raycast
- Reflect
- Replit
- Retool
- Salesforce
- SavvyCal
- Scribe
- Shopify
- Slack
- Slite
- Softstart
- Soundtrap
- Spline
- Sprig
- Square
- Squarespace
- Squarespace Scheduling
- Stripe
- SumUp
- Sunsama
- Superhuman
- SurveyMonkey
- SurveySparrow
- Tally
- Tango
- Teachable
- Todoist
- Tome
- Touch Stay
- Transistor
- Trello
- Twilio
- Typeform
- Unbounce
- Universe
- VEED.IO
- VideoAsk
- Vidyard
- Waitwhile
- Webflow
- Whereby
- Whimsical
- Wistia
- Wix
- Wrike
- Writesonic
- Xero
- YNAB
- Zapier
- Zendesk
- Zoom