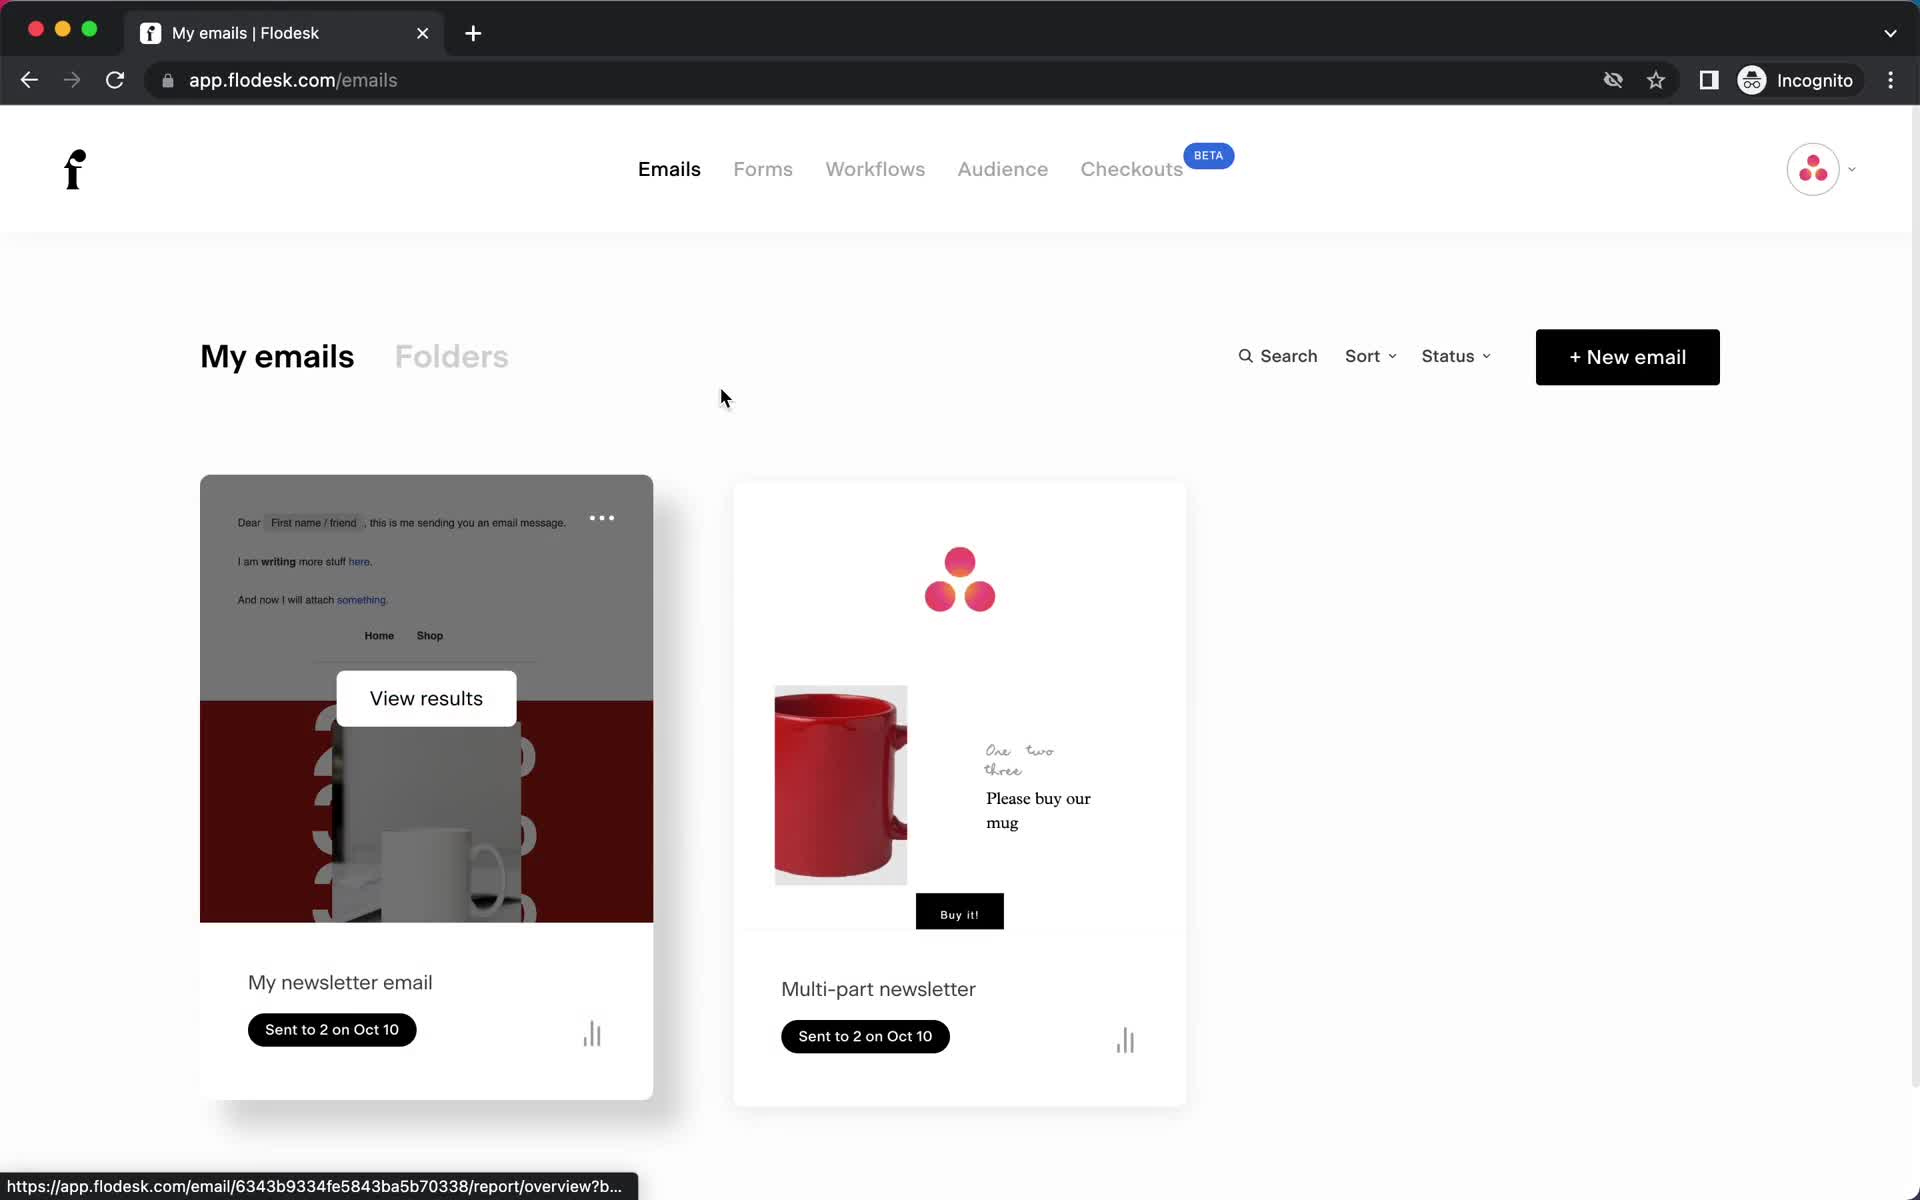
Email campaigns
this is title
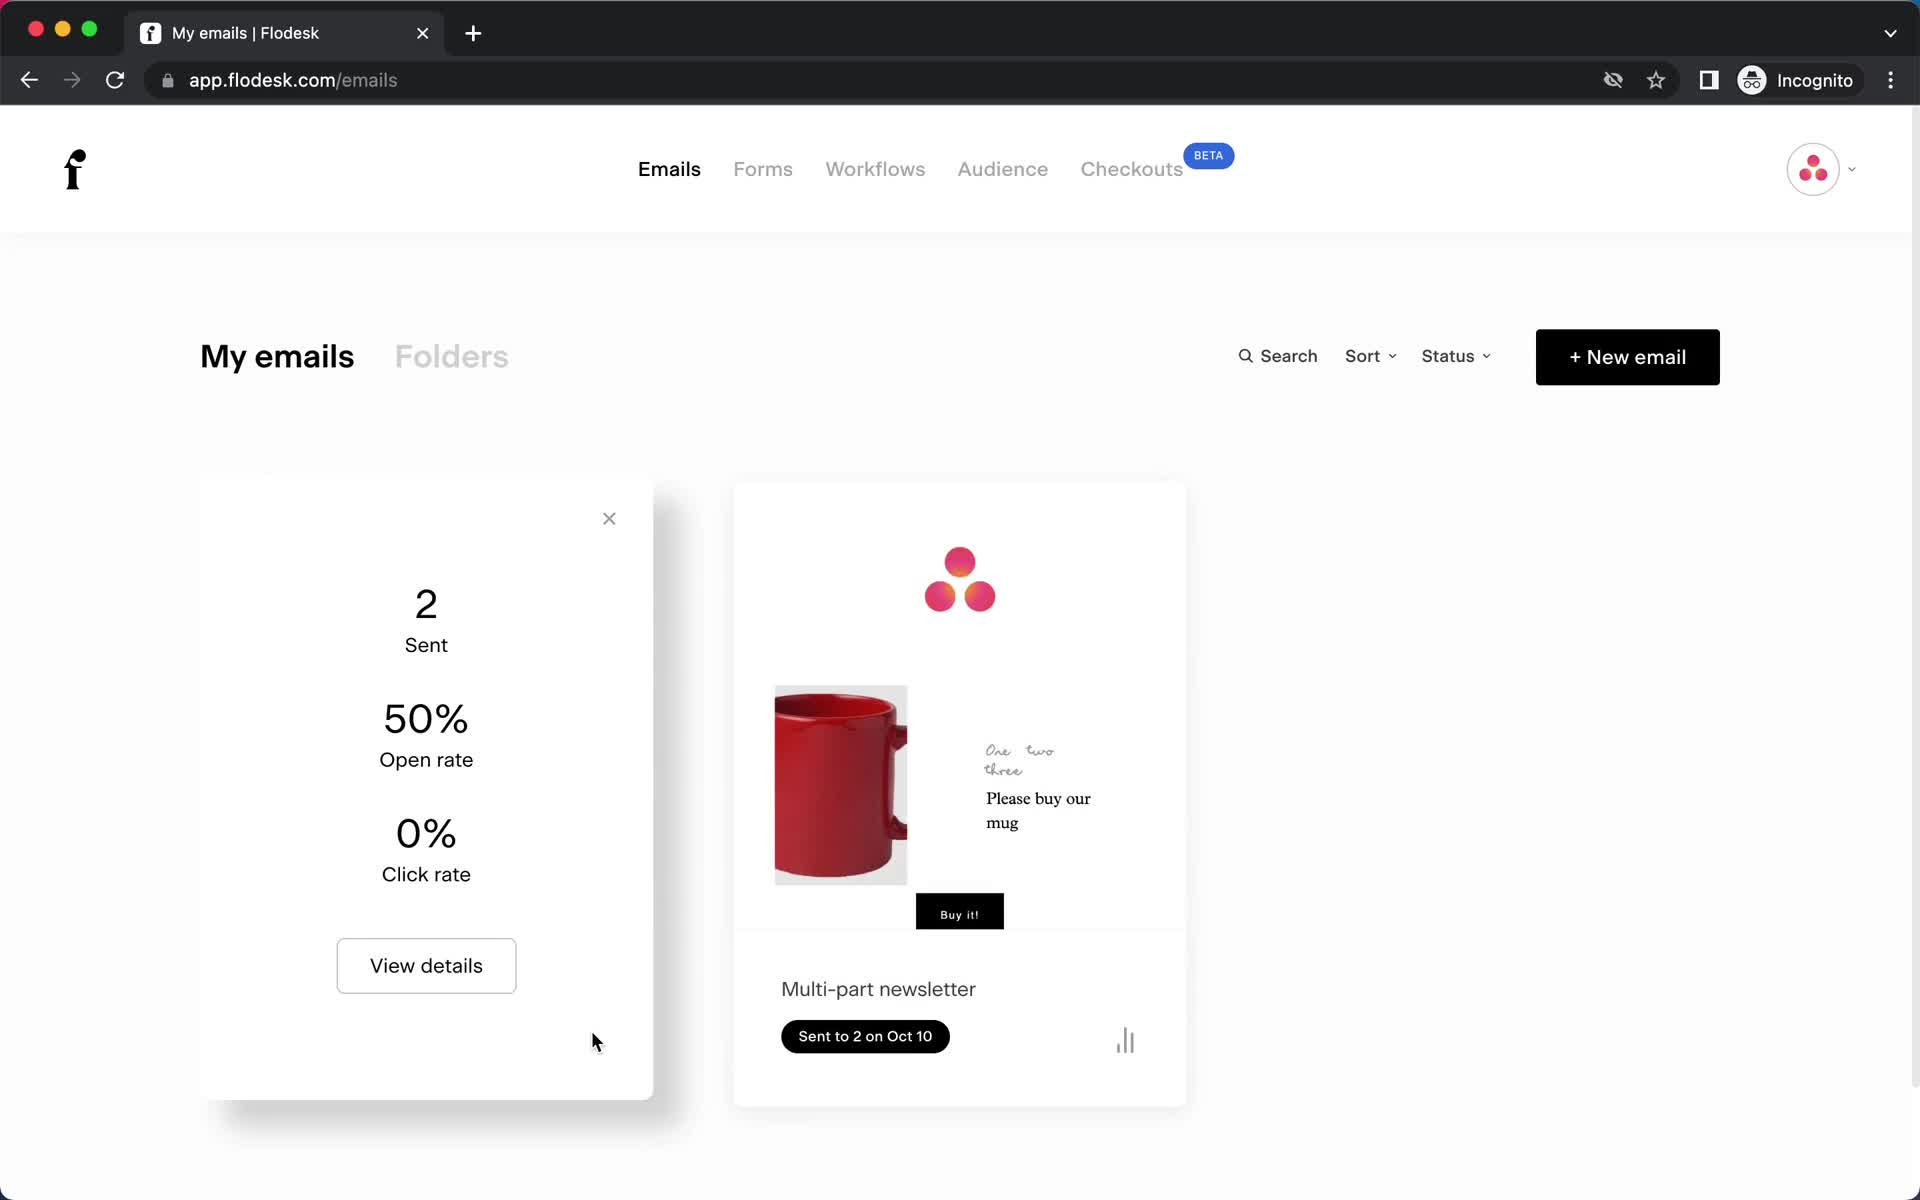
Stats
this is title
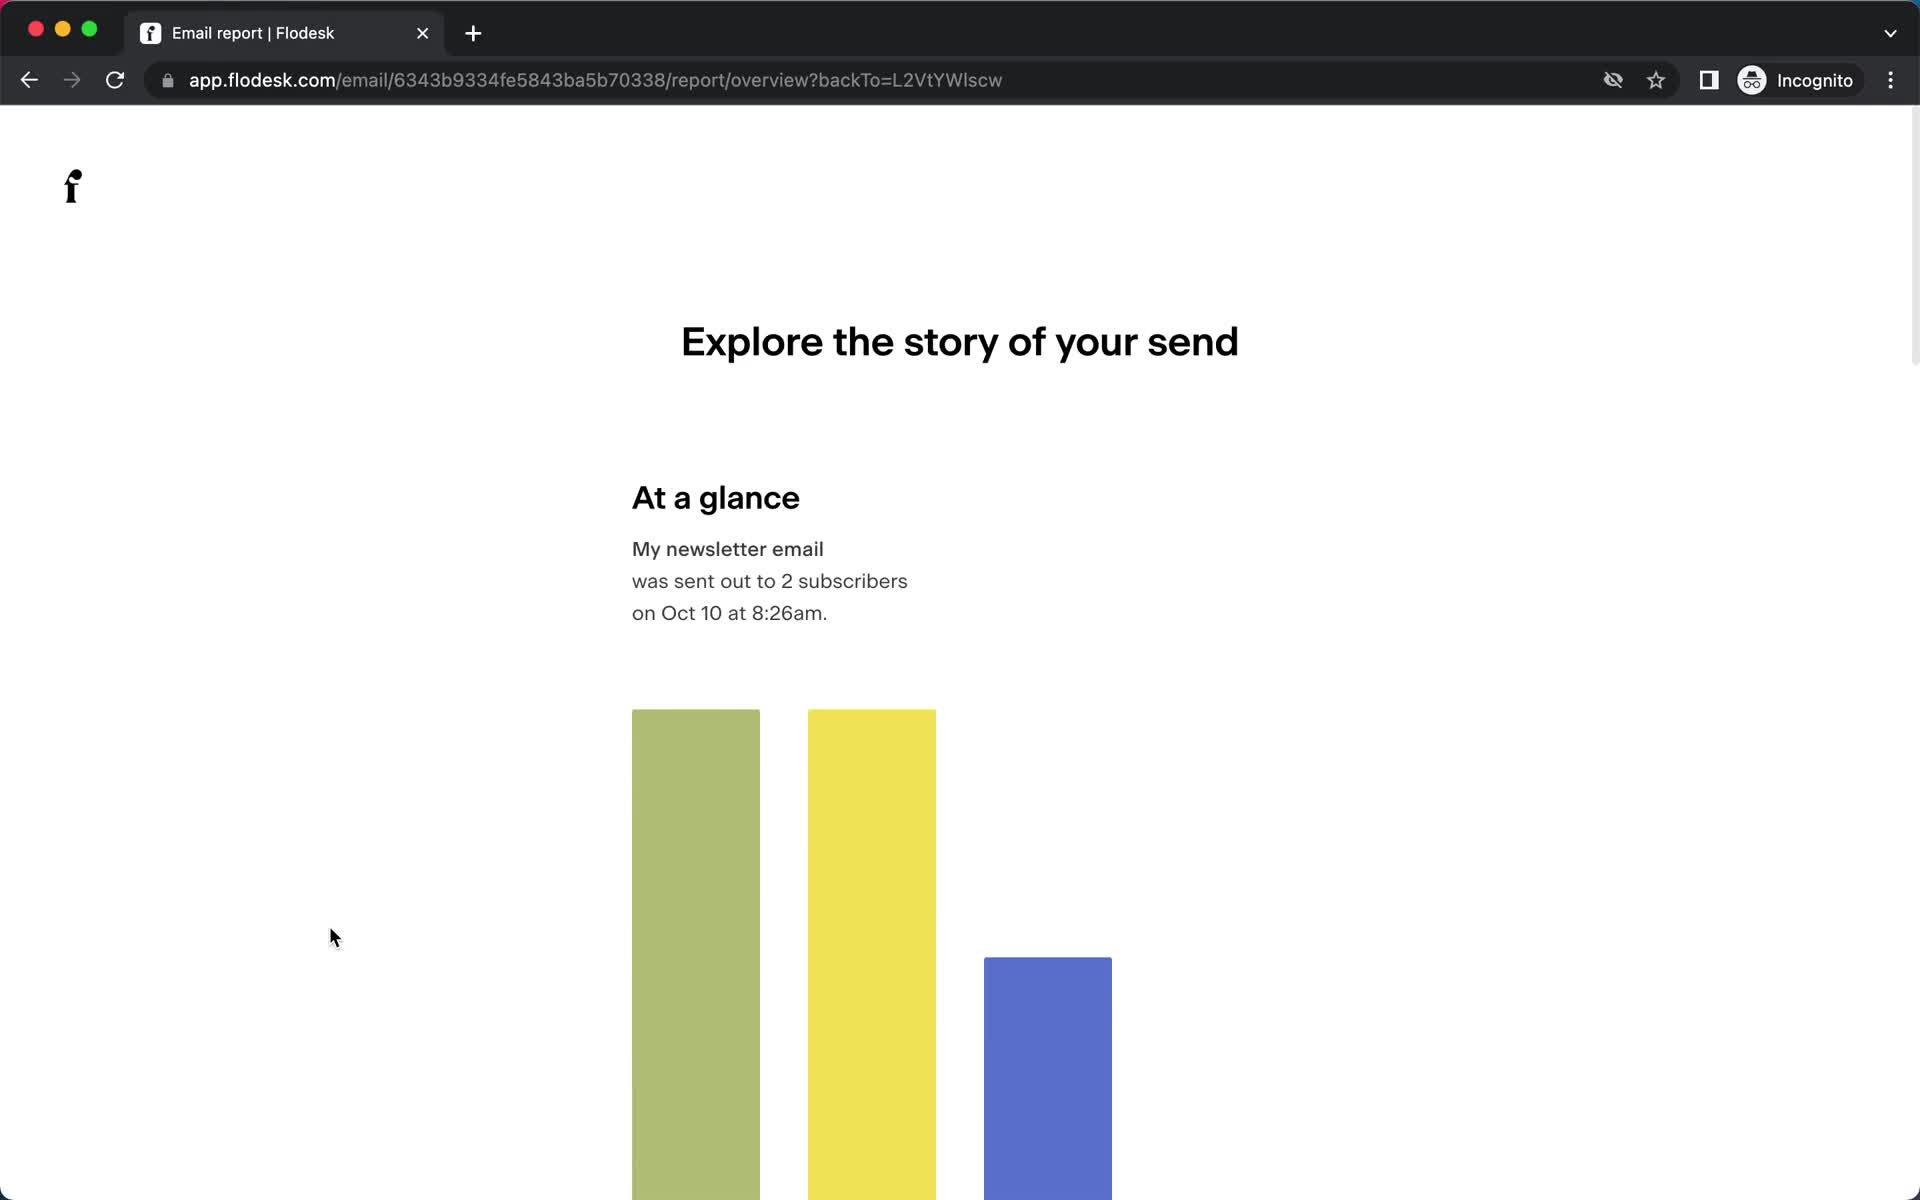
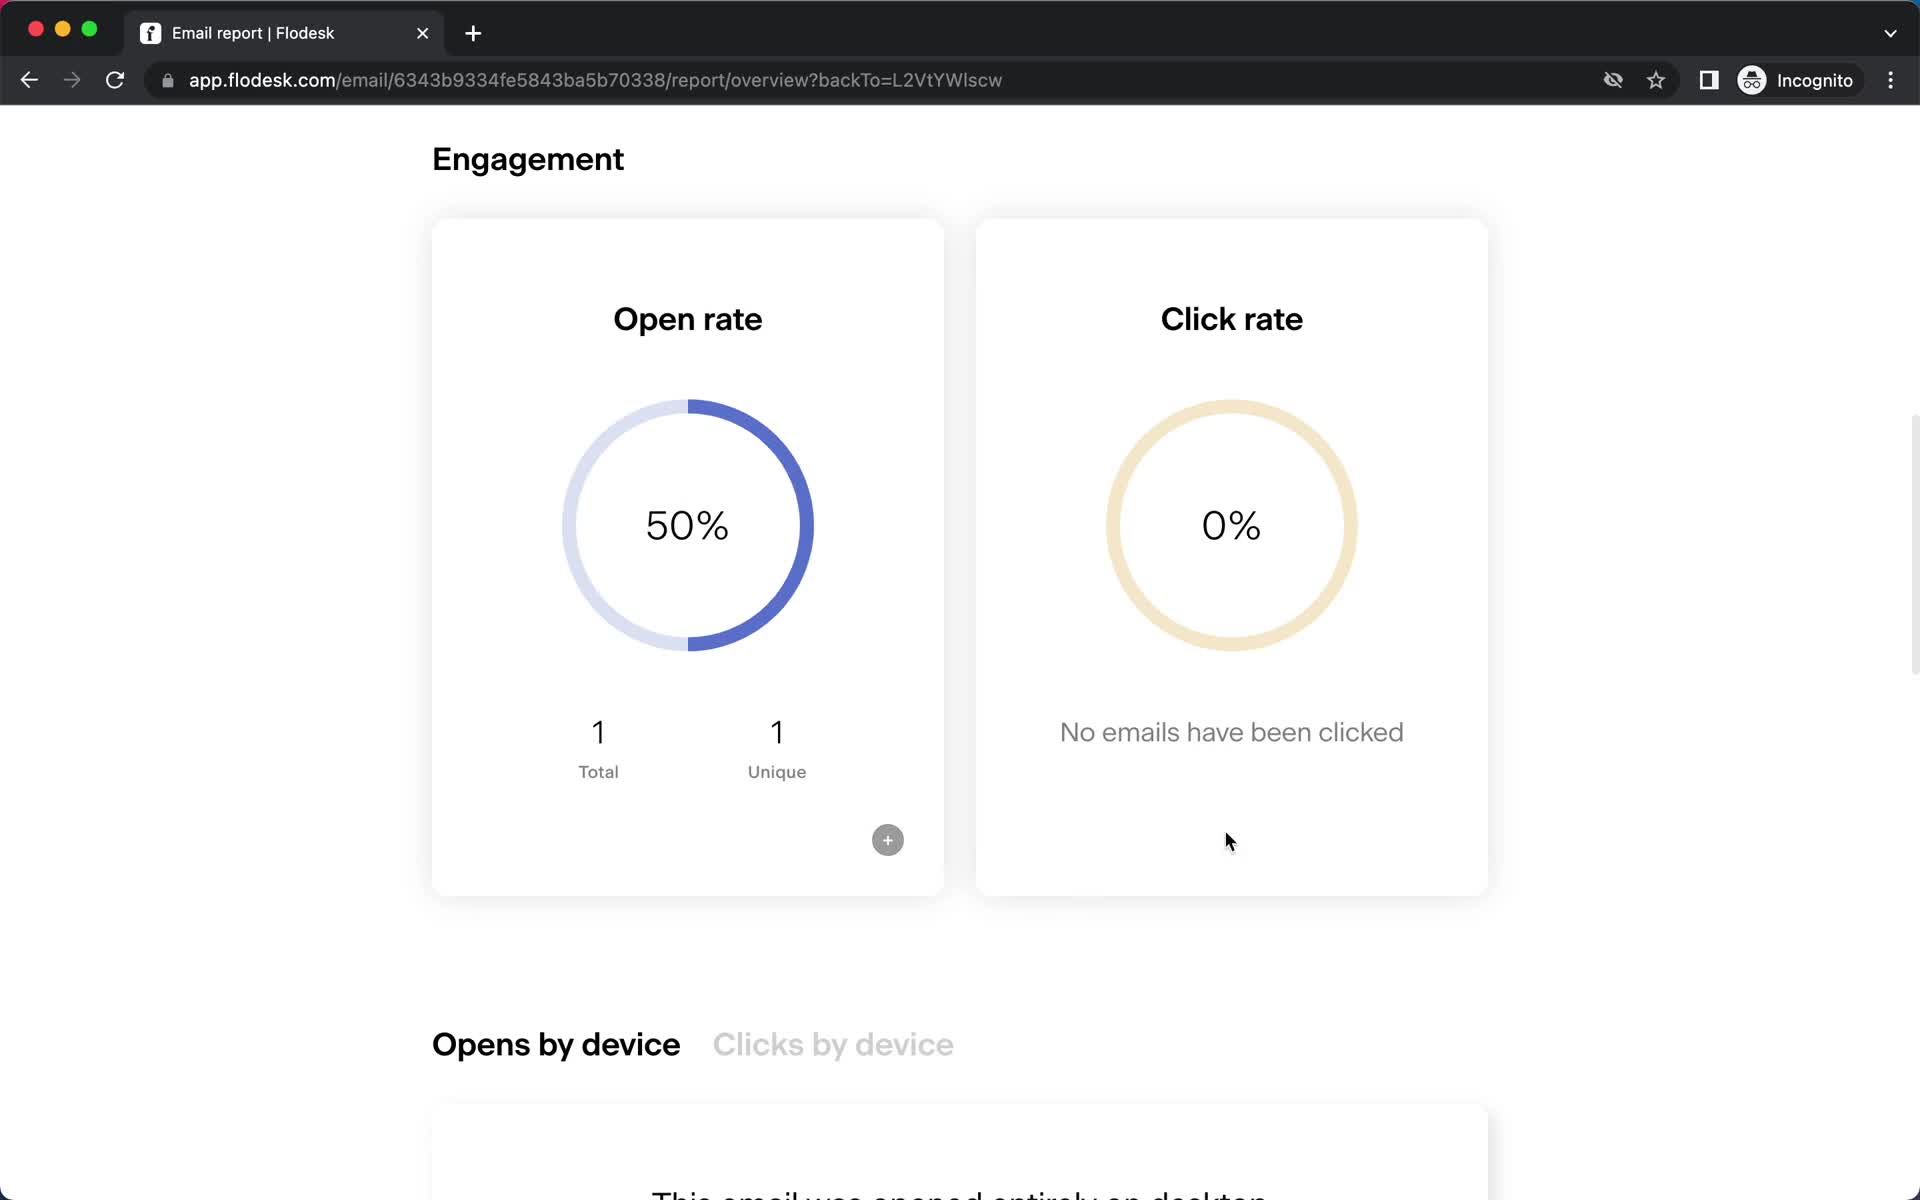
Analytics
this is title
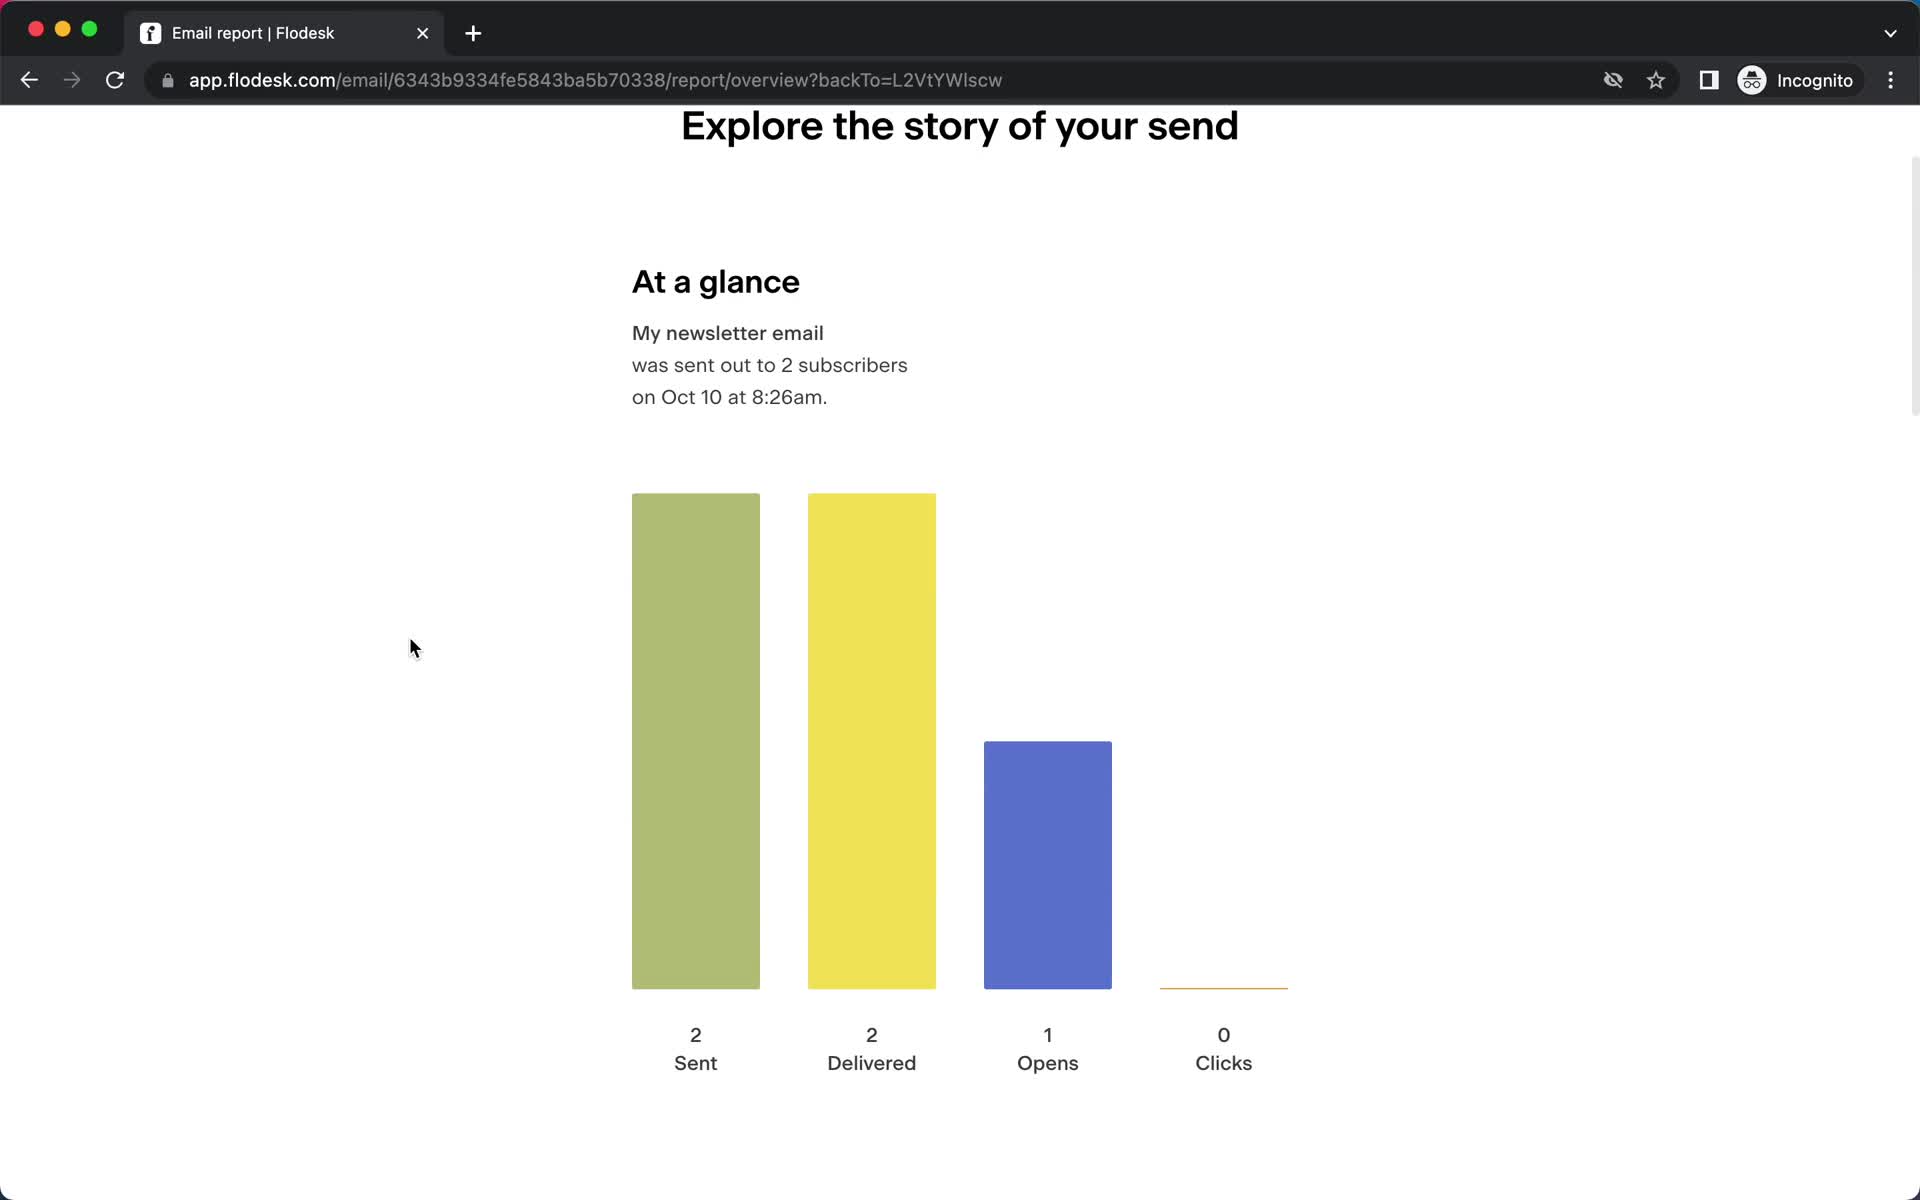
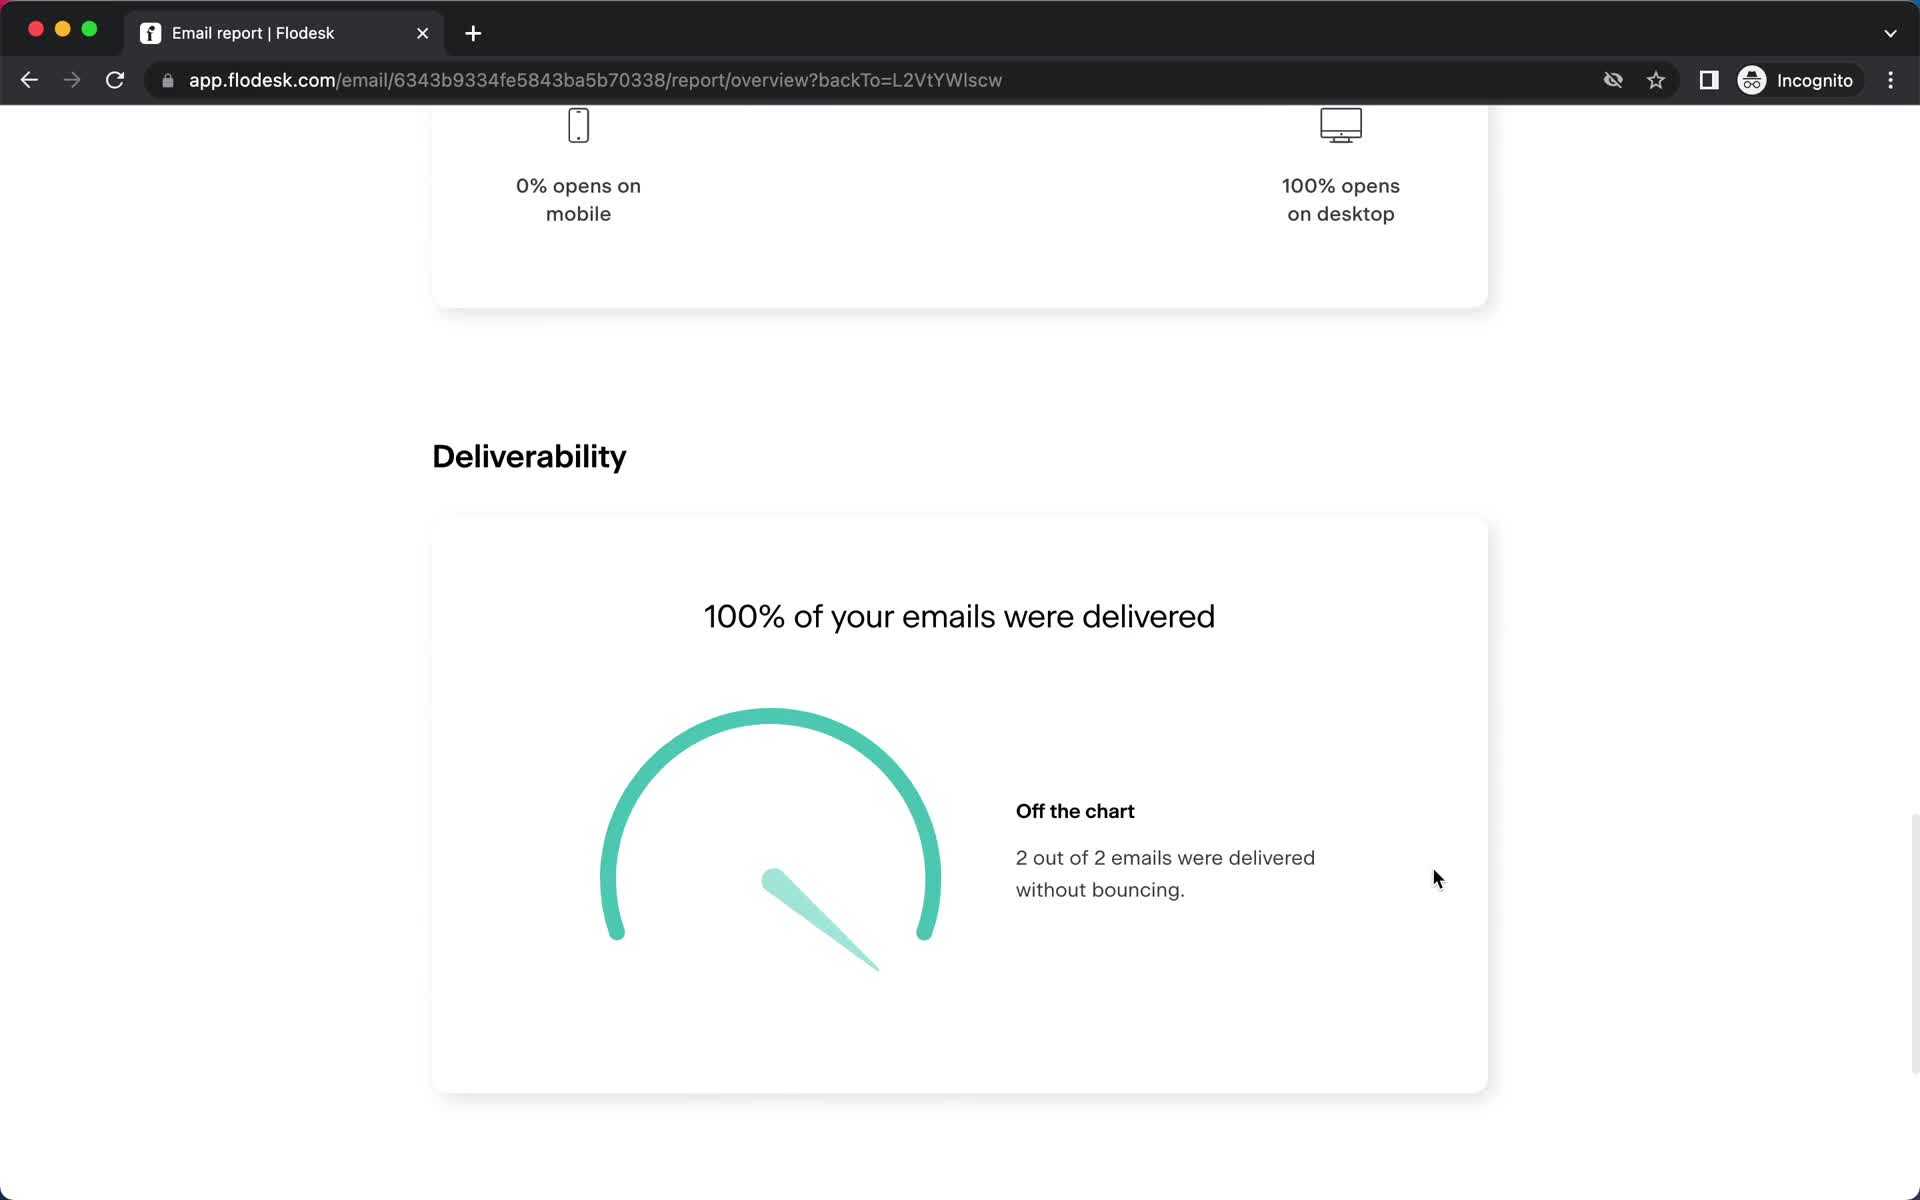
Analytics
this is title
Analytics
this is title
Analytics
this is title
Email campaigns
this is title
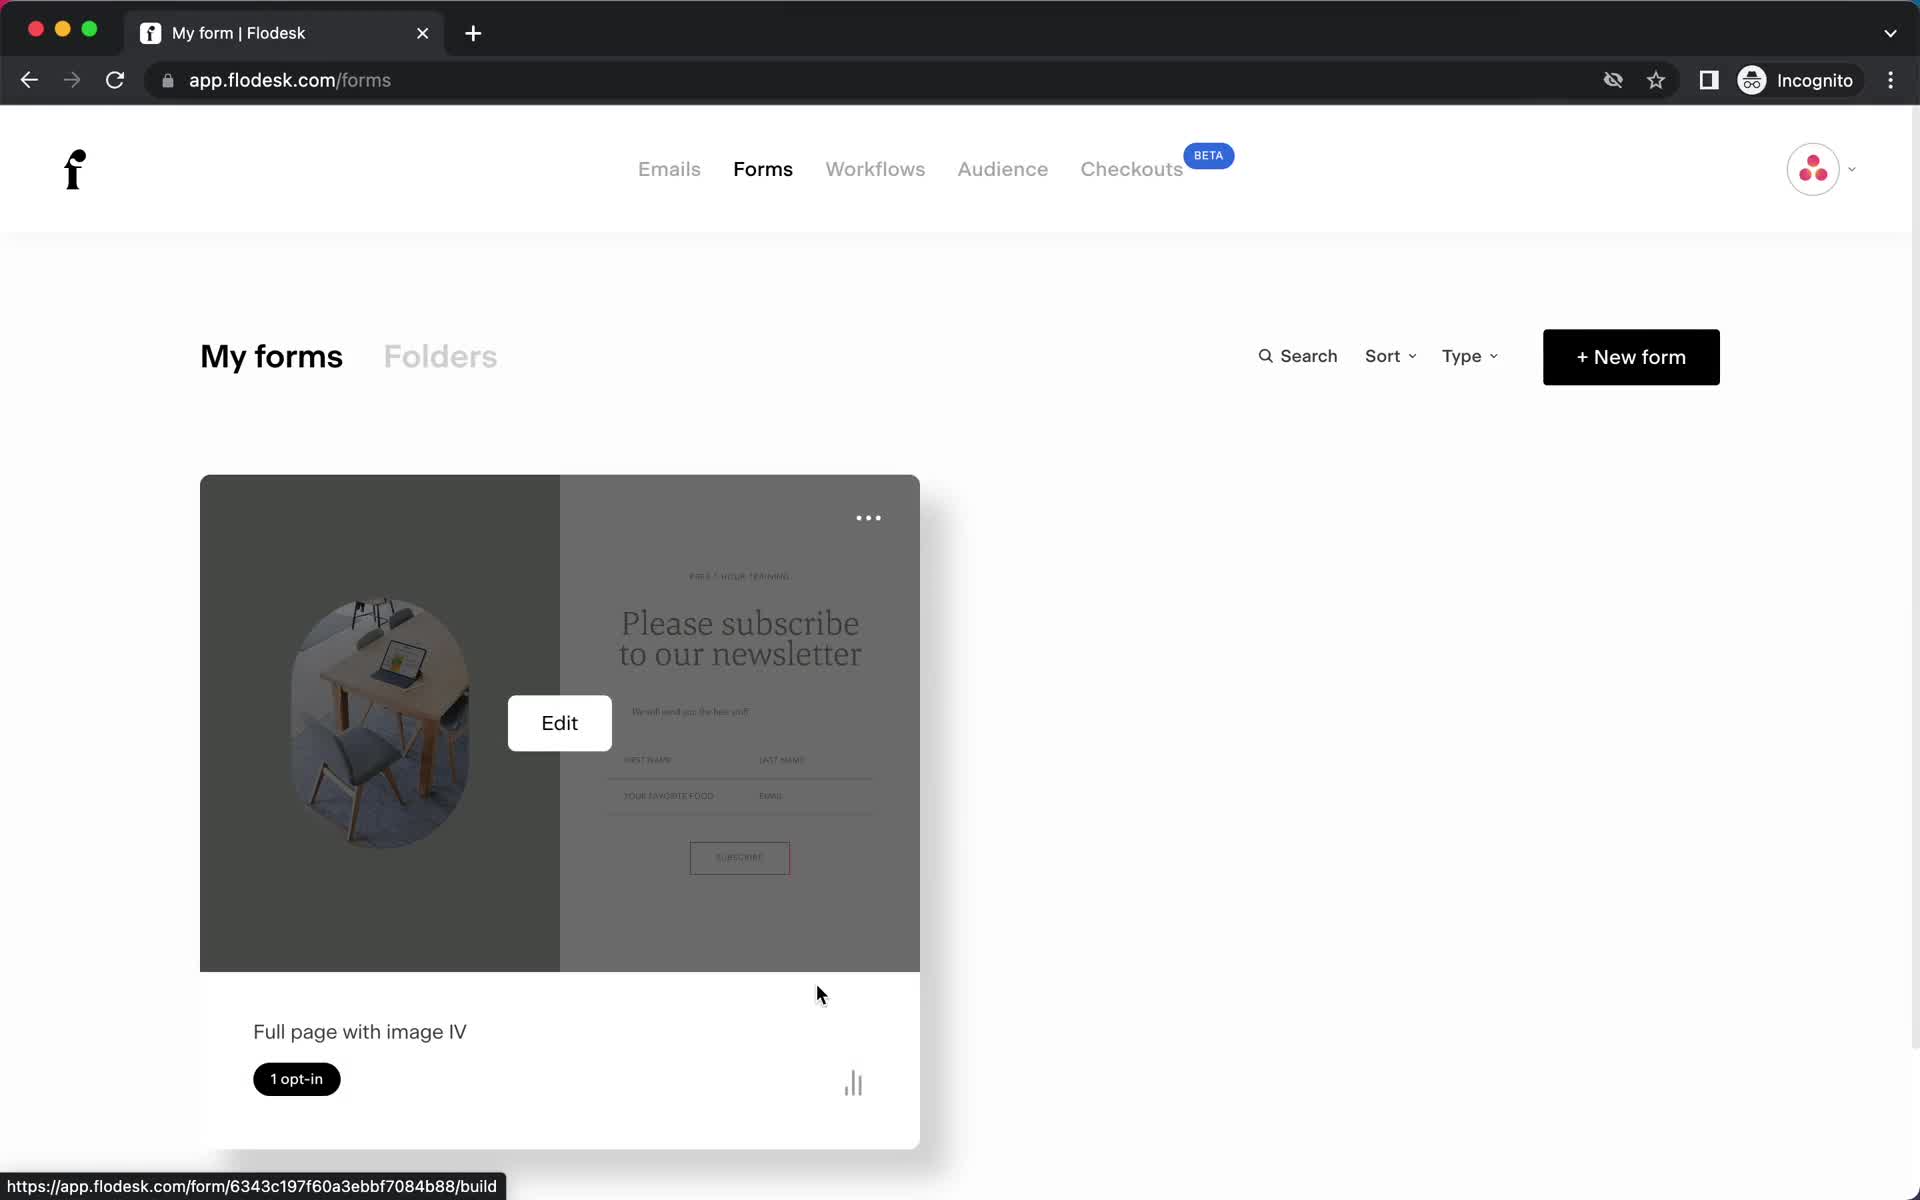
Forms
this is title
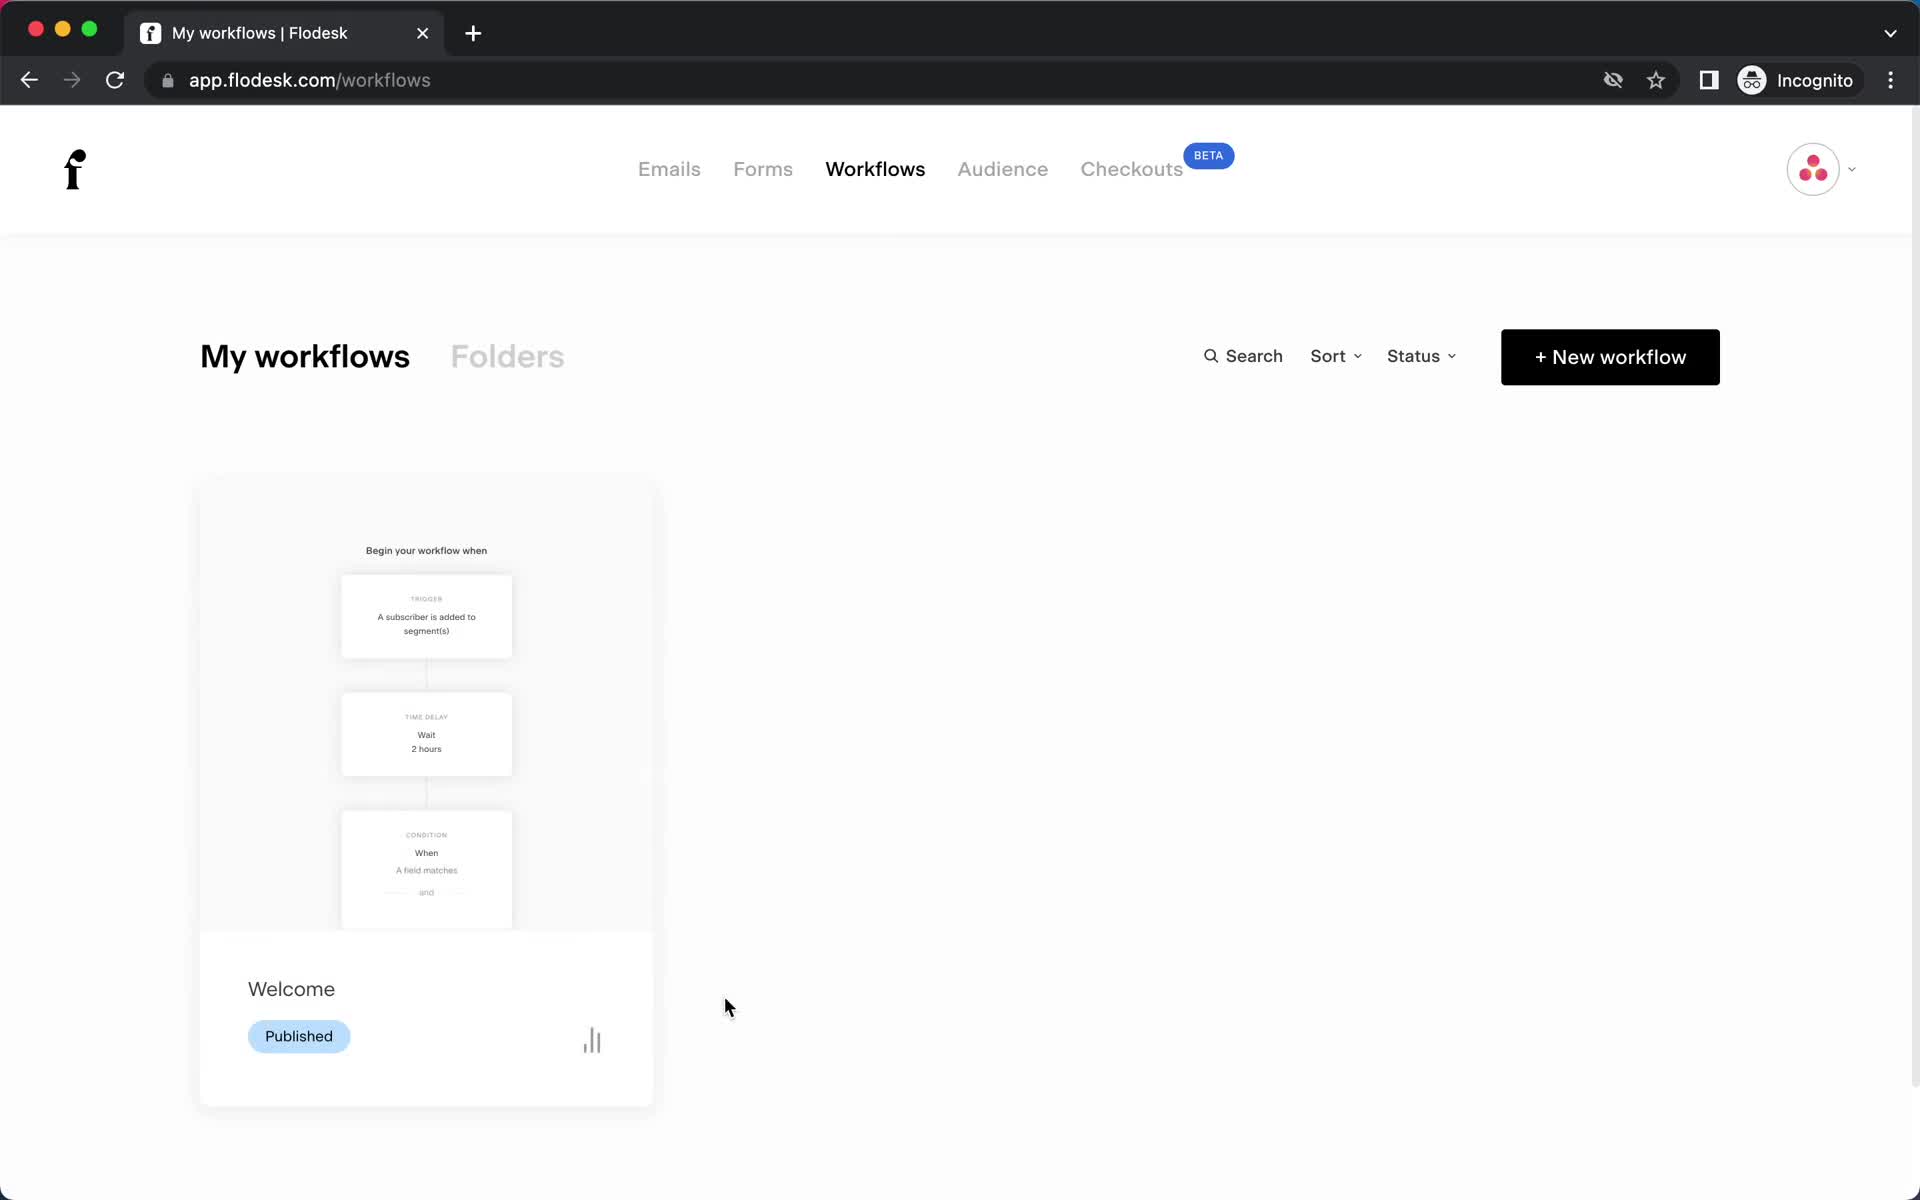
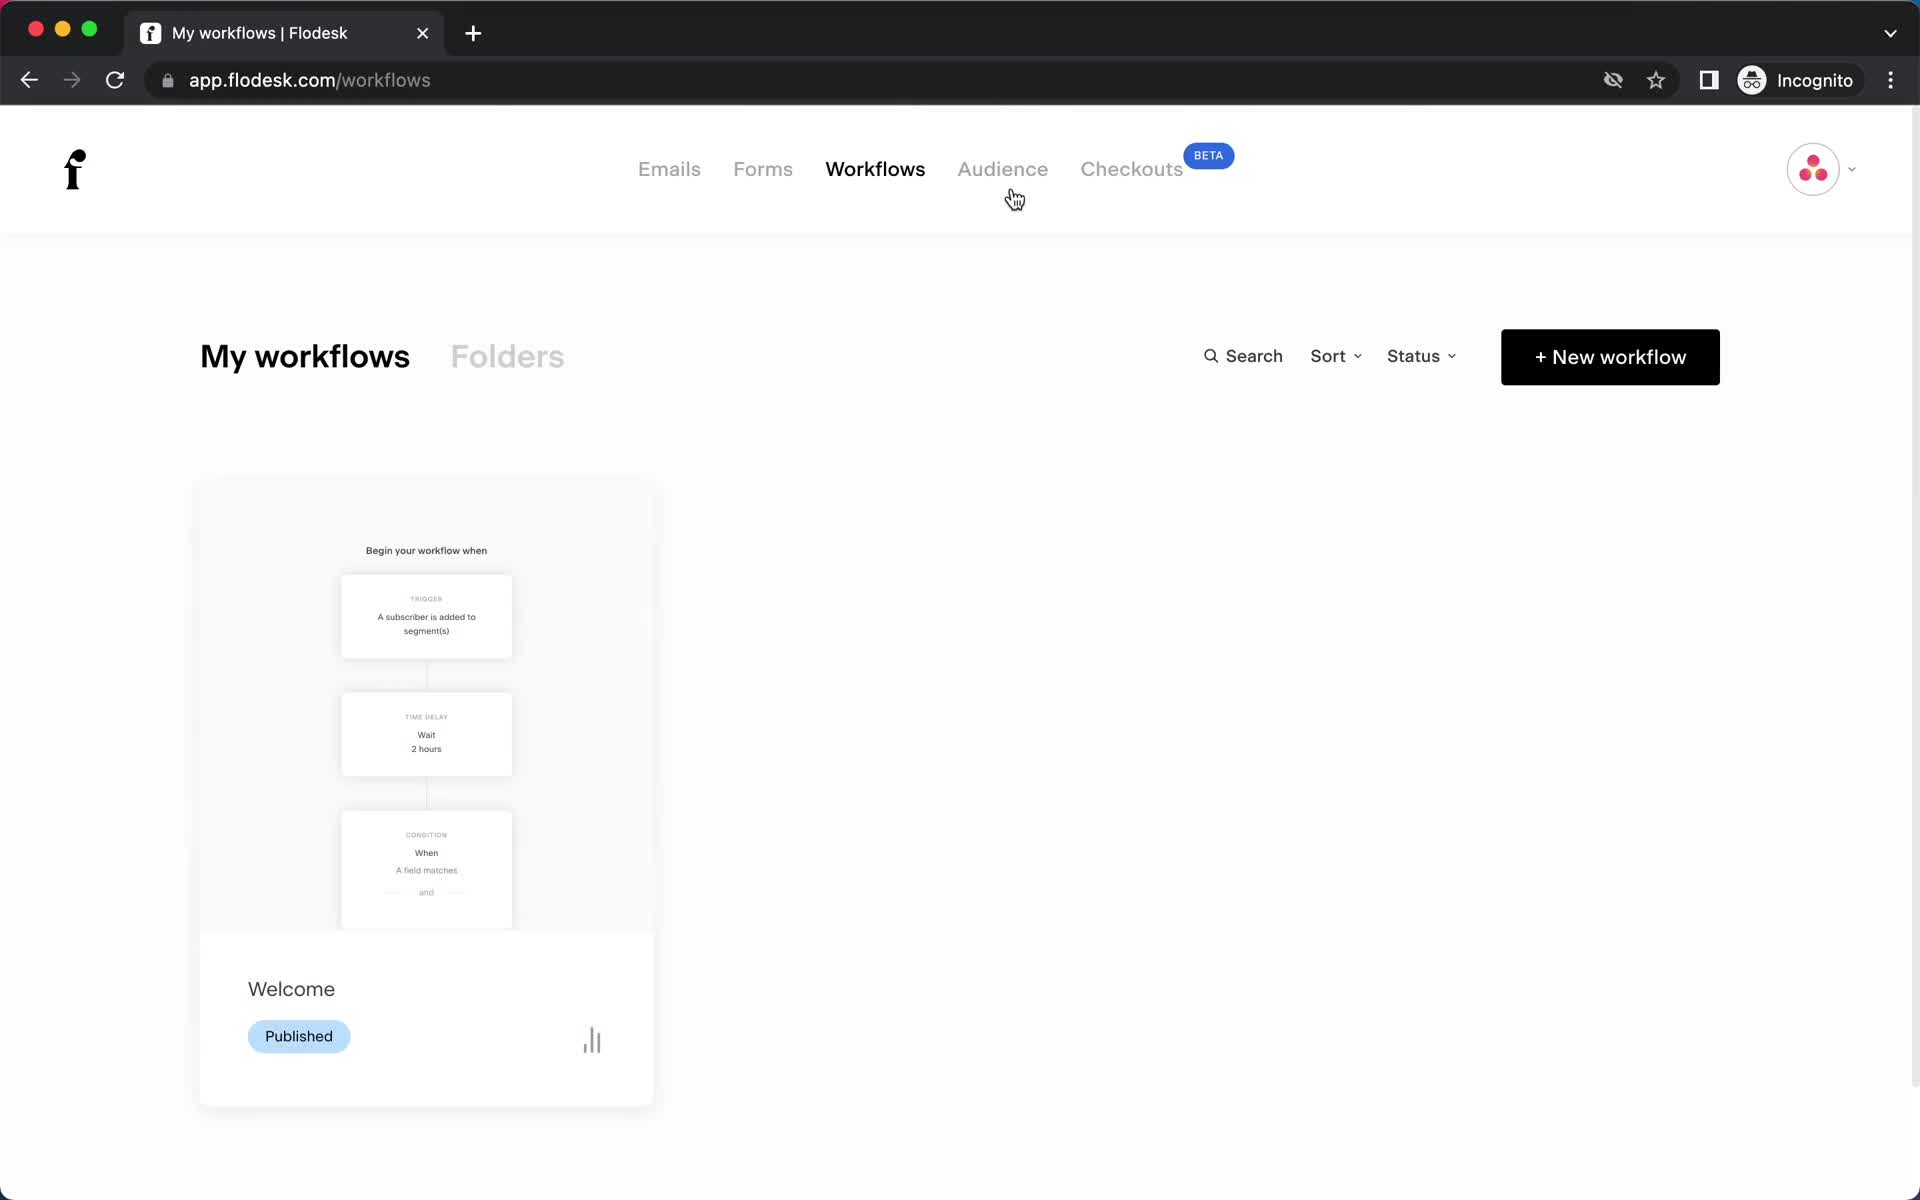
Workflows
this is title
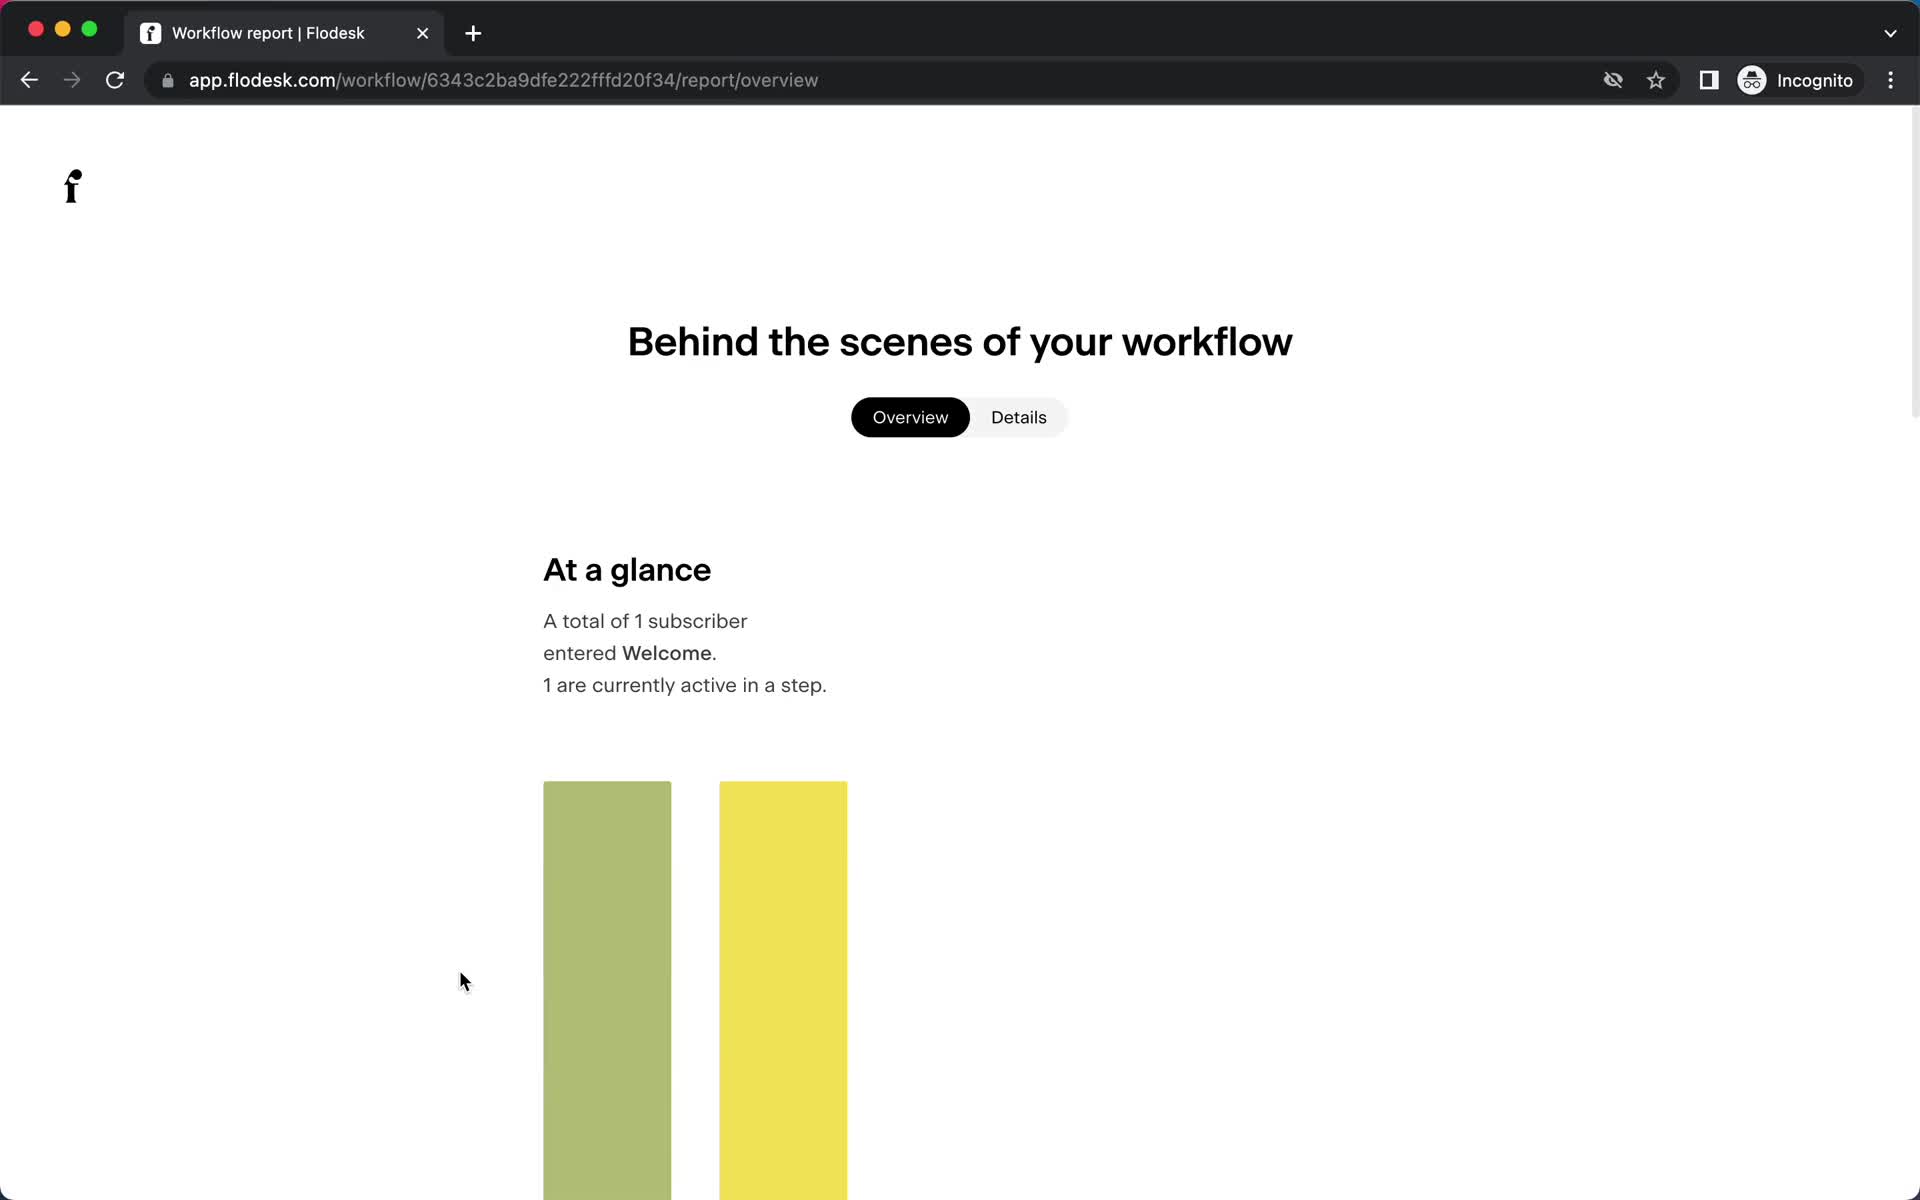
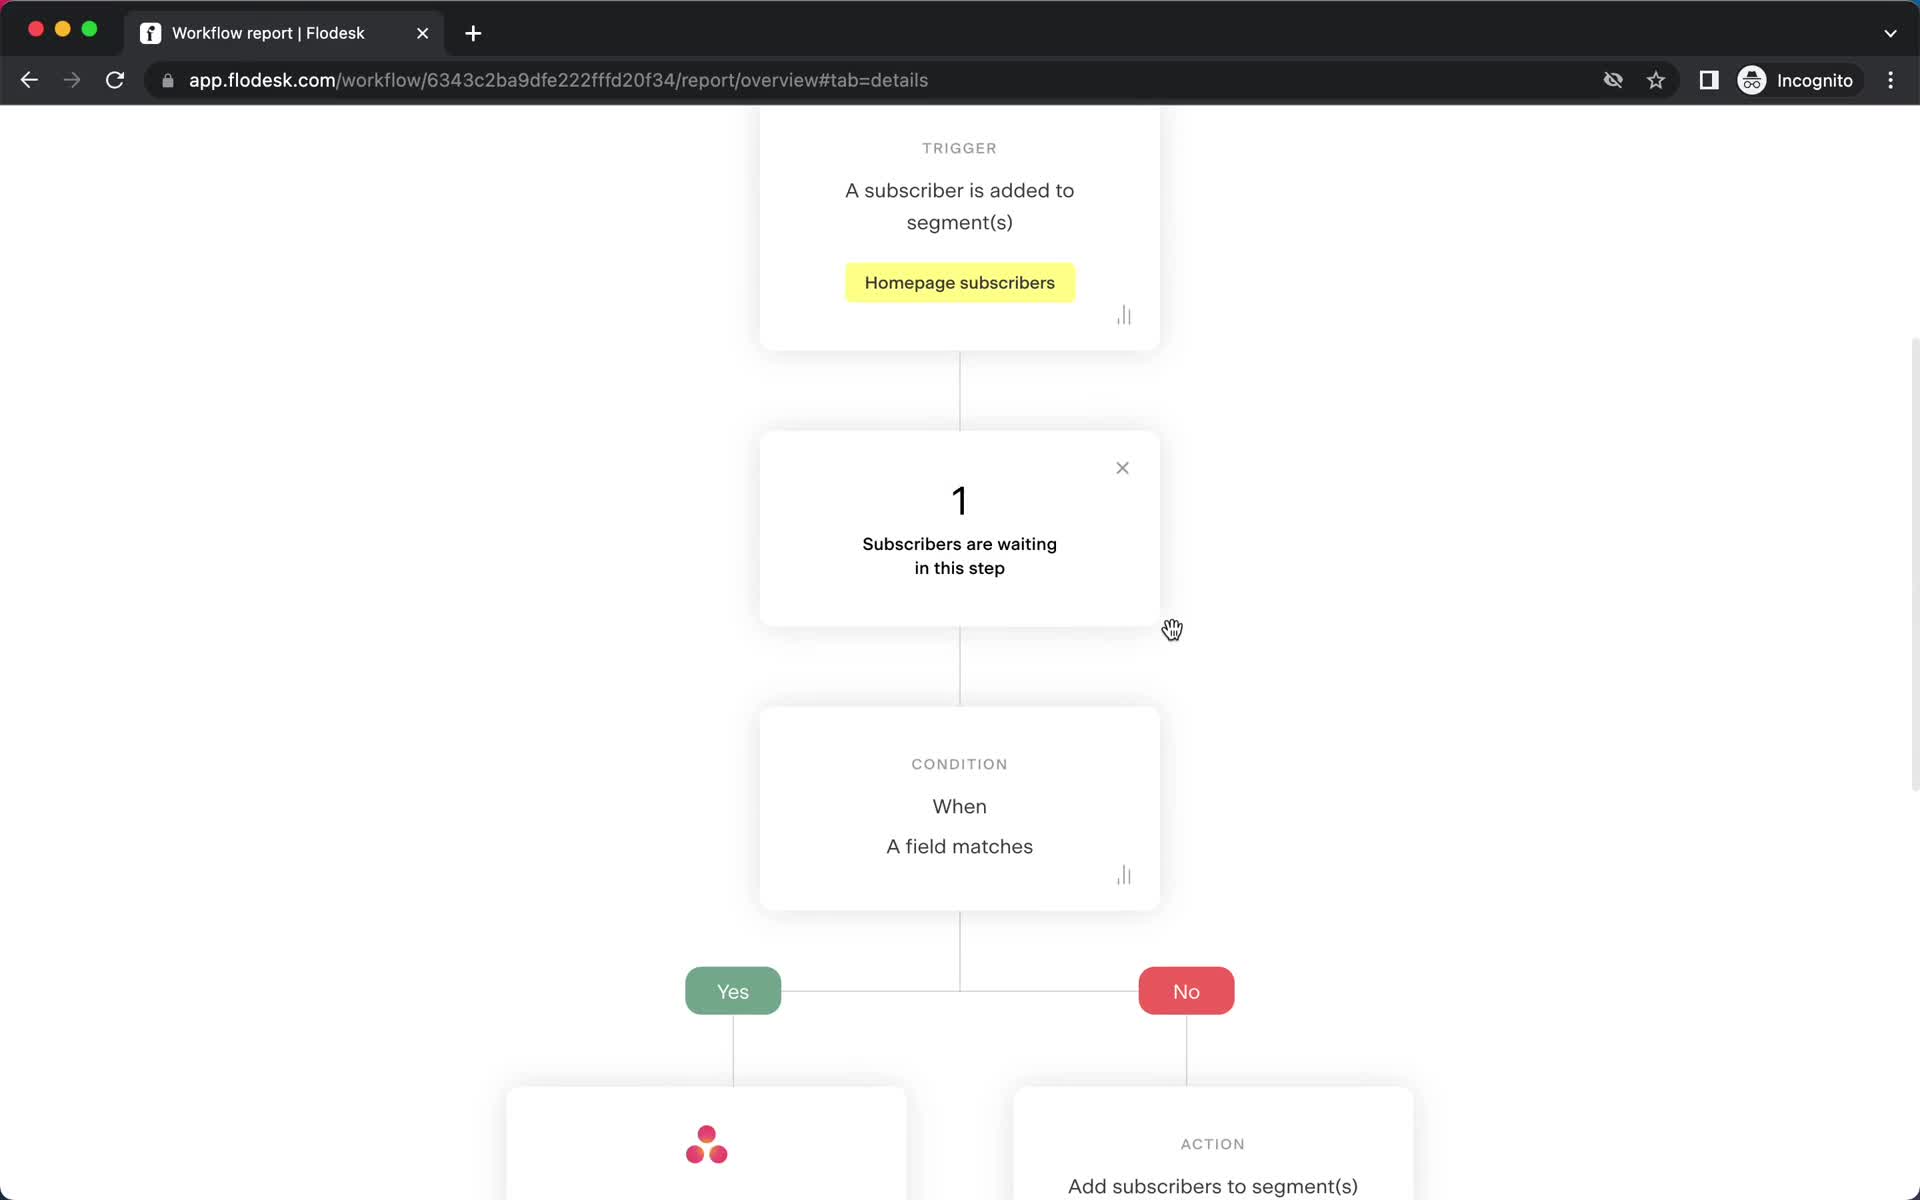
Analytics
this is title
Workflow analytics
this is title
Workflows
this is title
Email campaigns
this is title
Forms
this is title
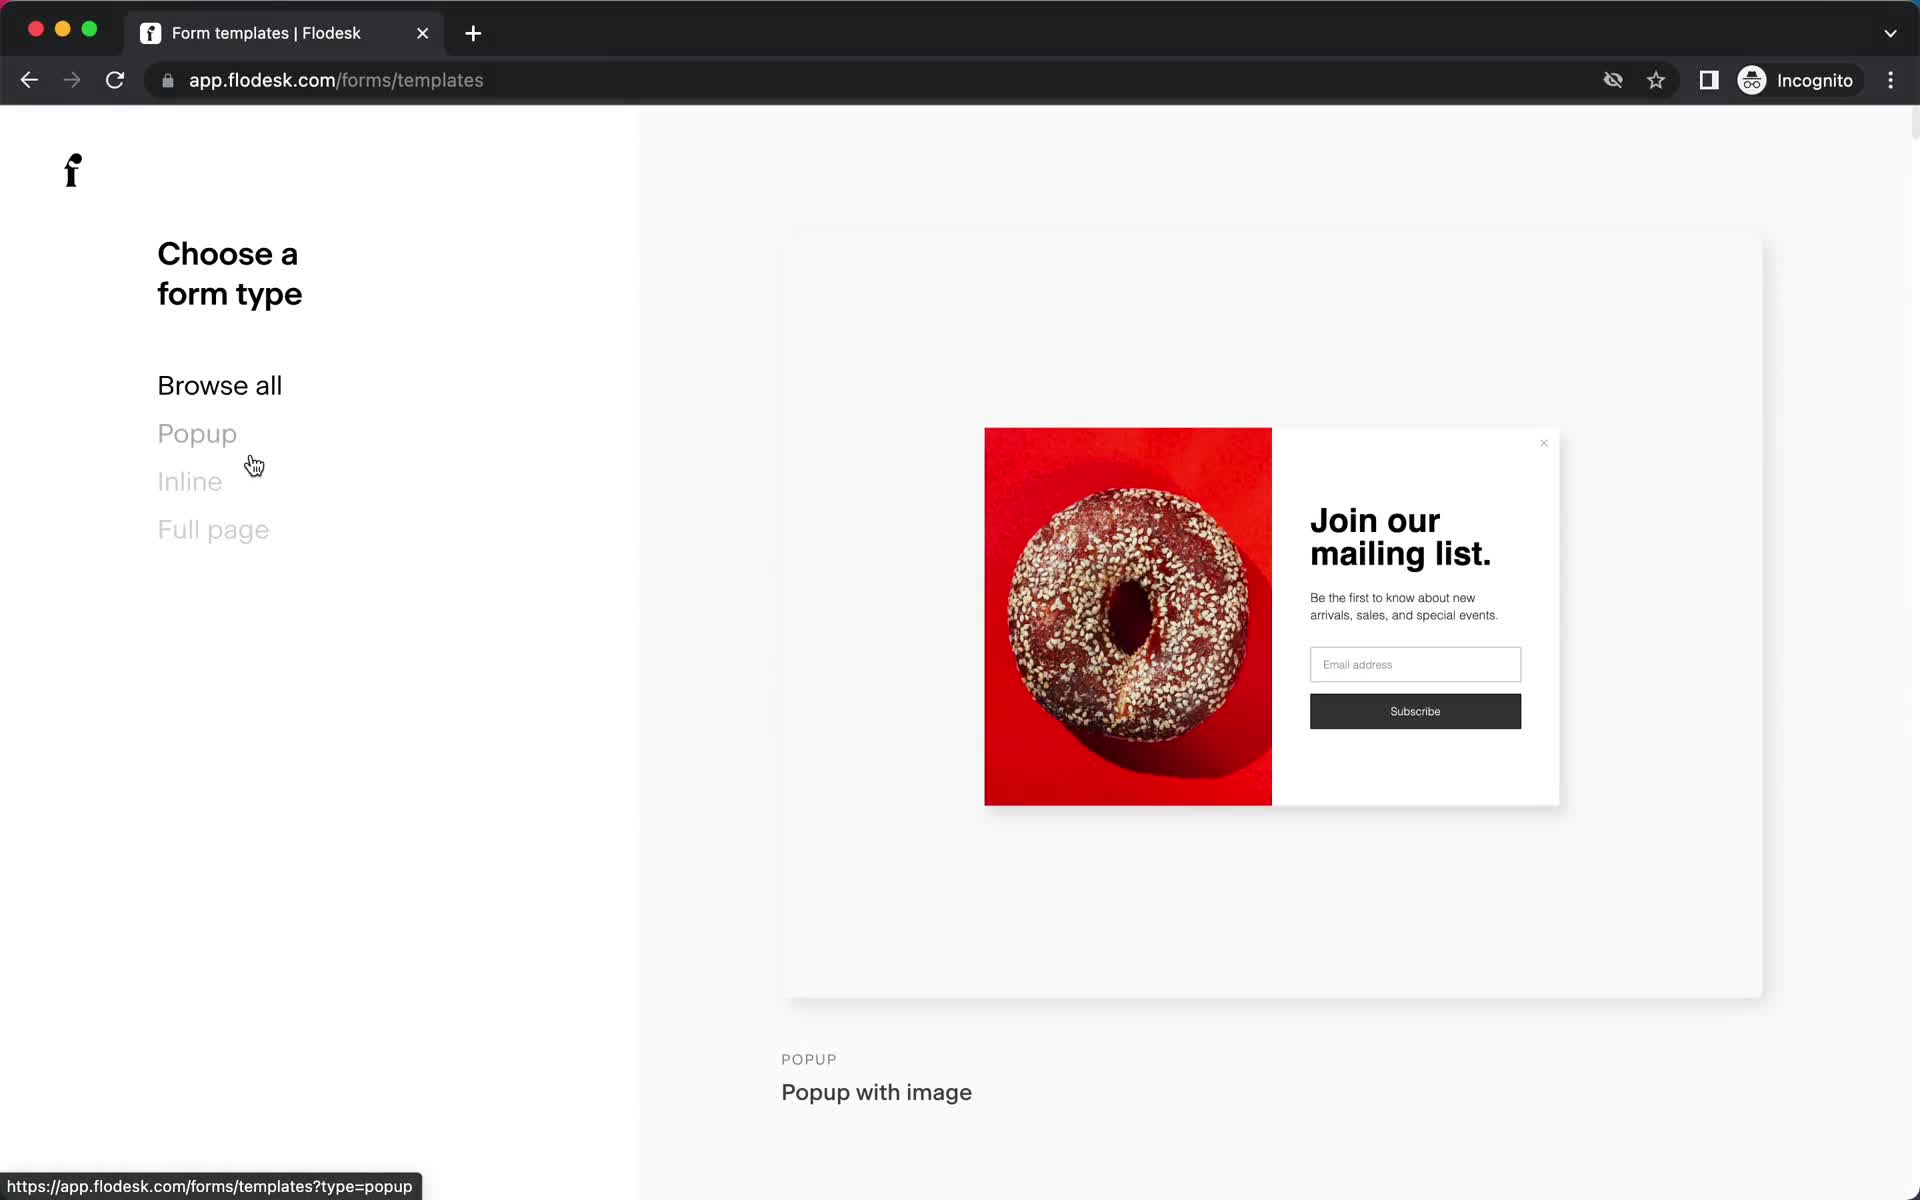
Select template
this is title
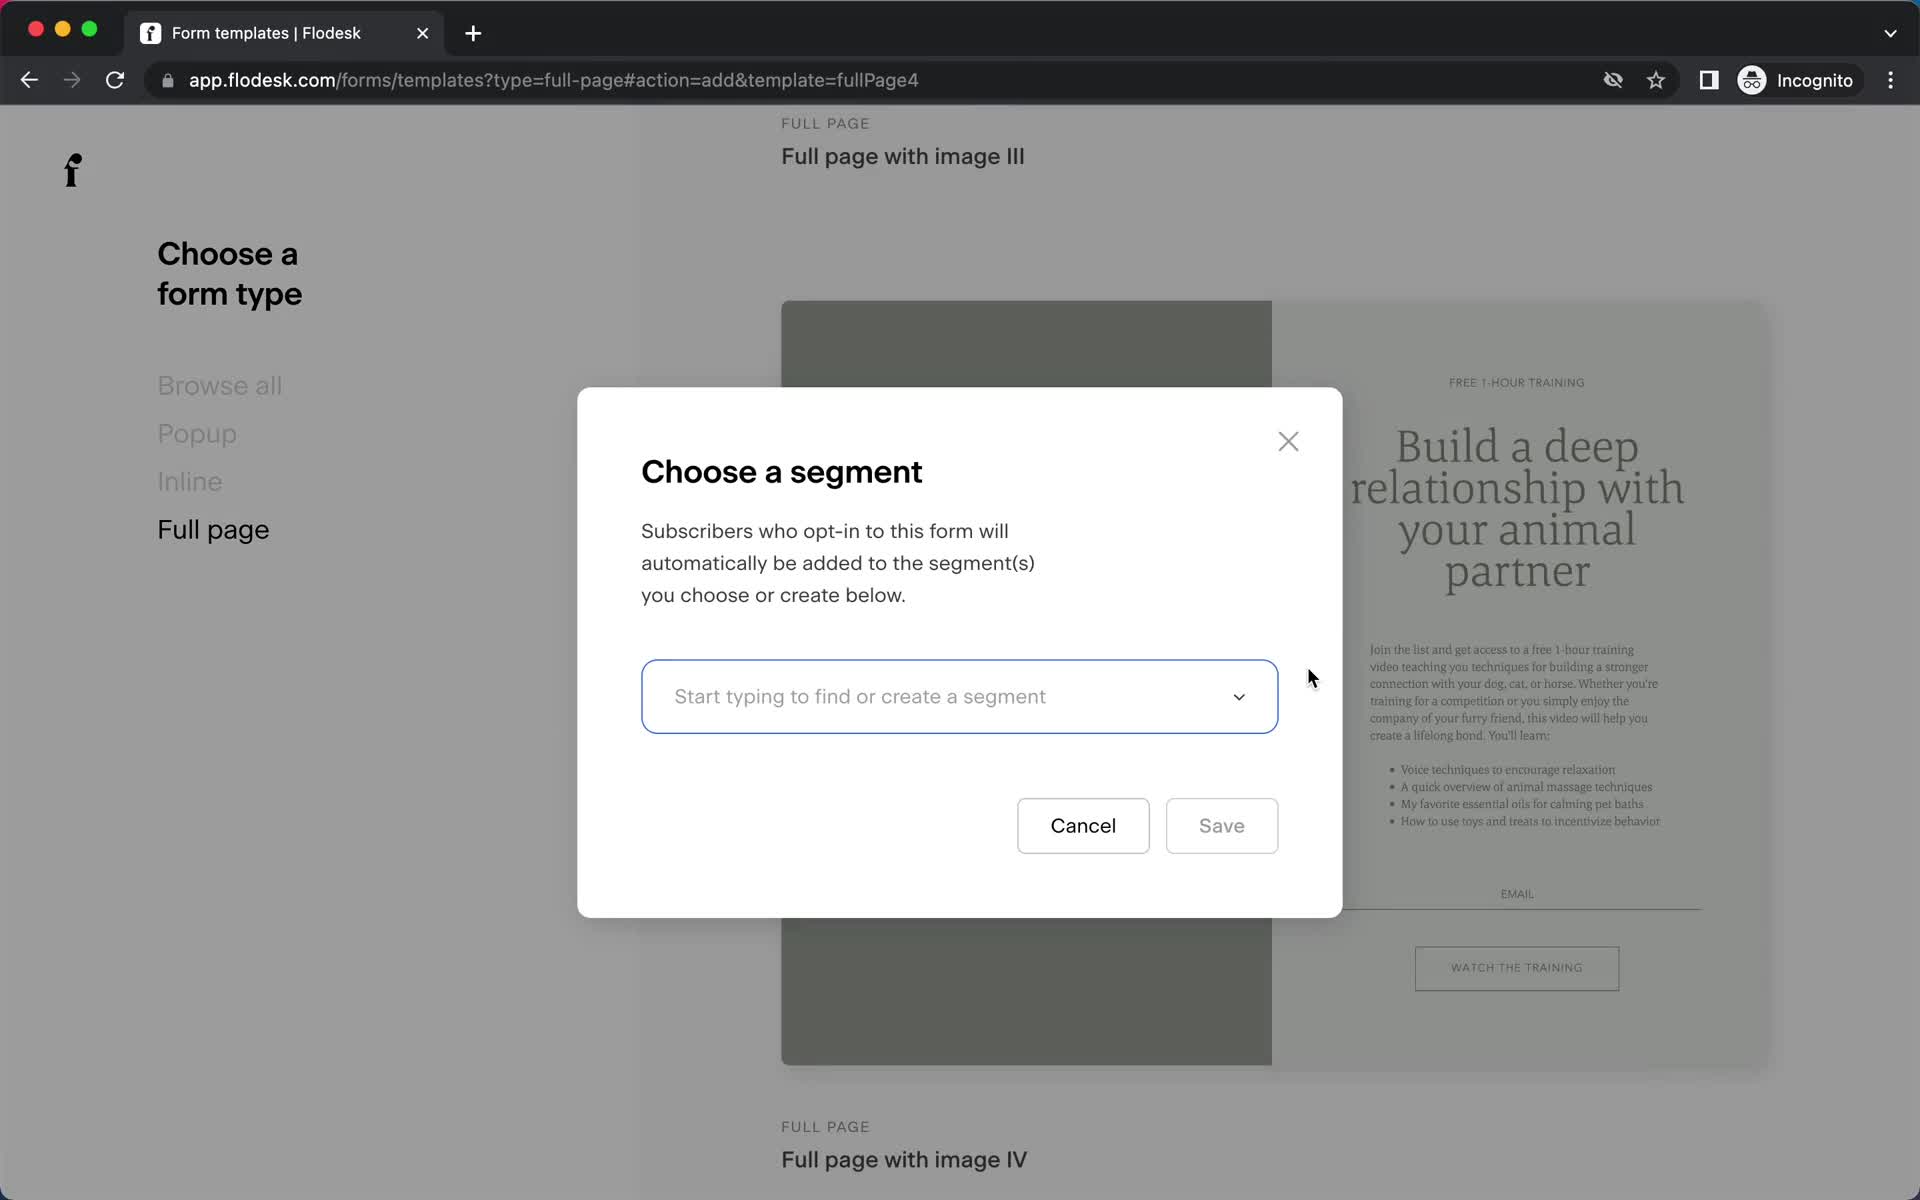
Select segments
this is title
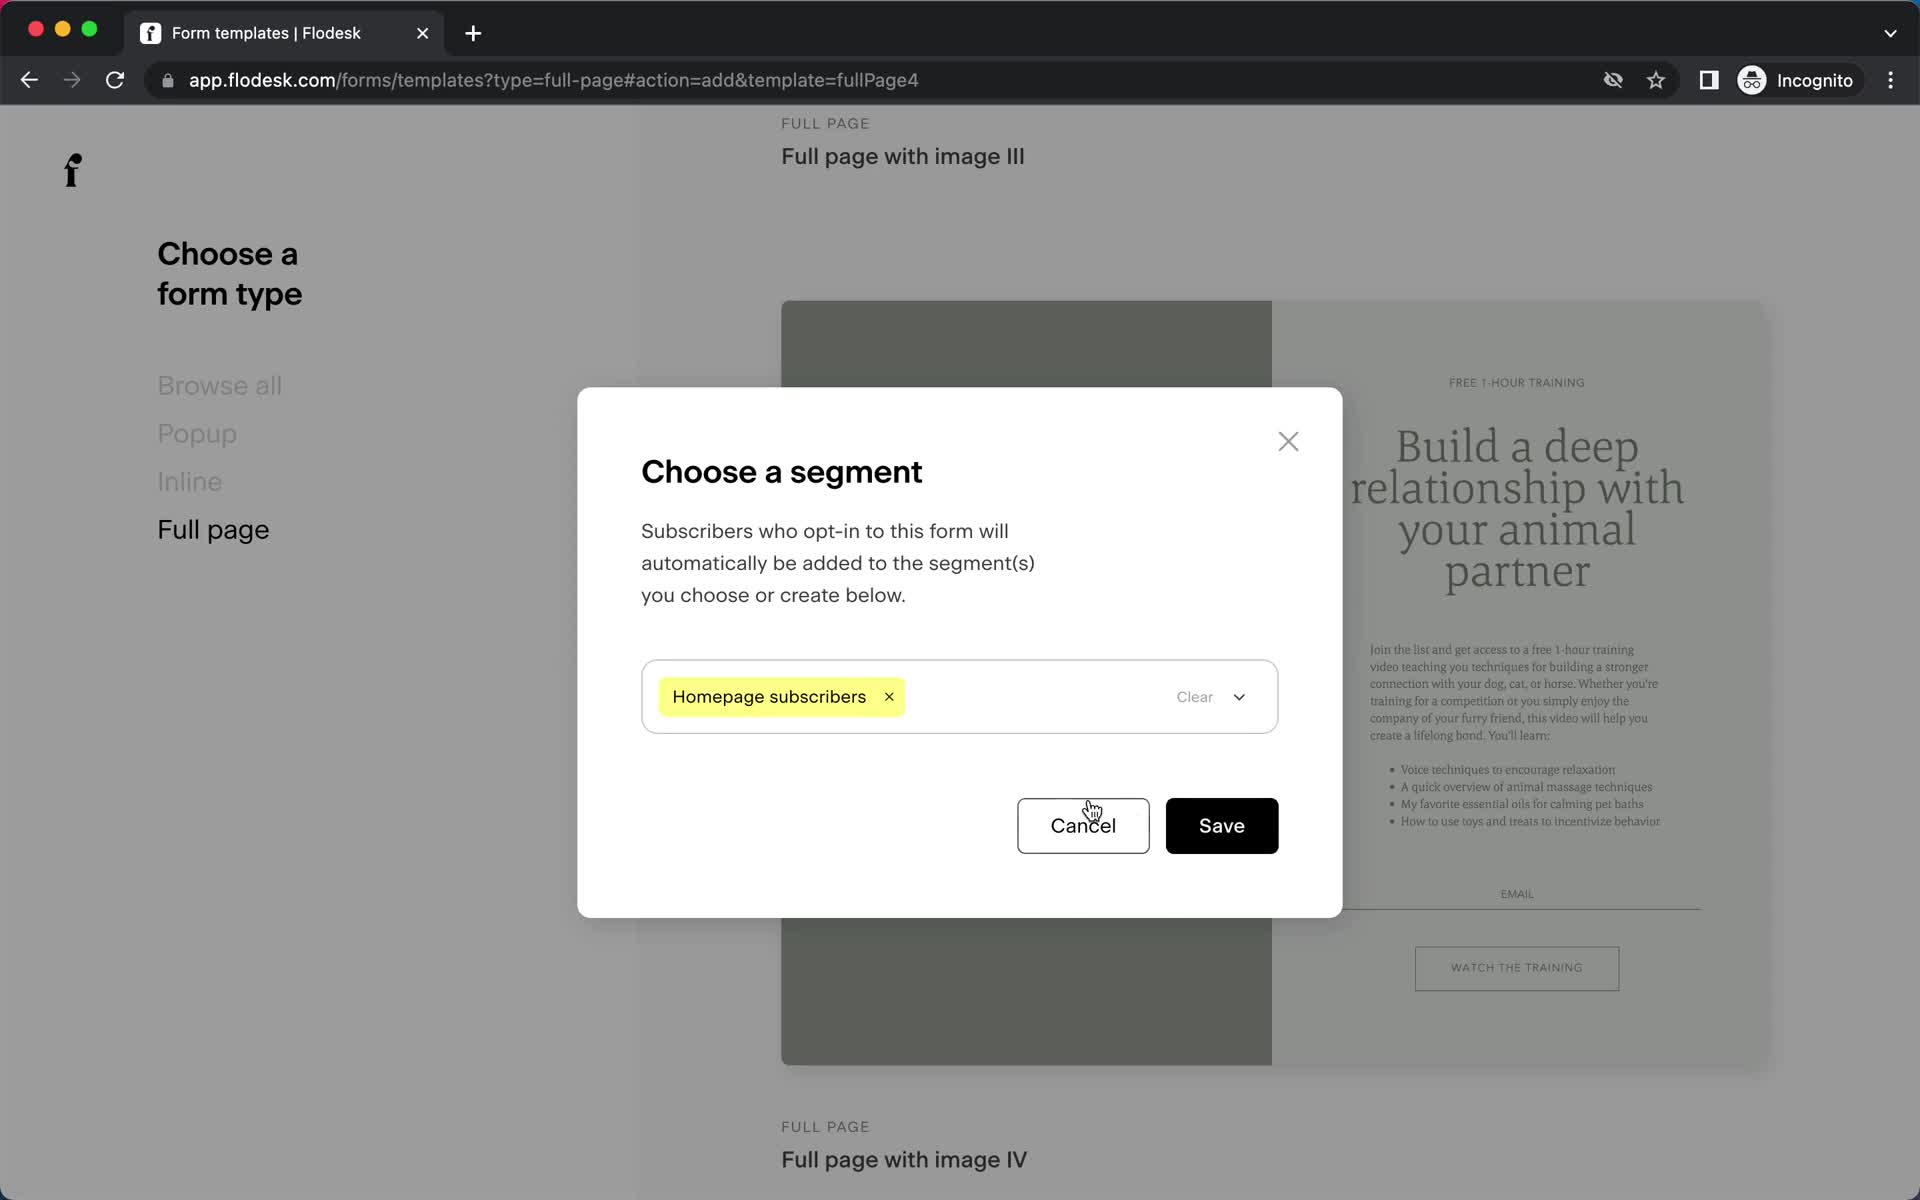
Select segments
this is title
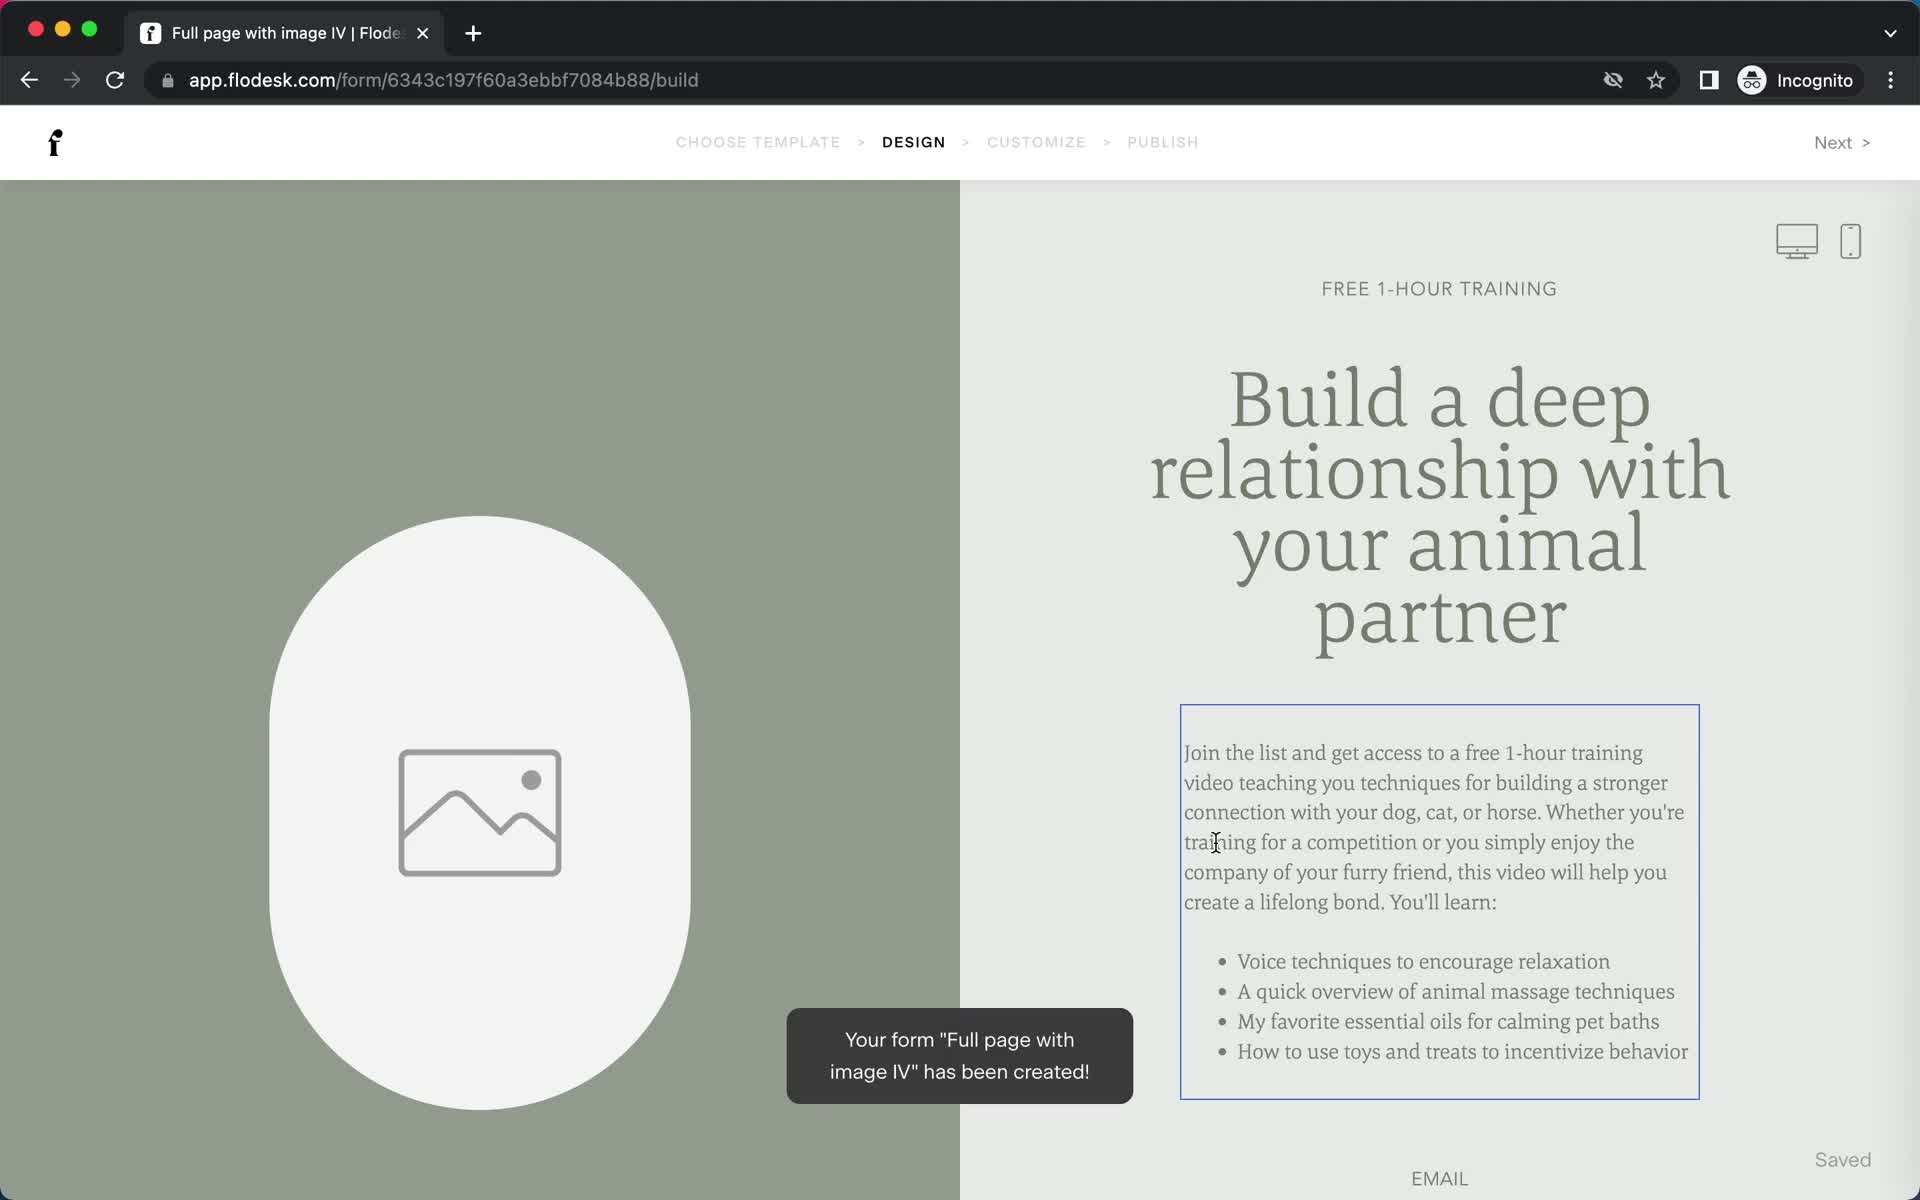
Editor
this is title
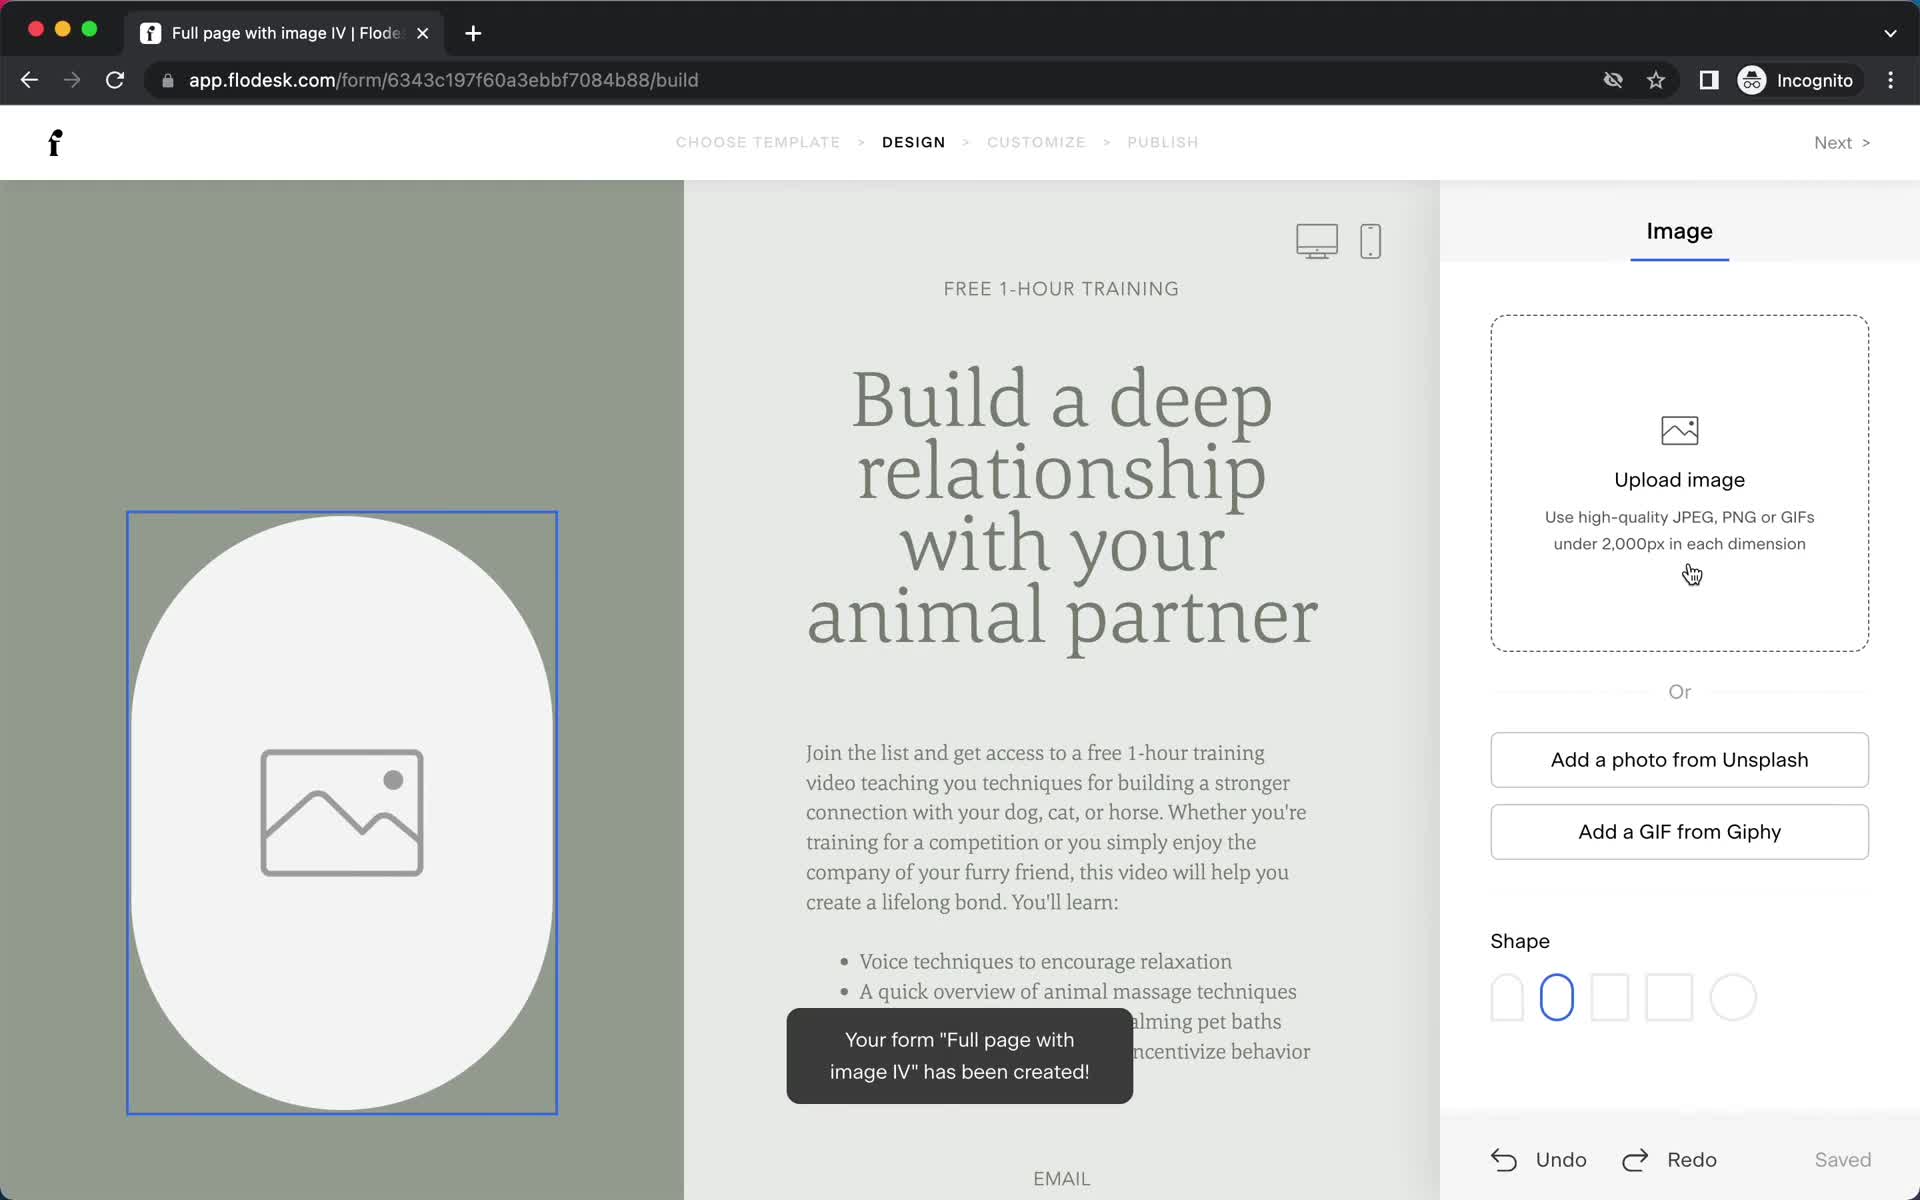
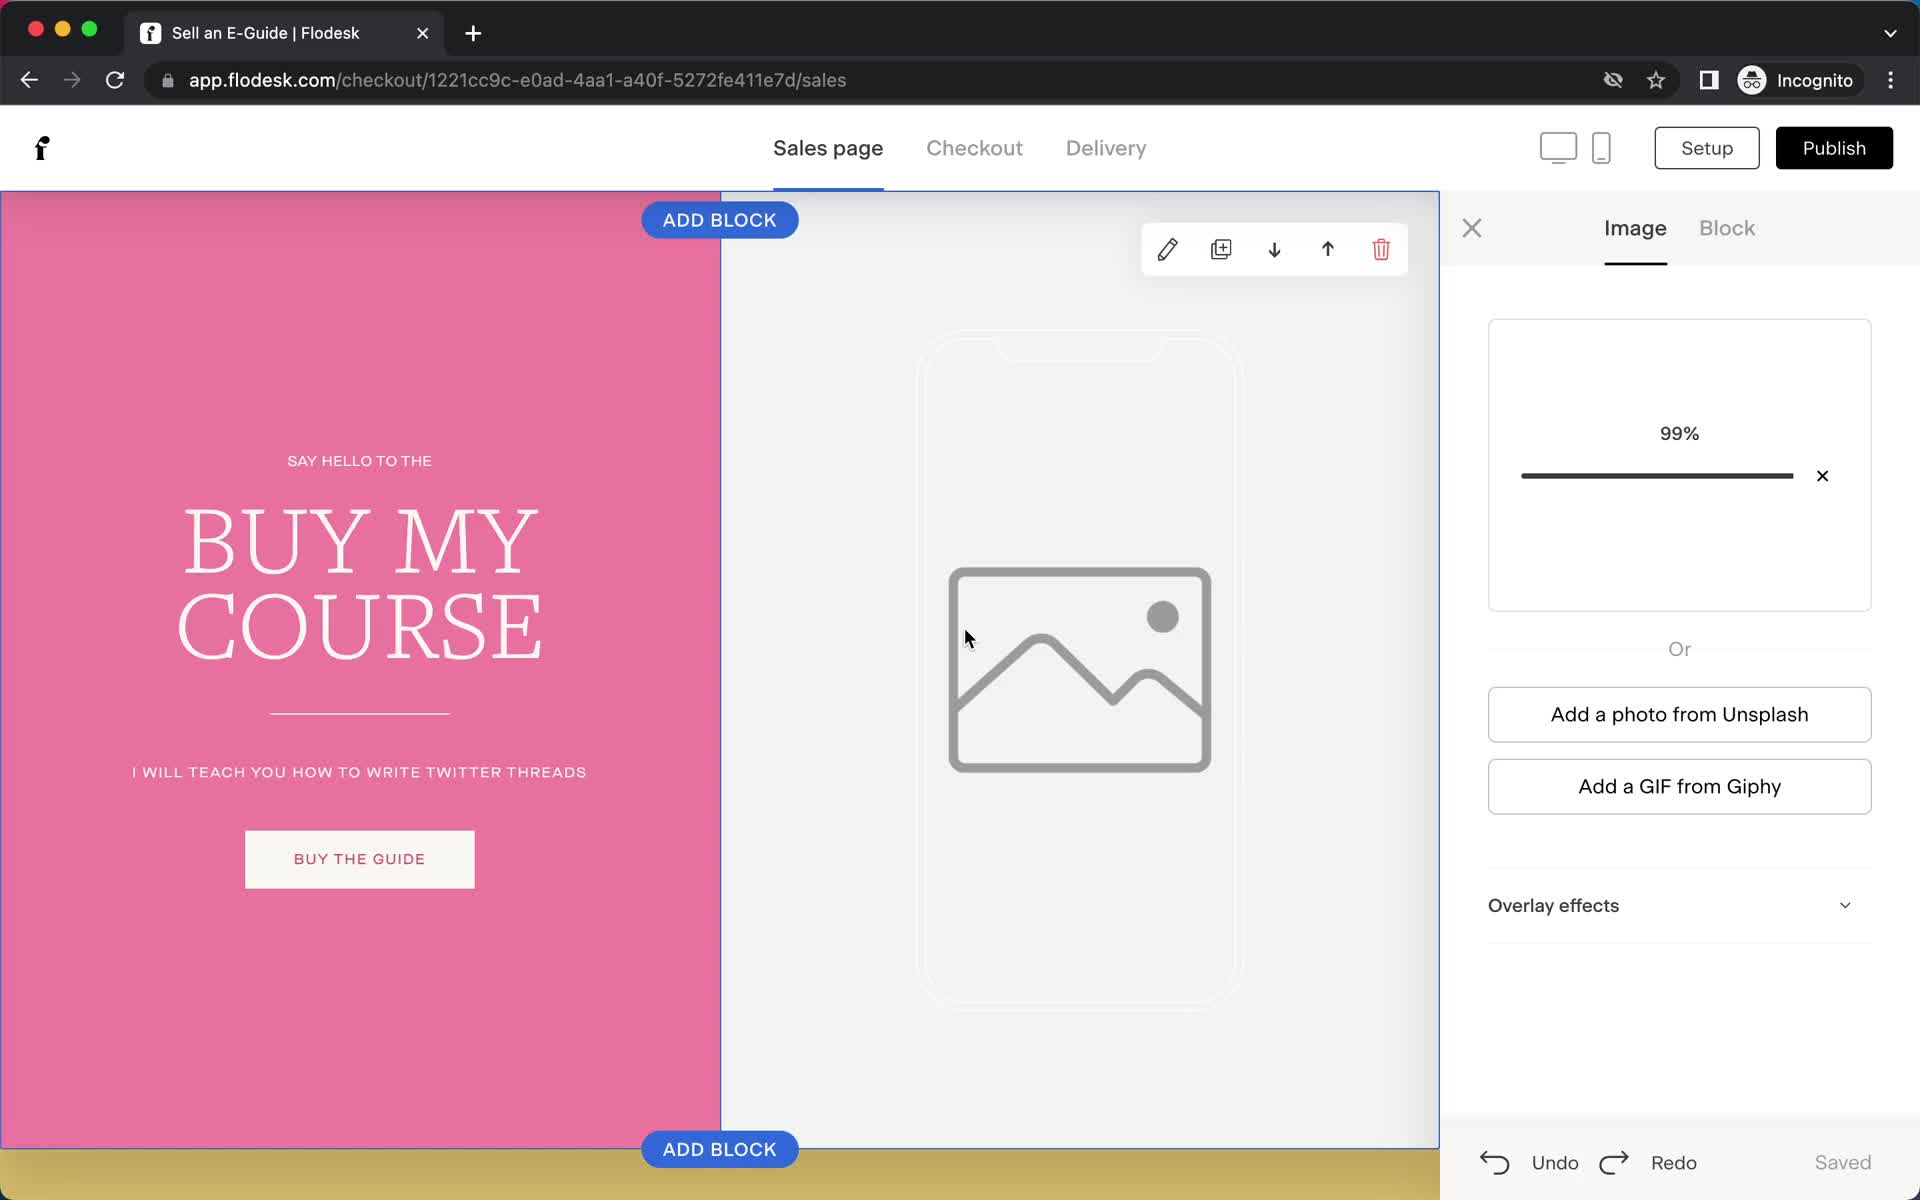
Upload image
this is title
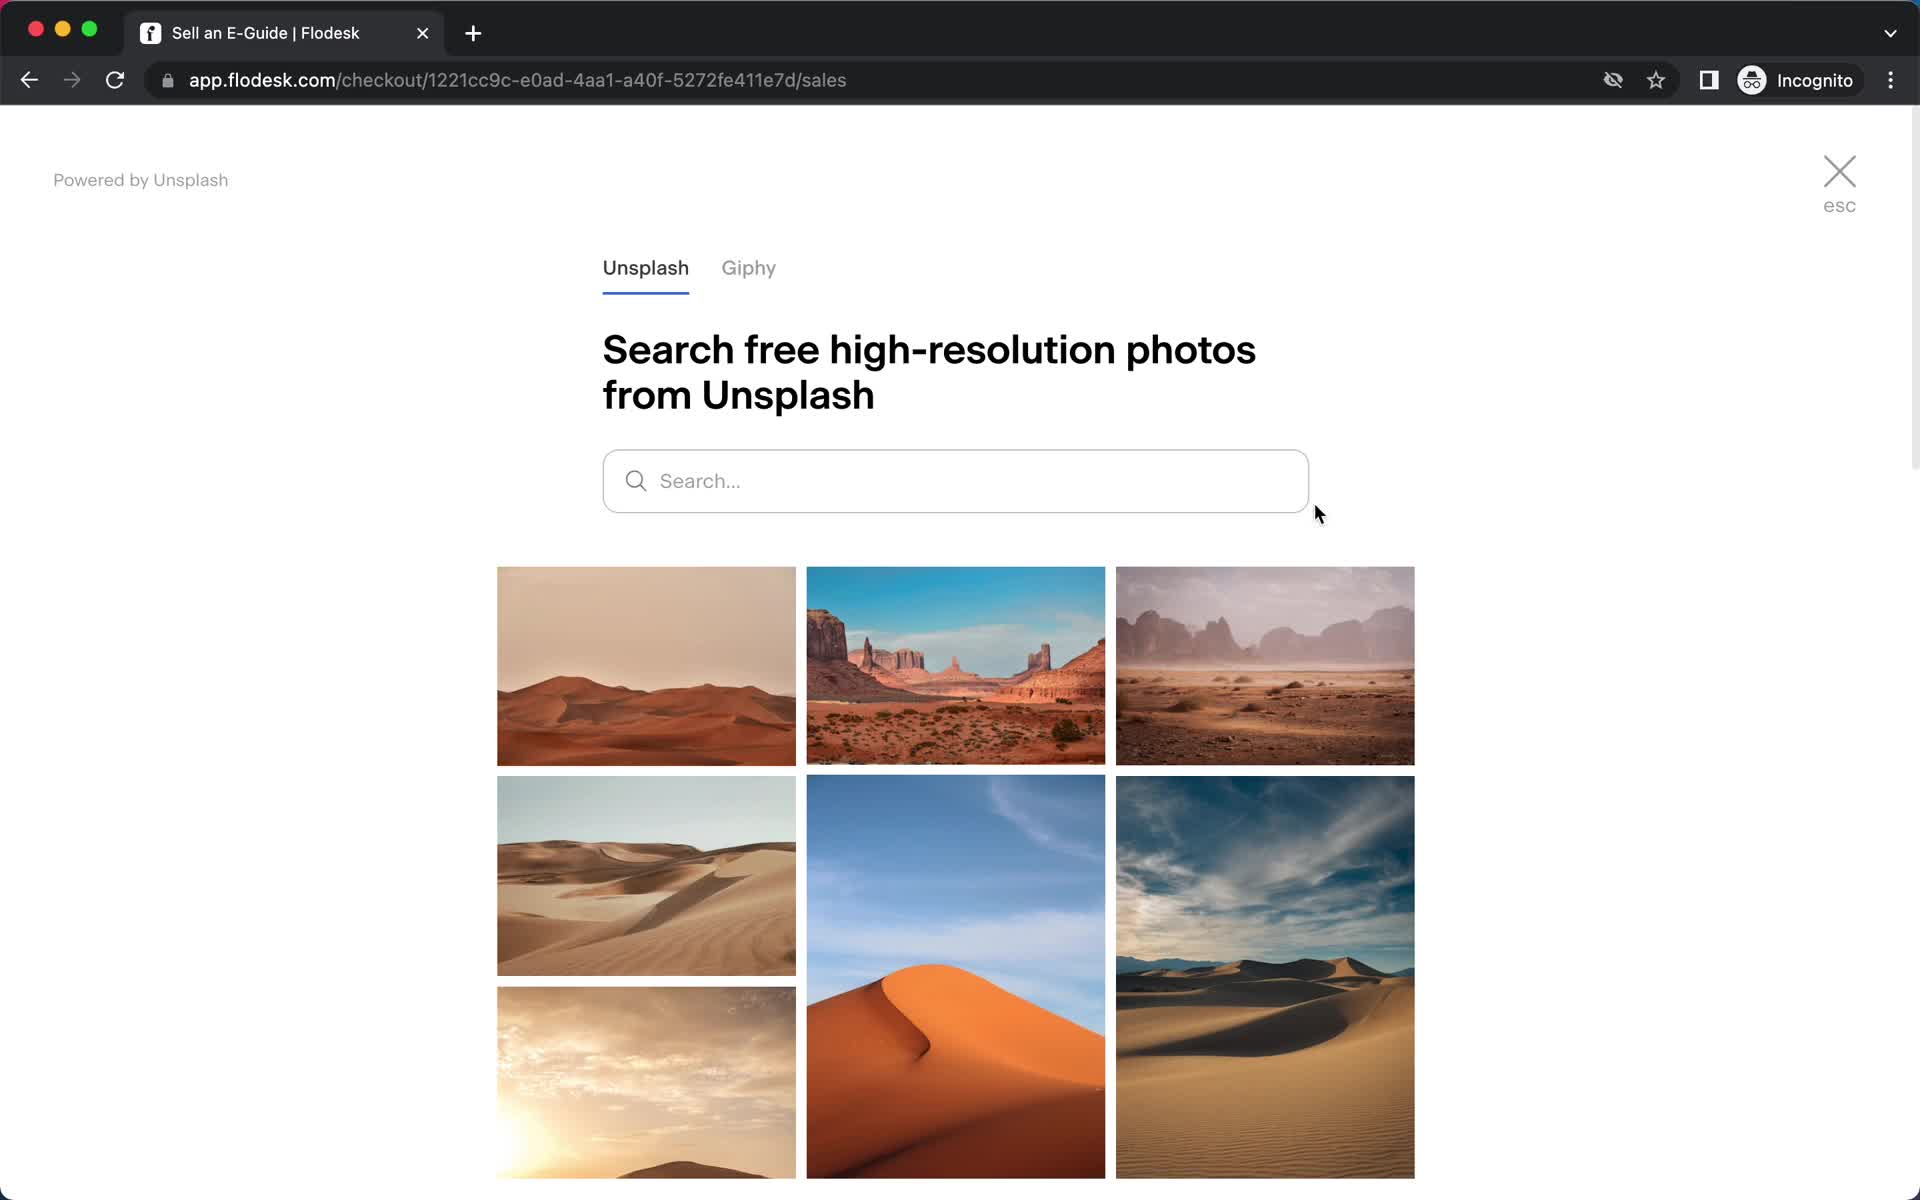
Select image
this is title
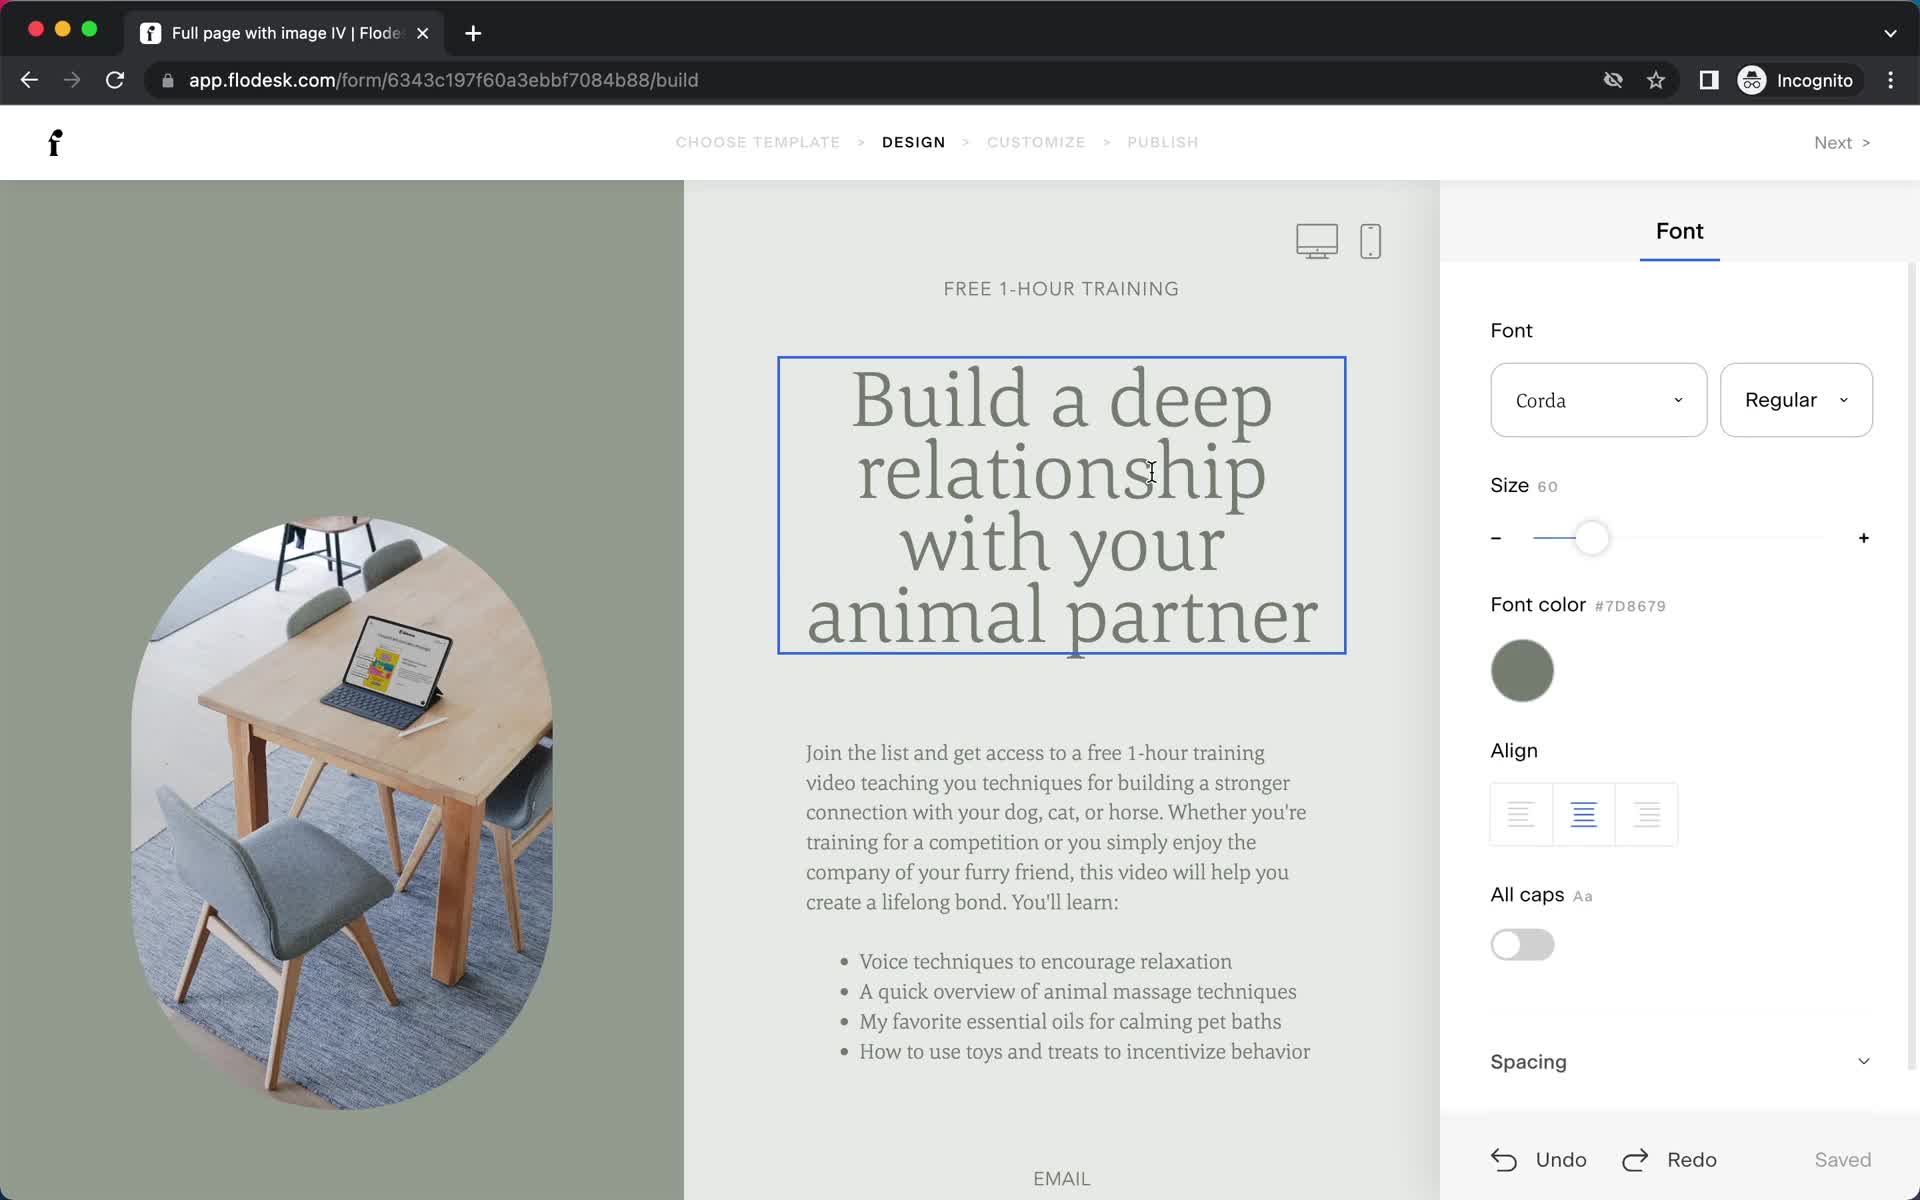
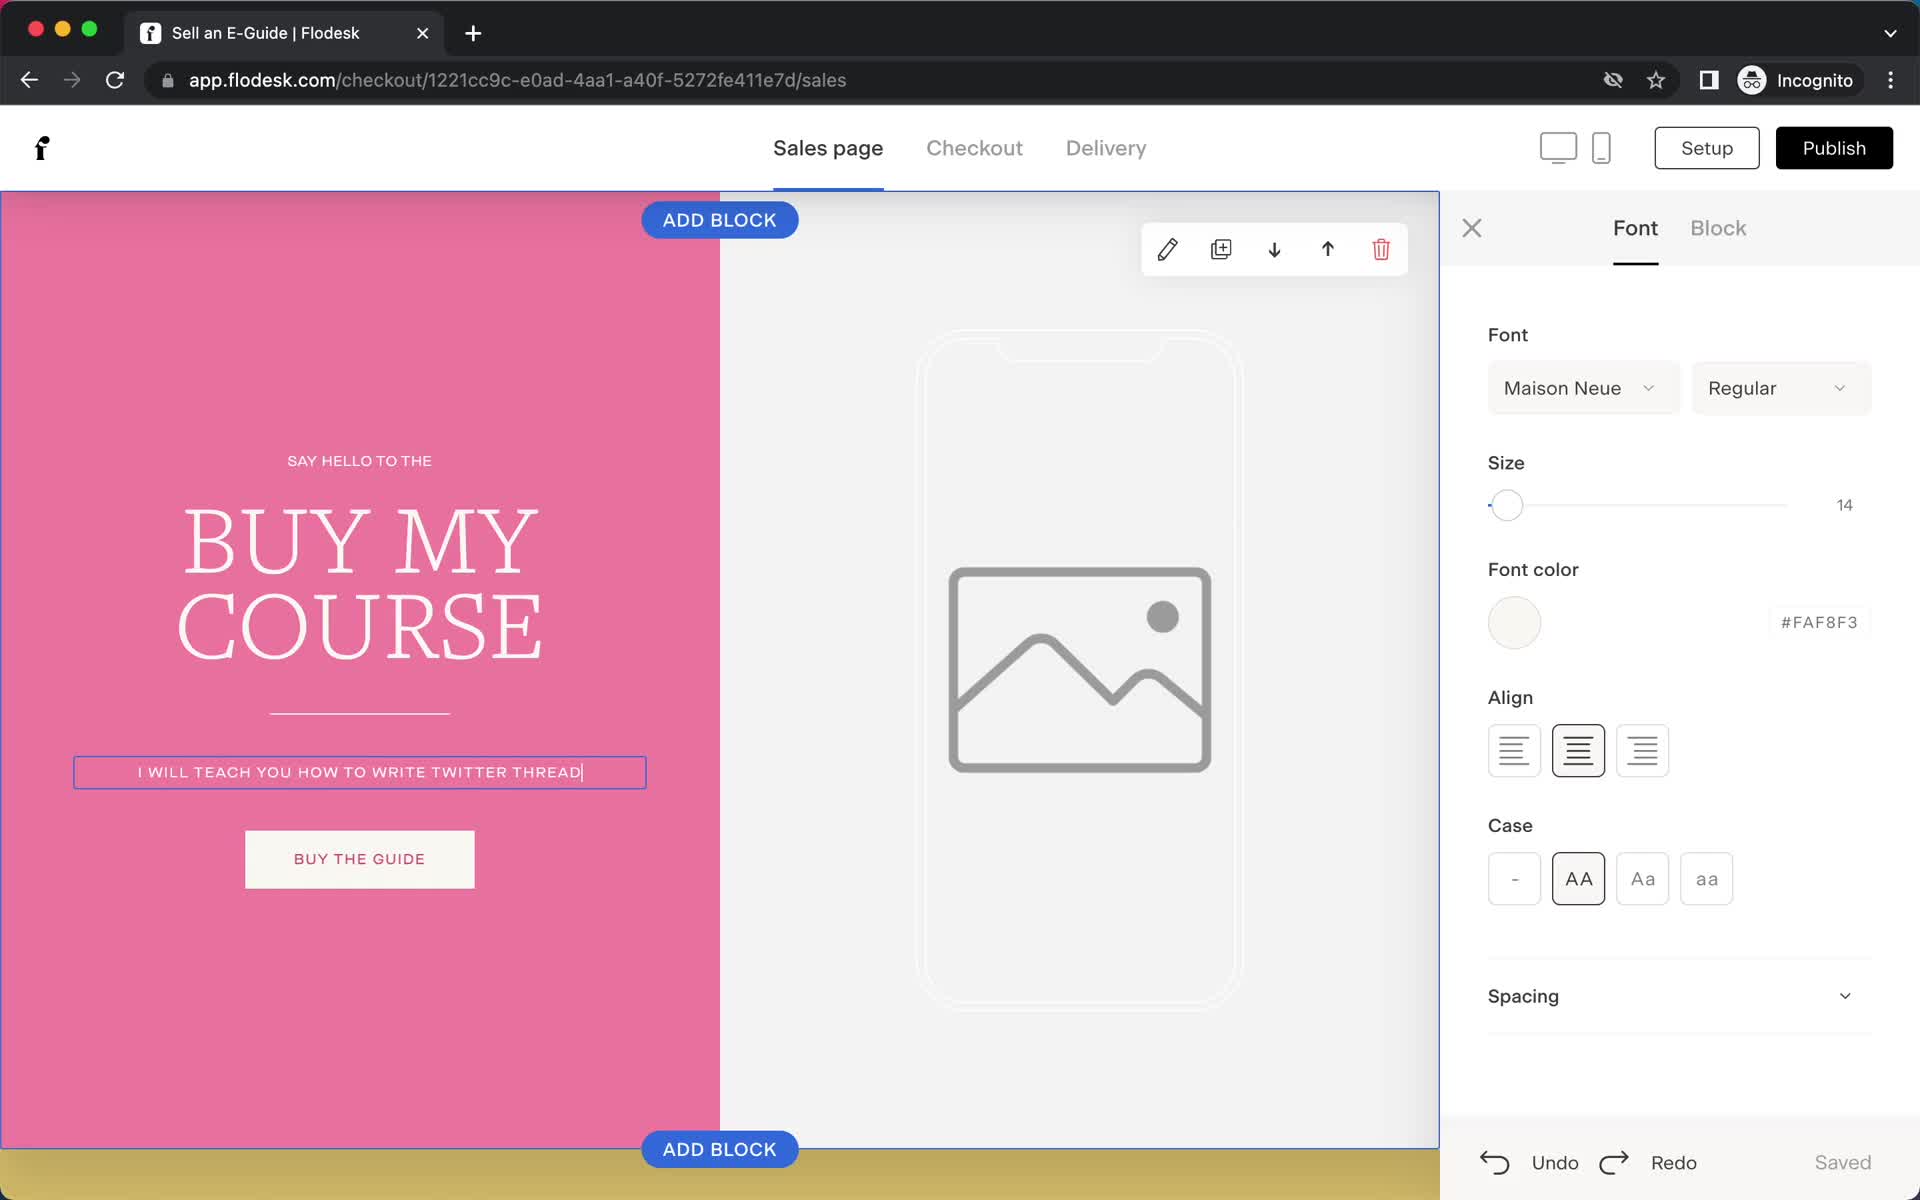
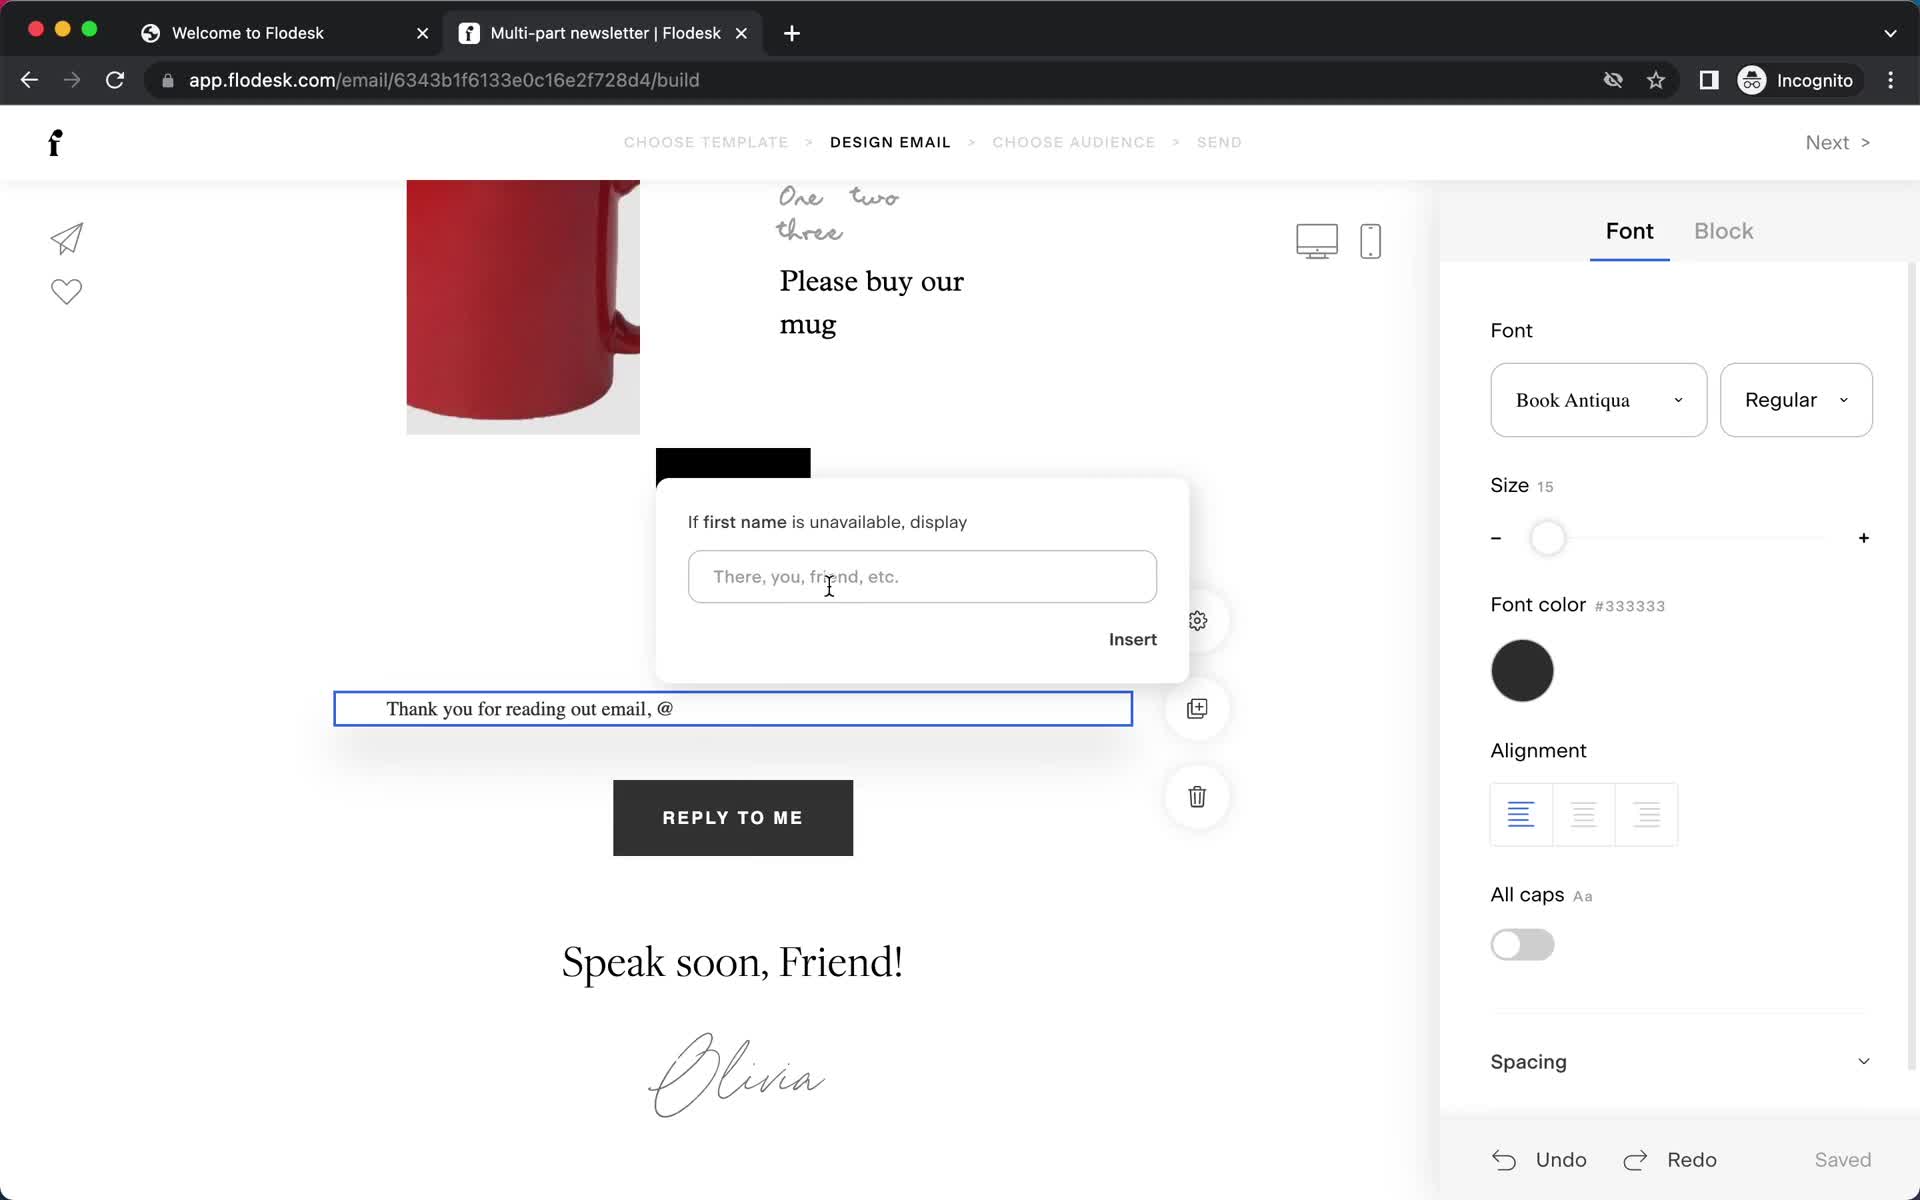
Editor
this is title
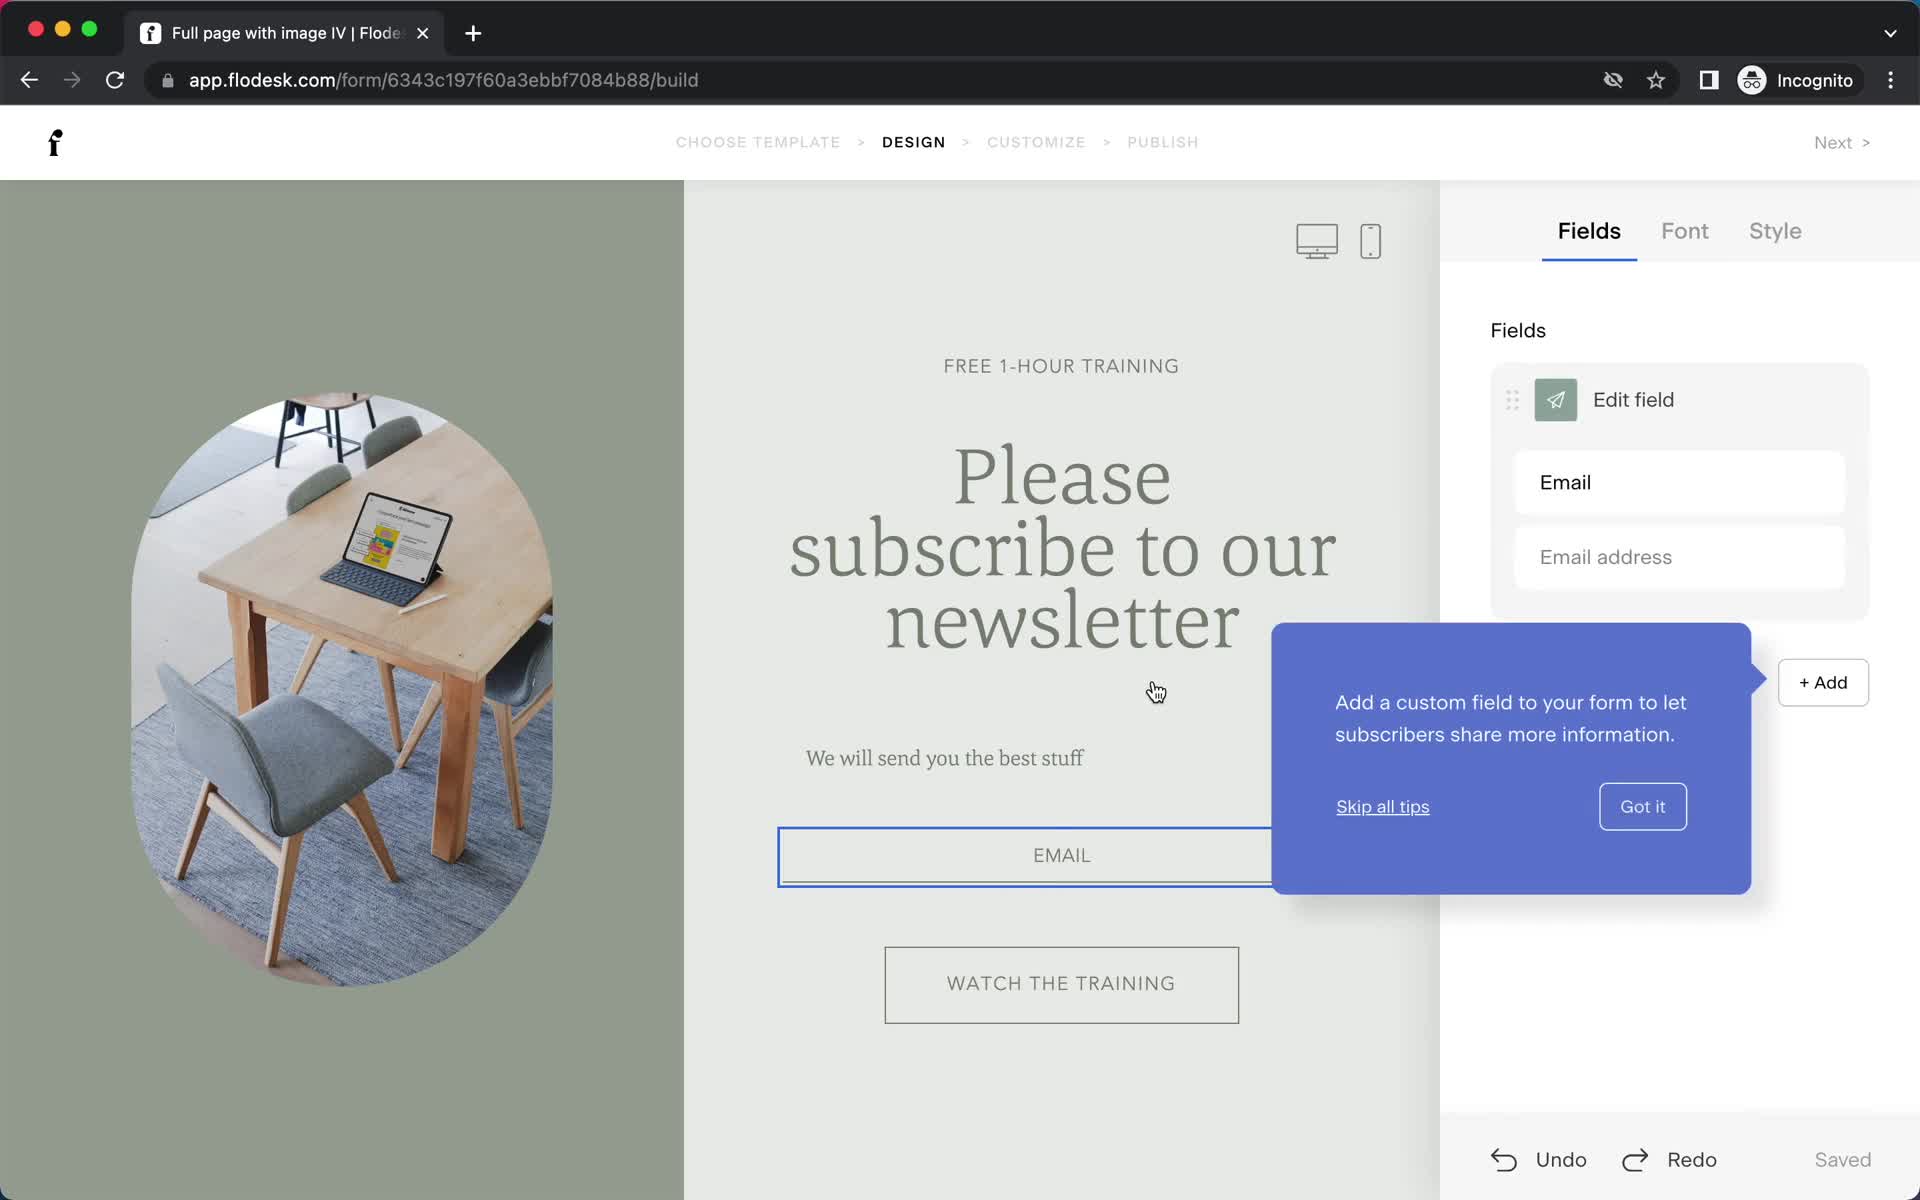
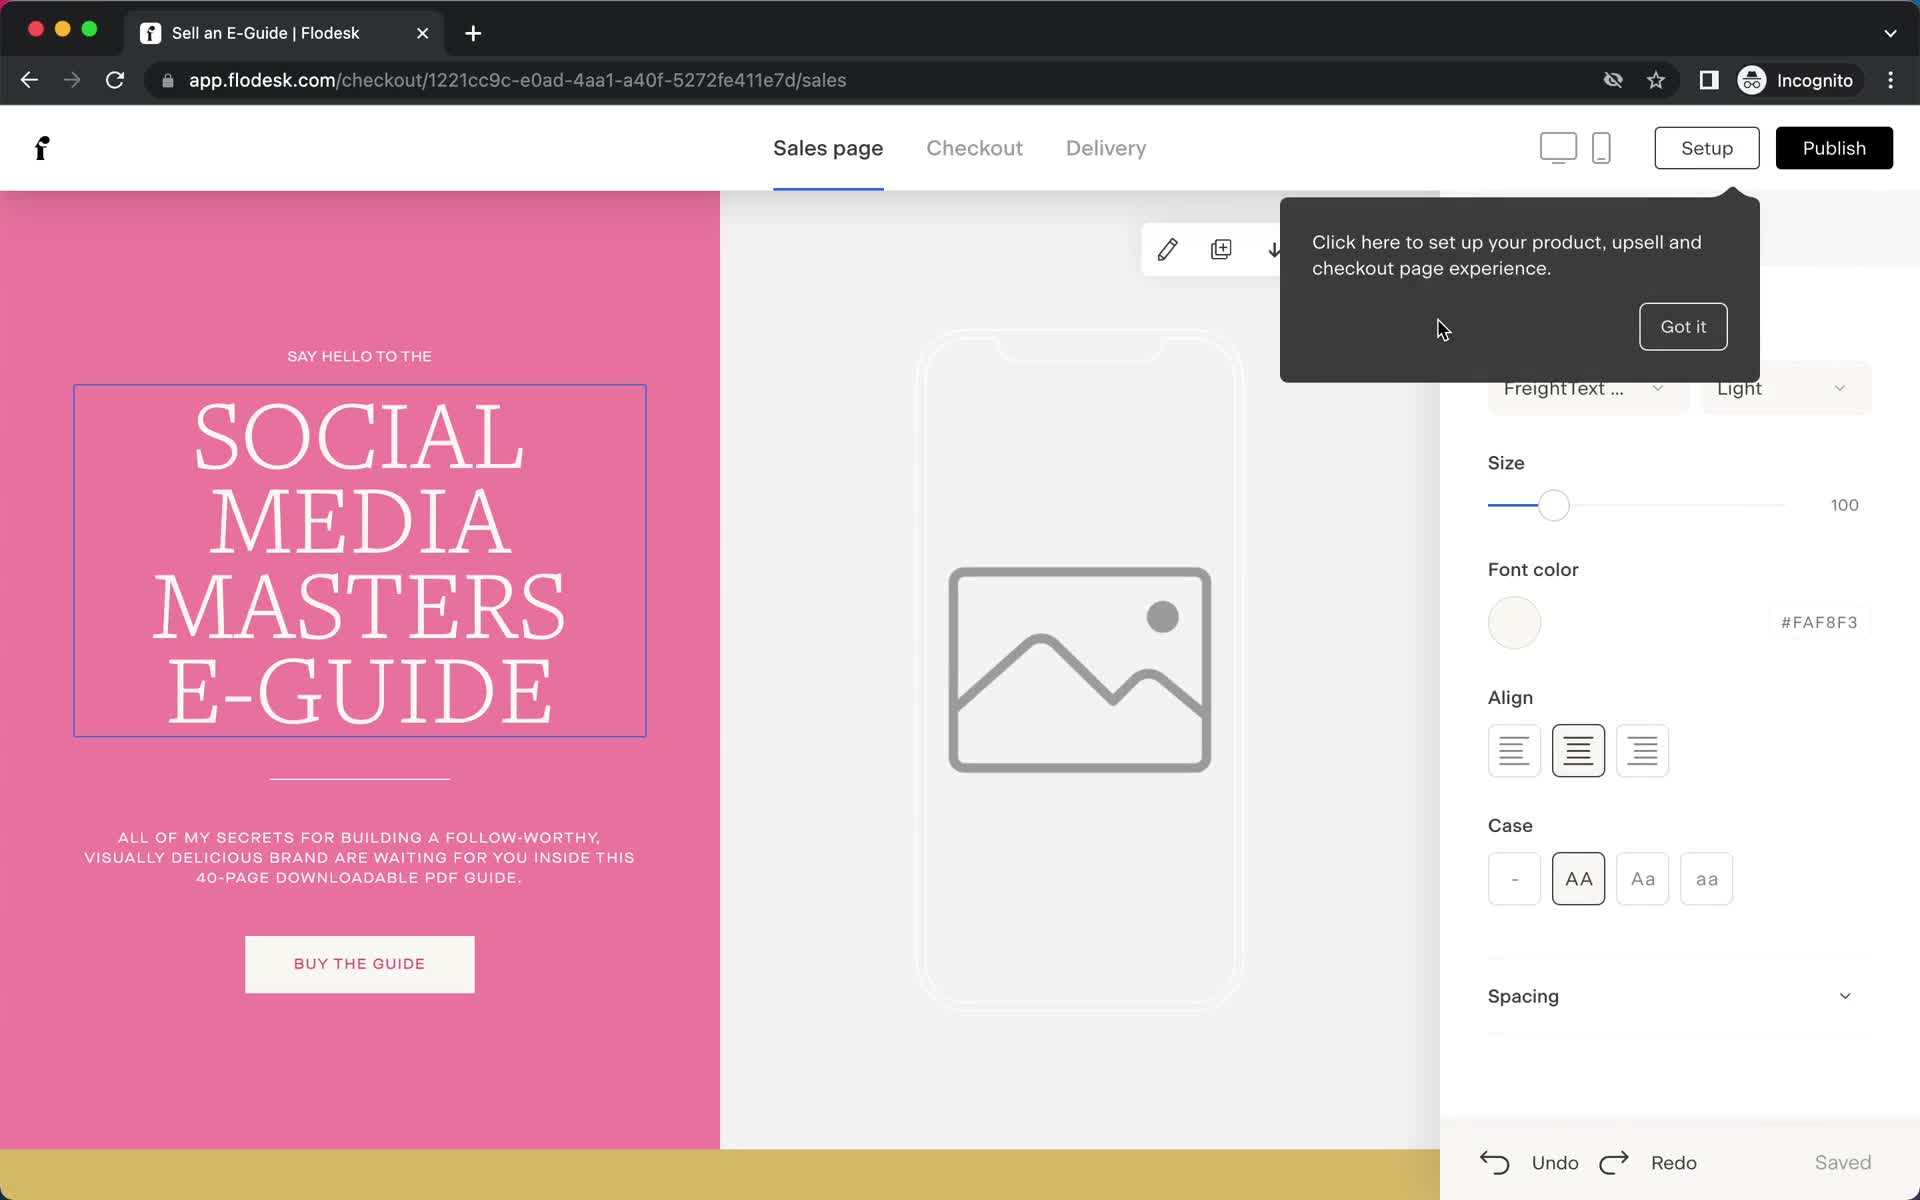
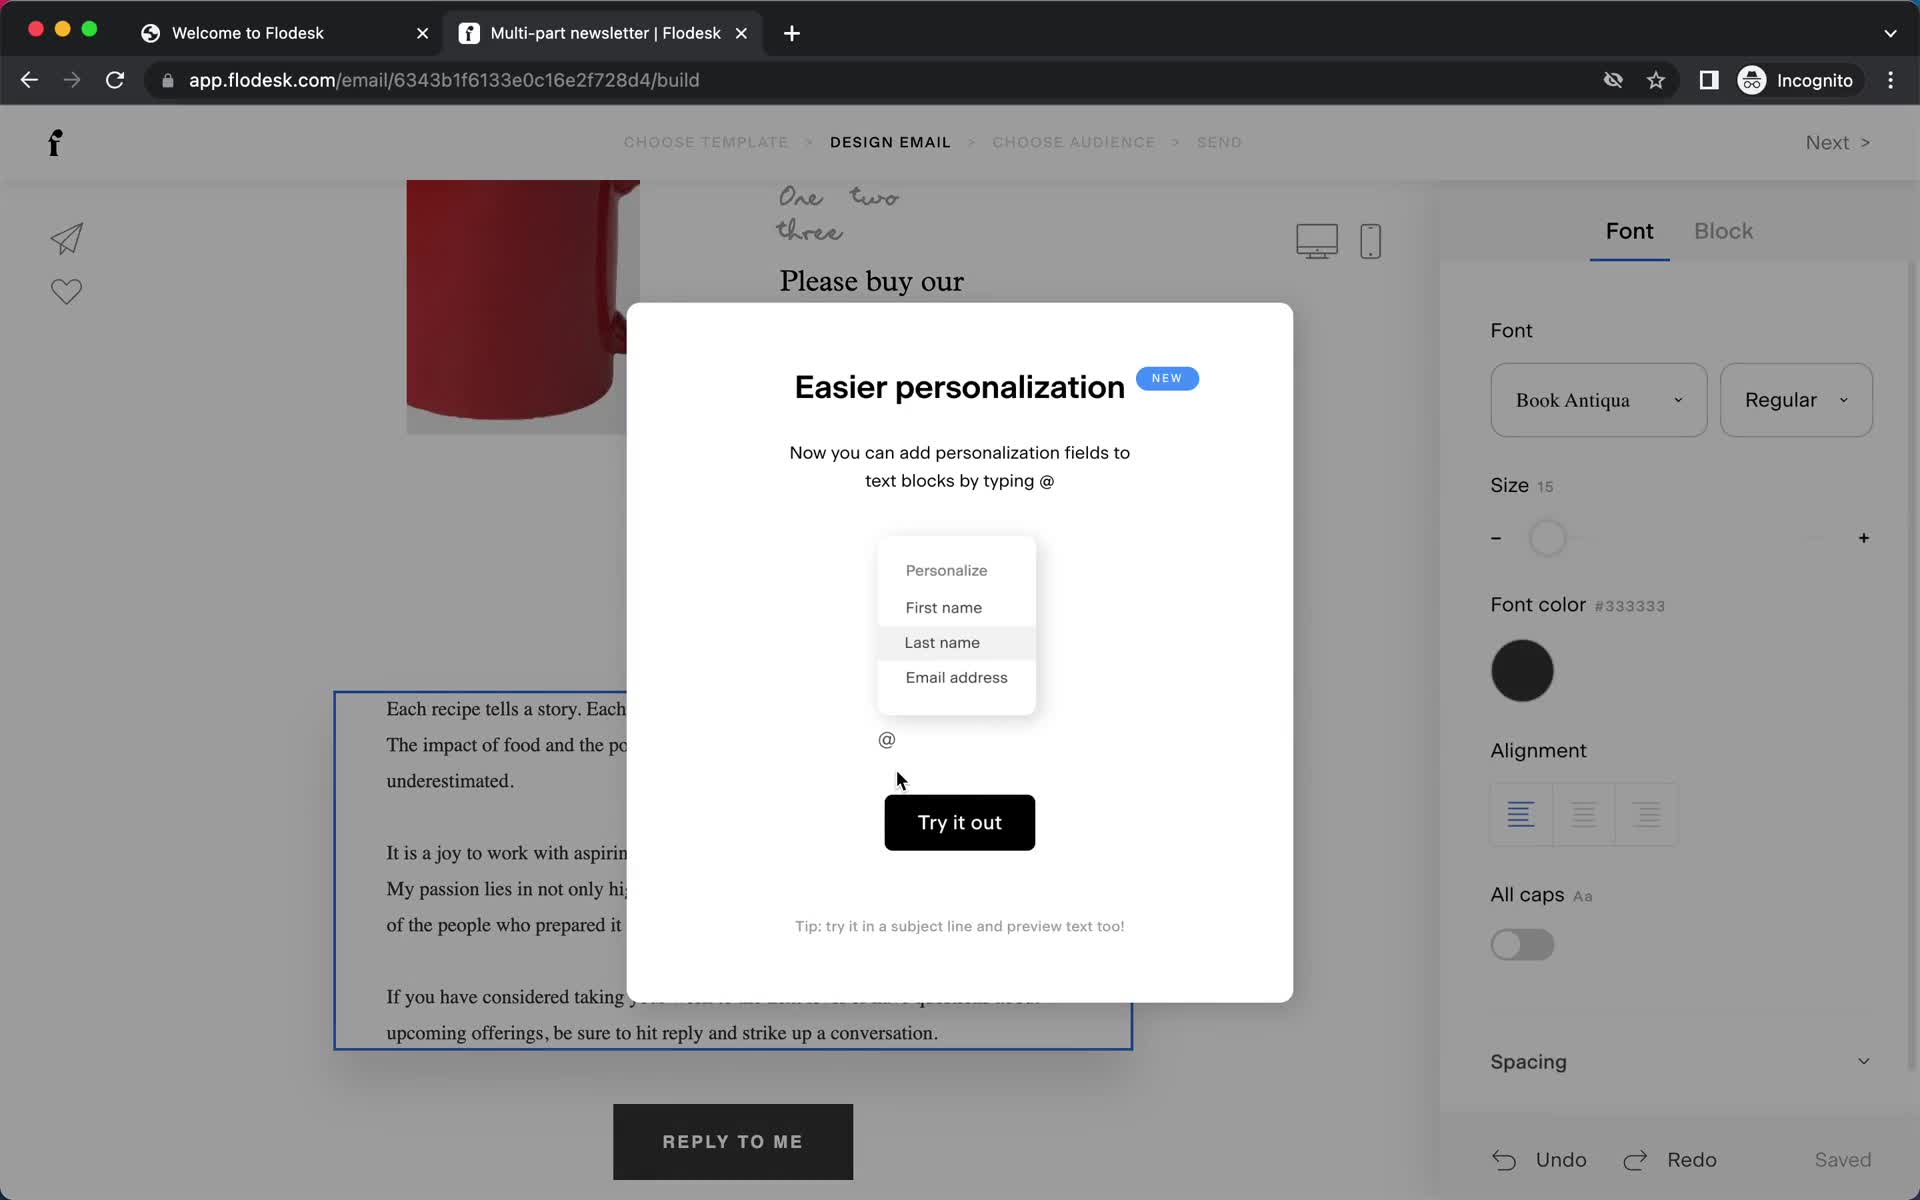
Guide tooltip
this is title
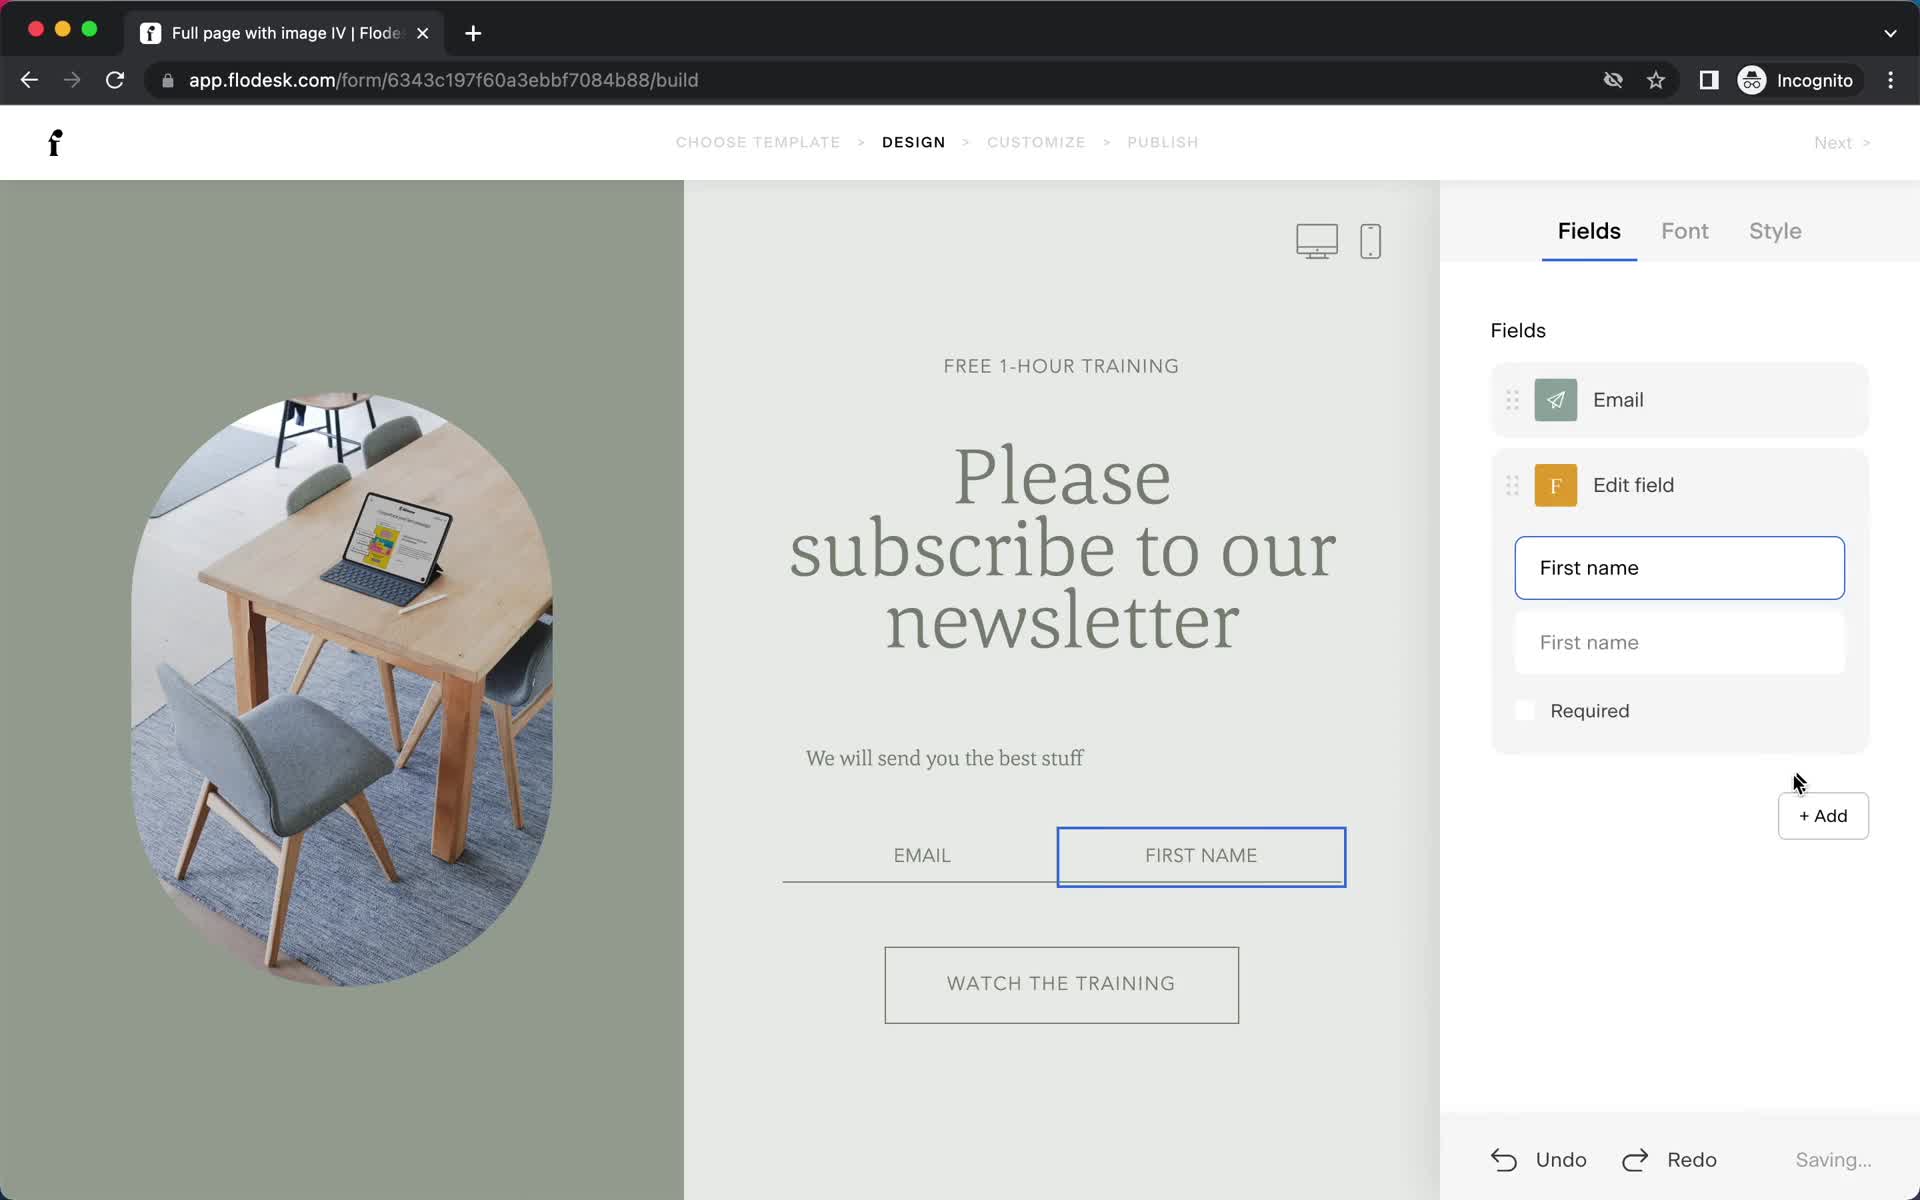
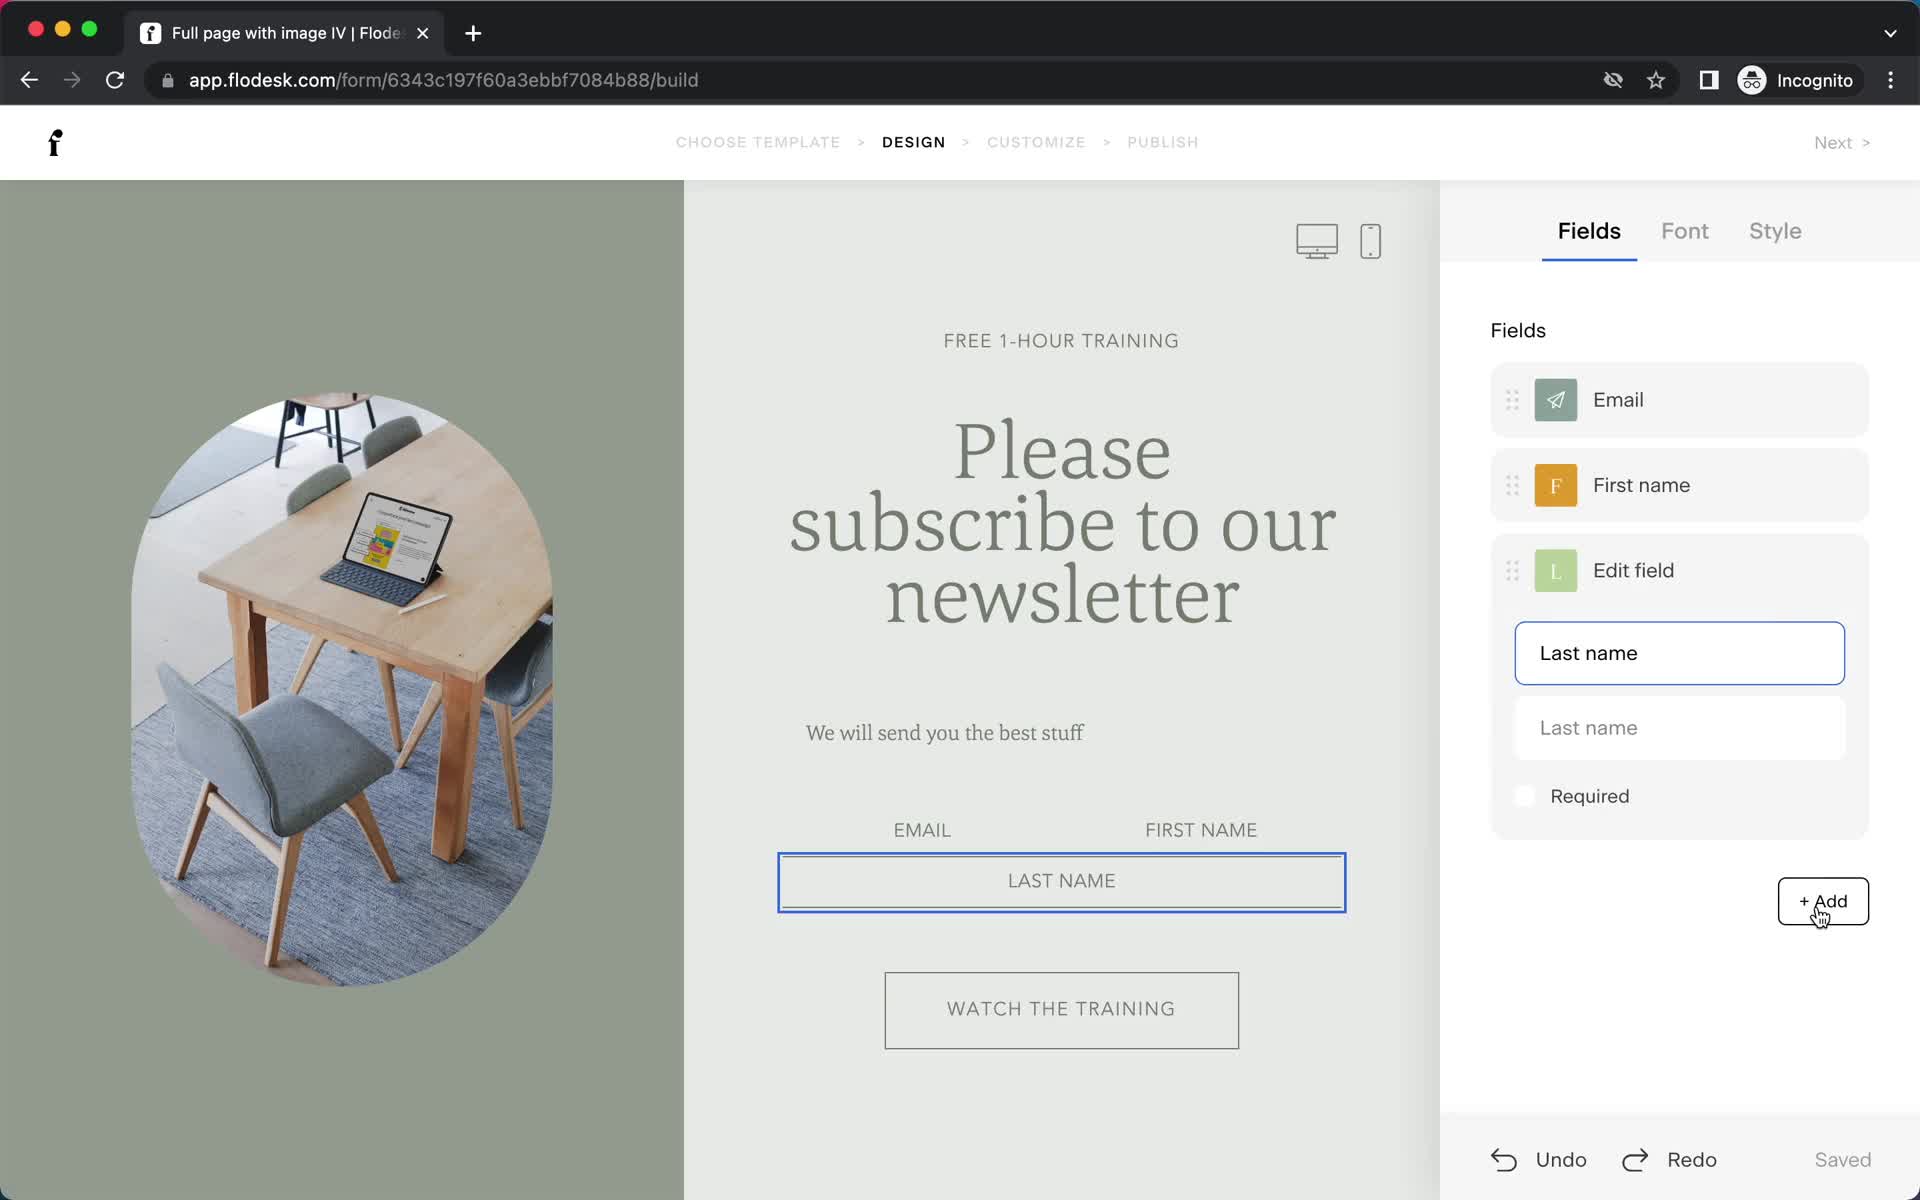
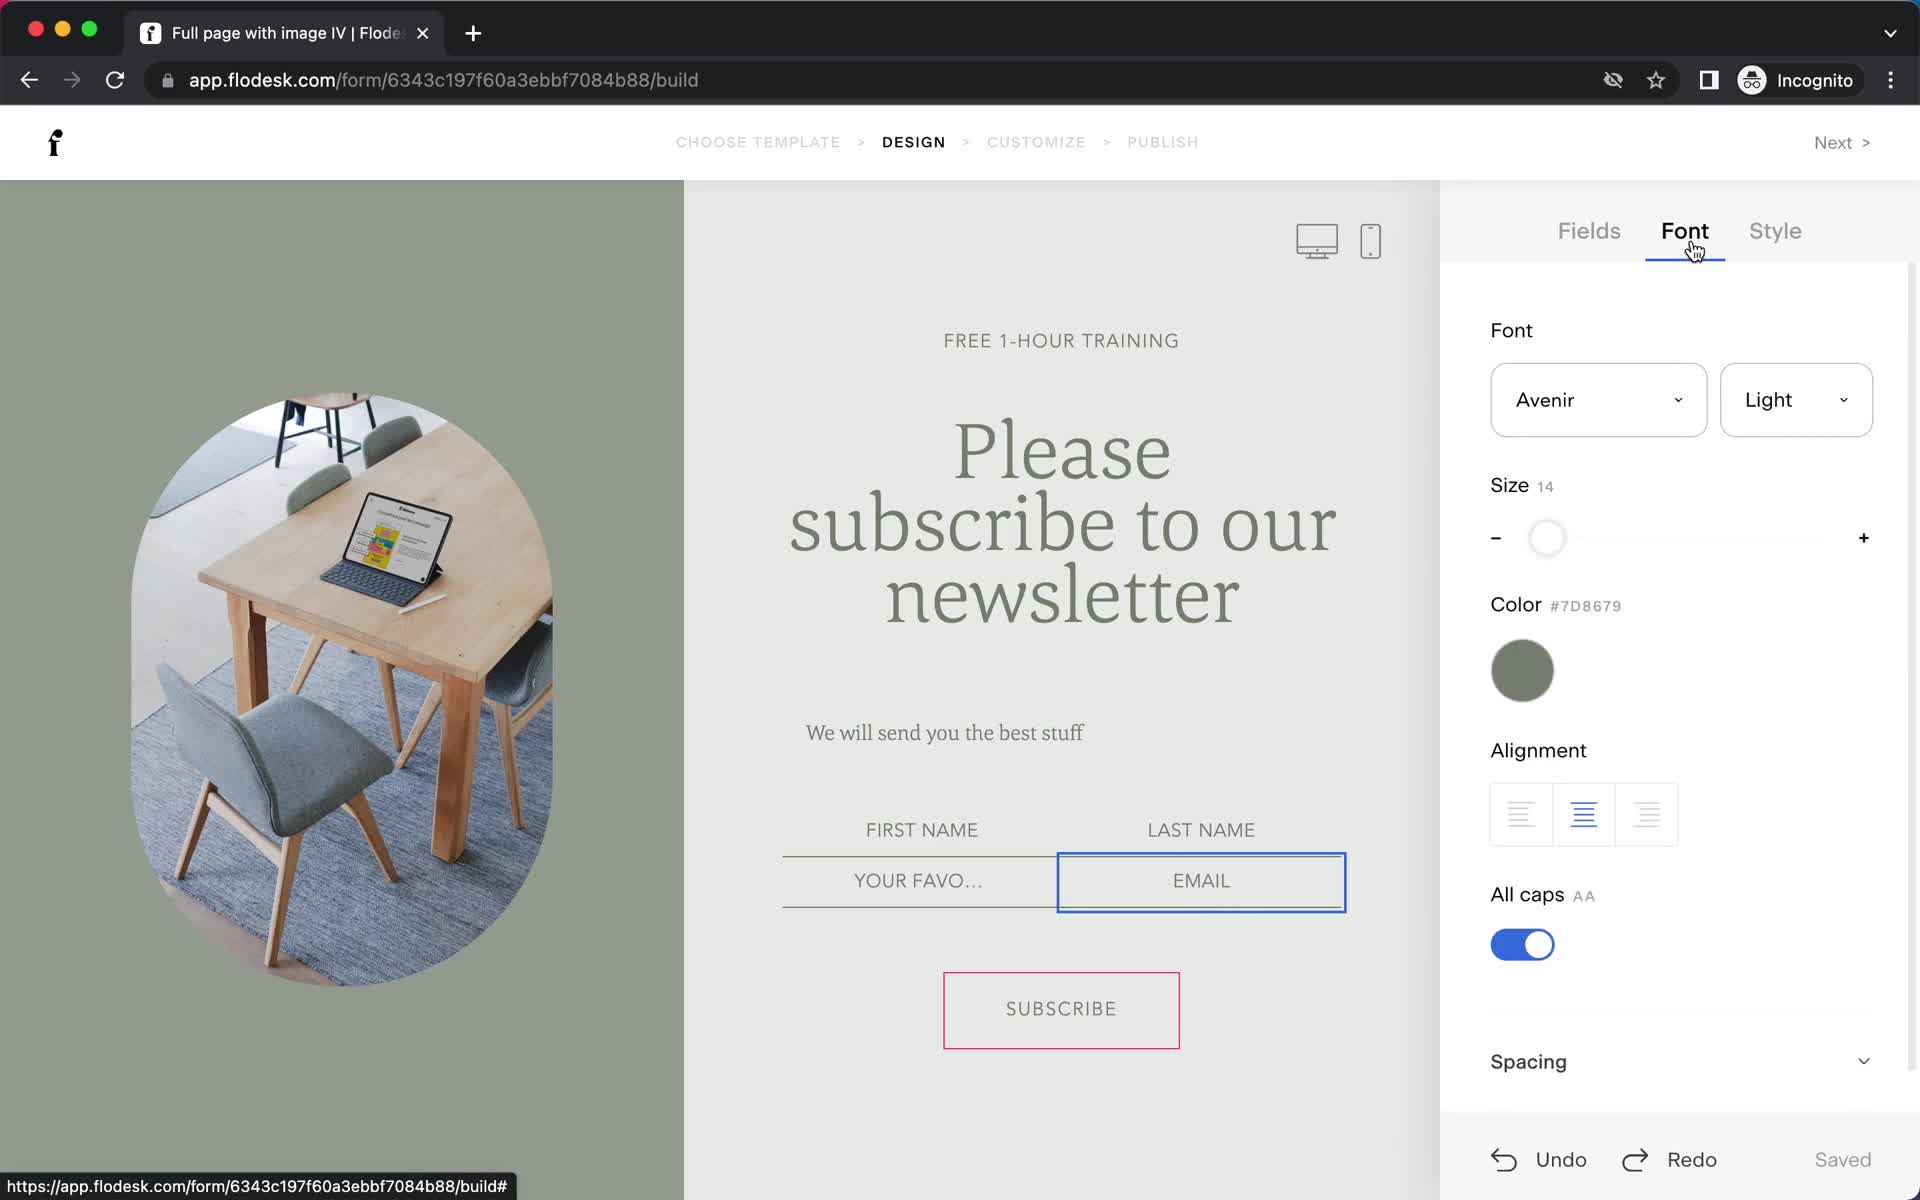
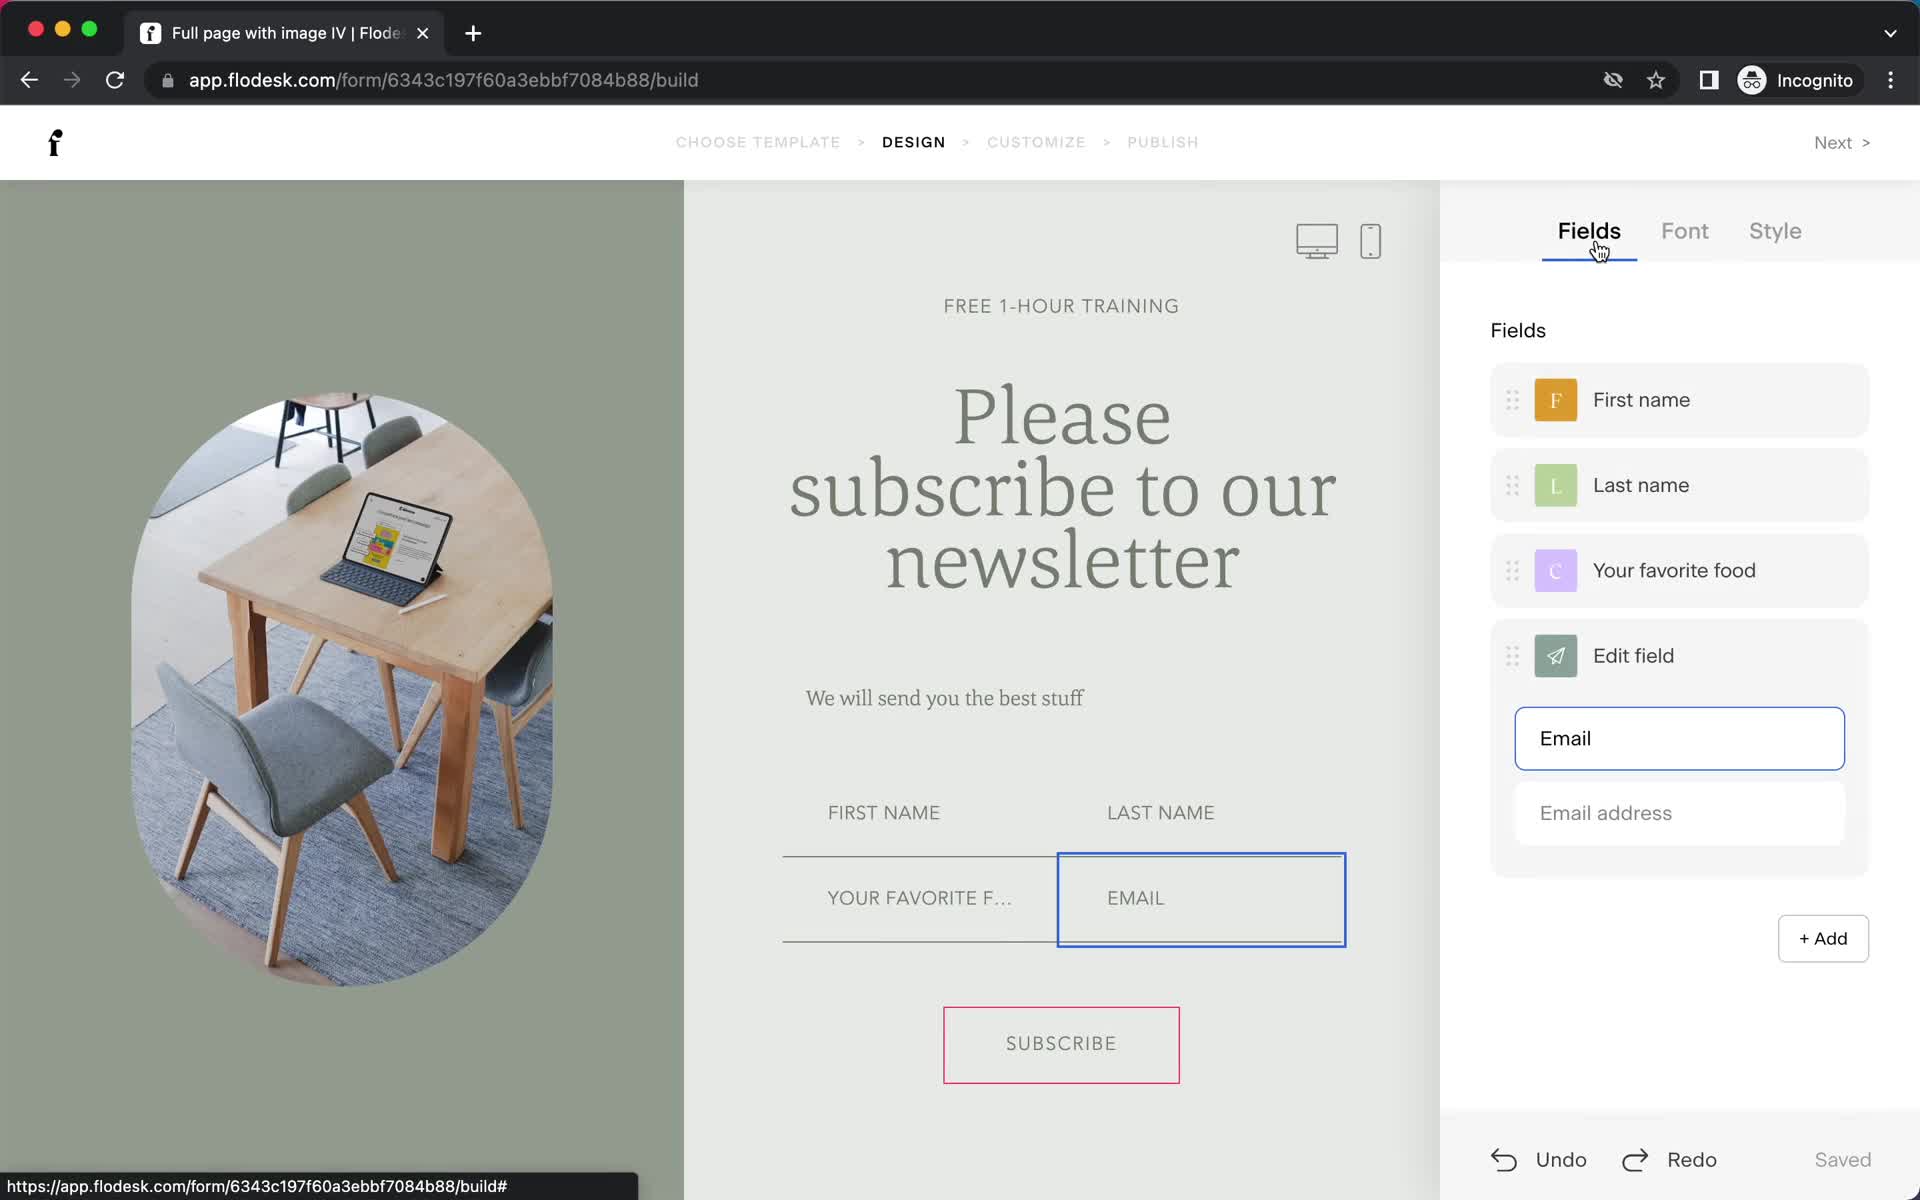
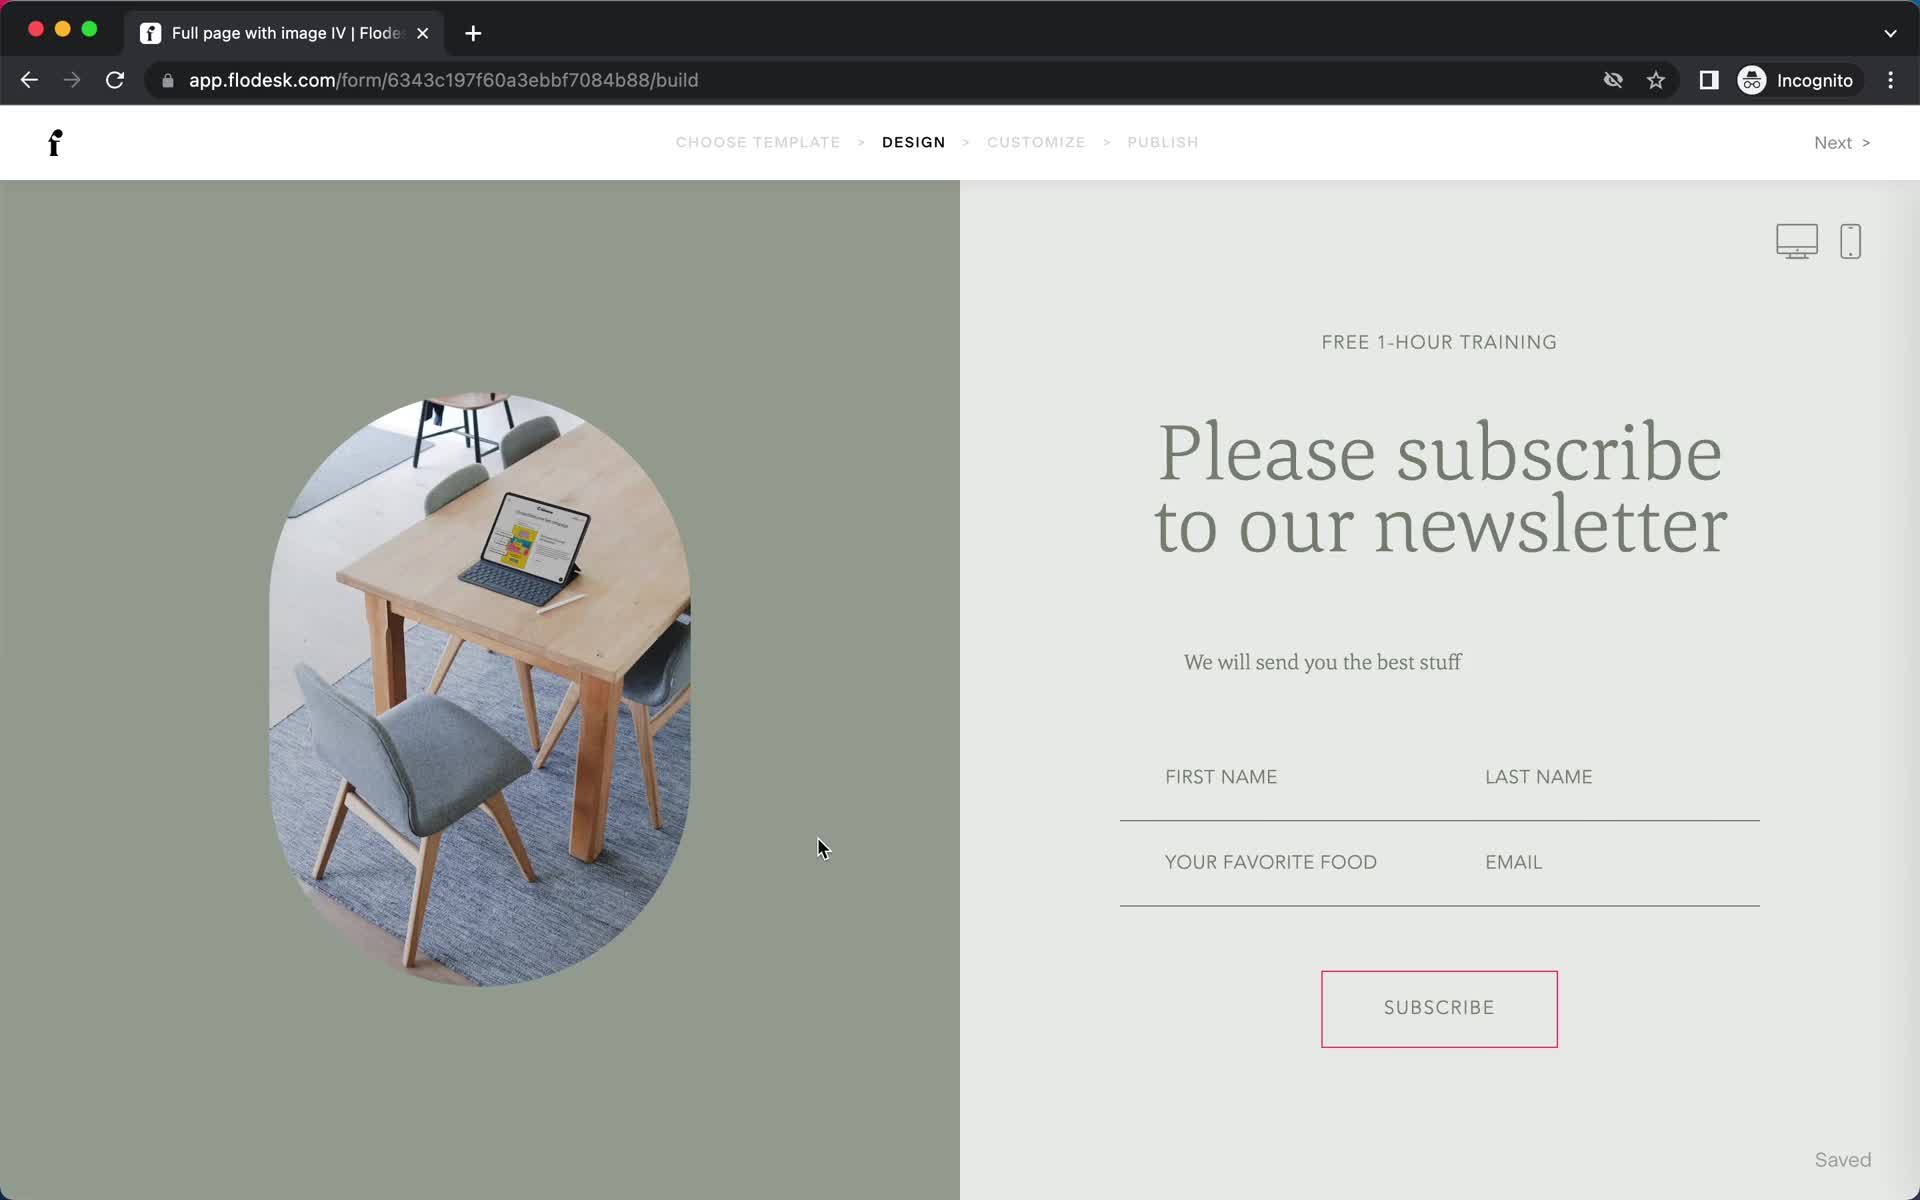
Form builder
this is title
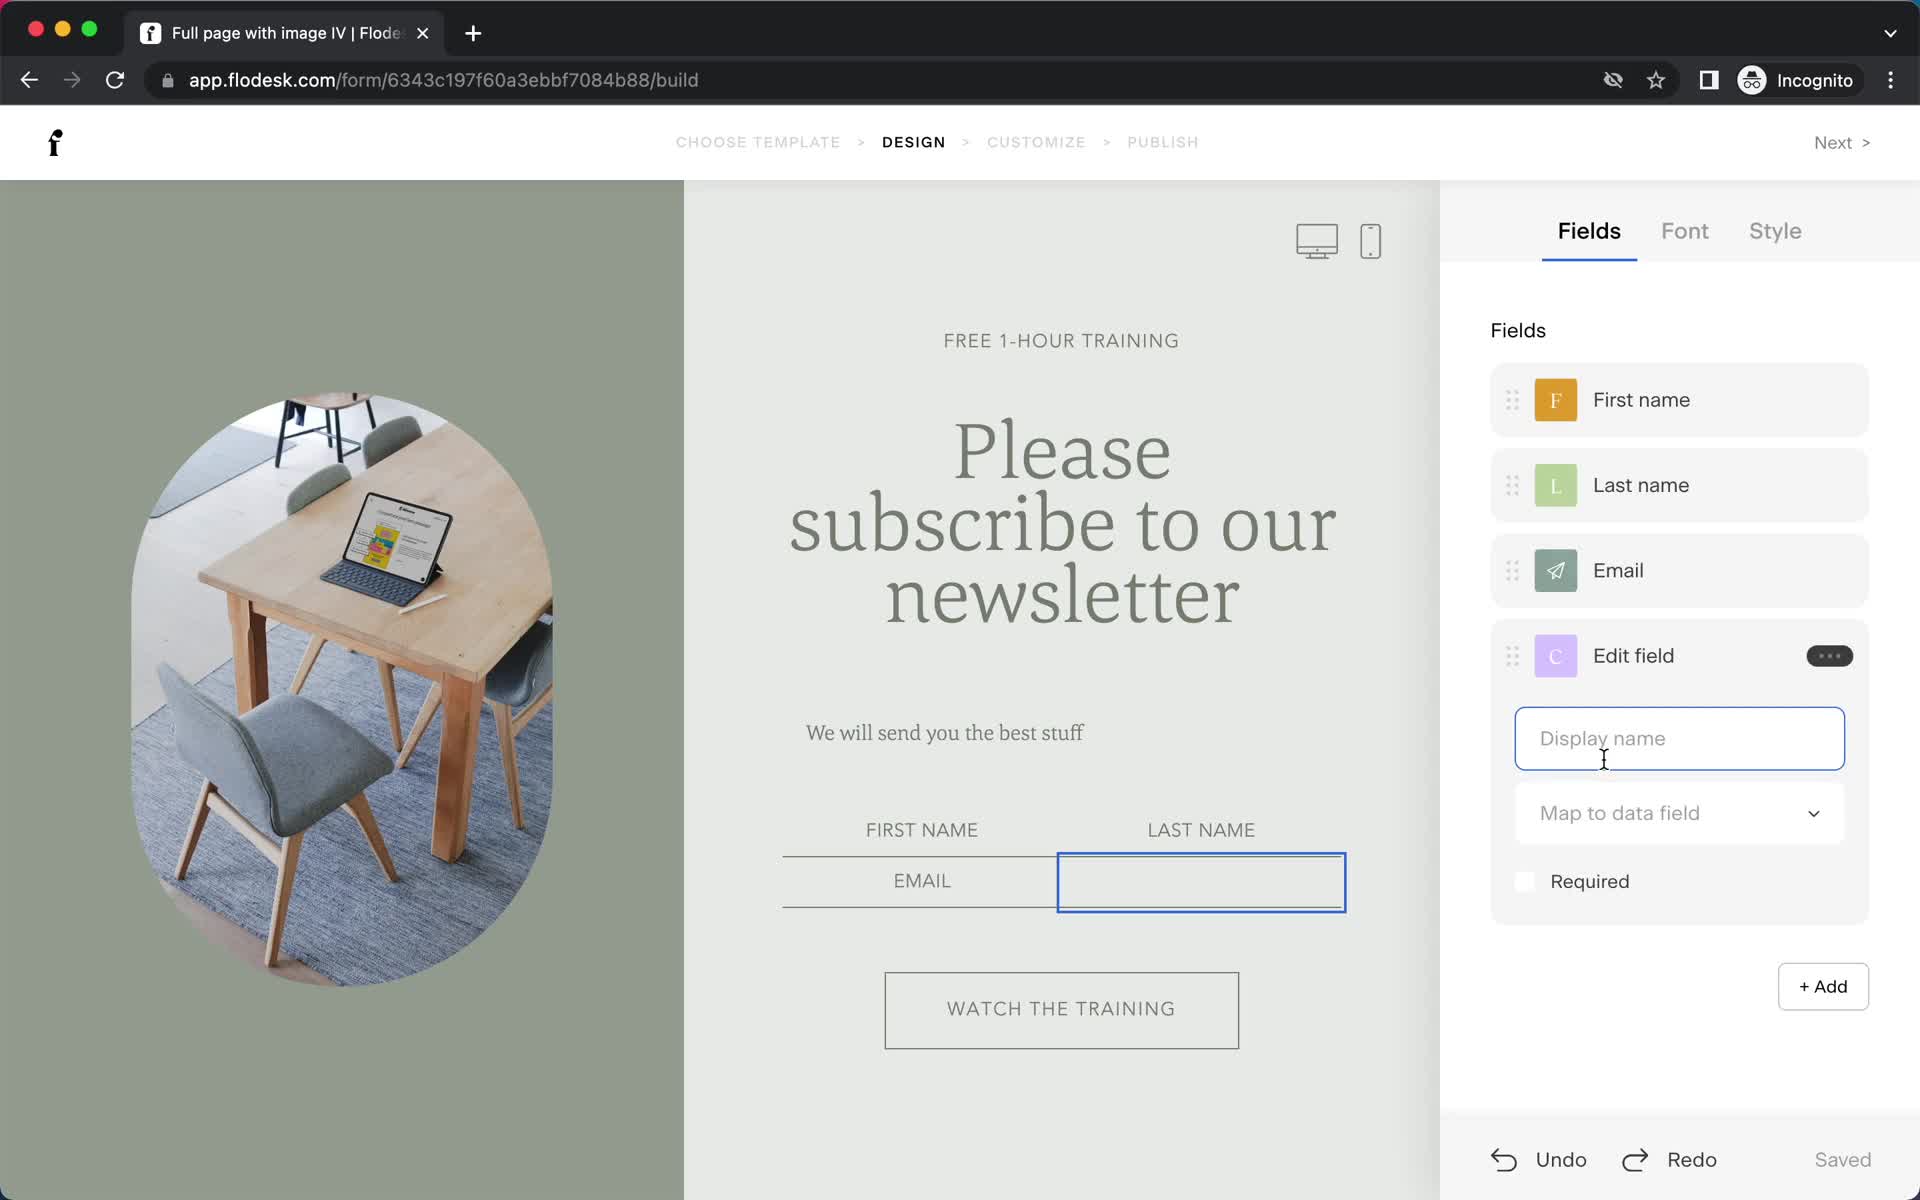
Form builder
this is title
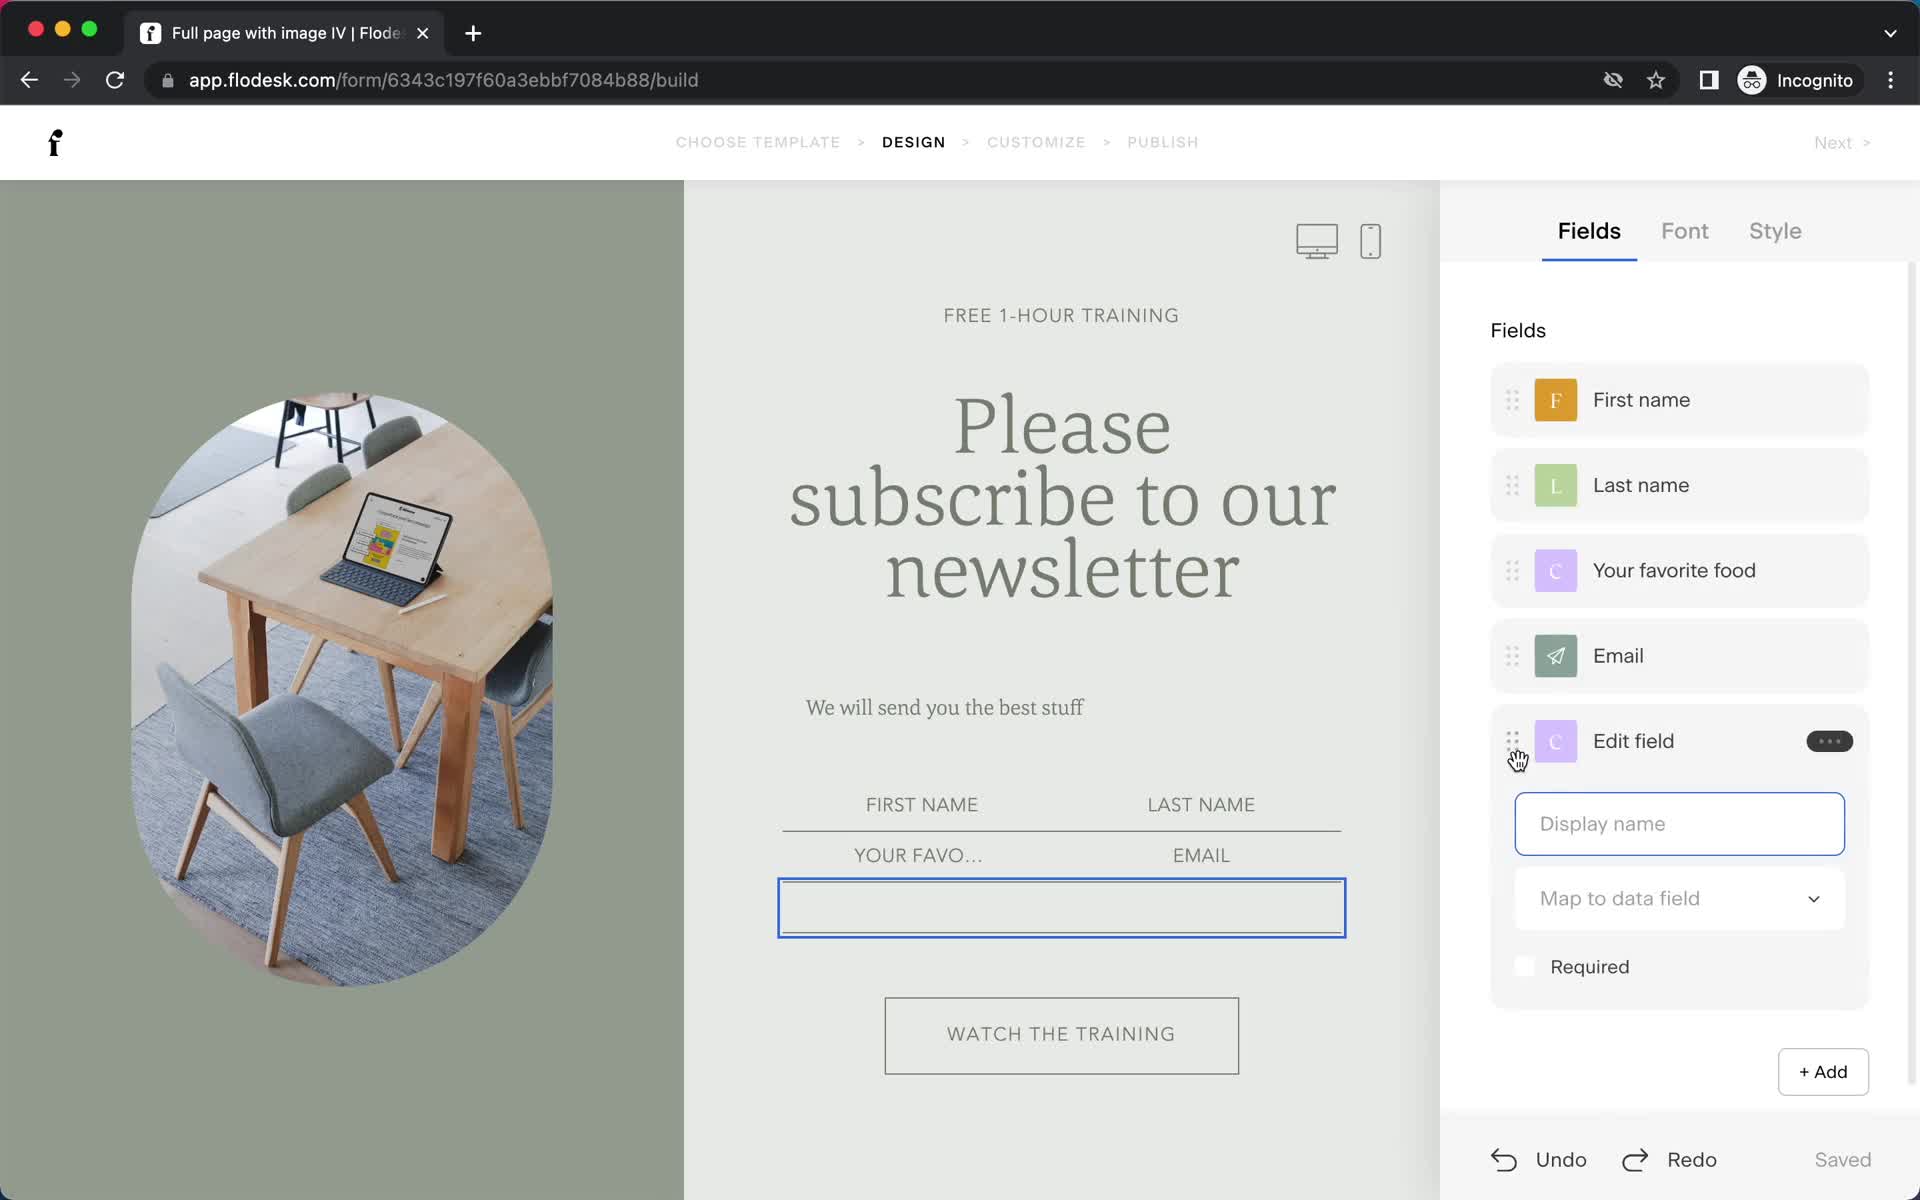
Form builder
this is title
Form builder
this is title
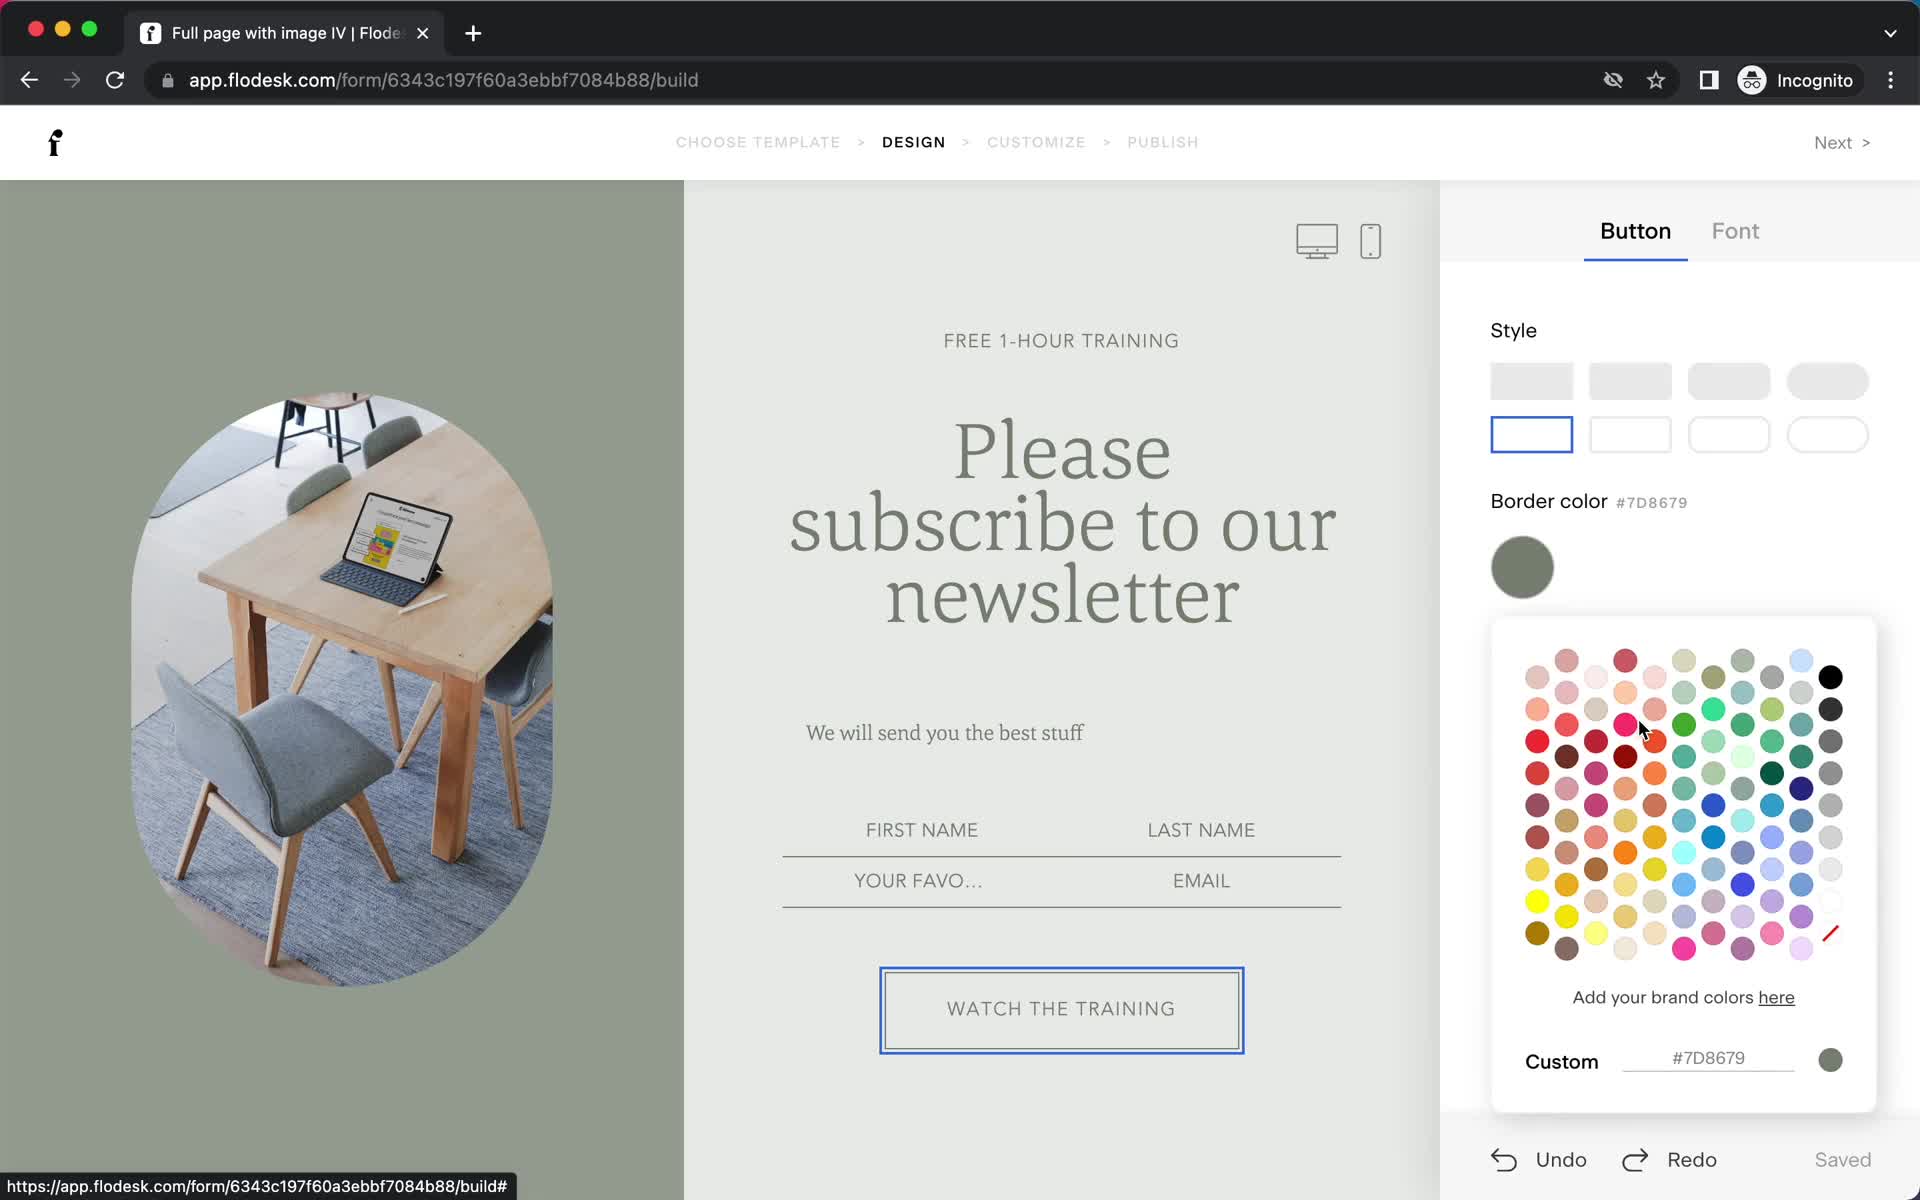
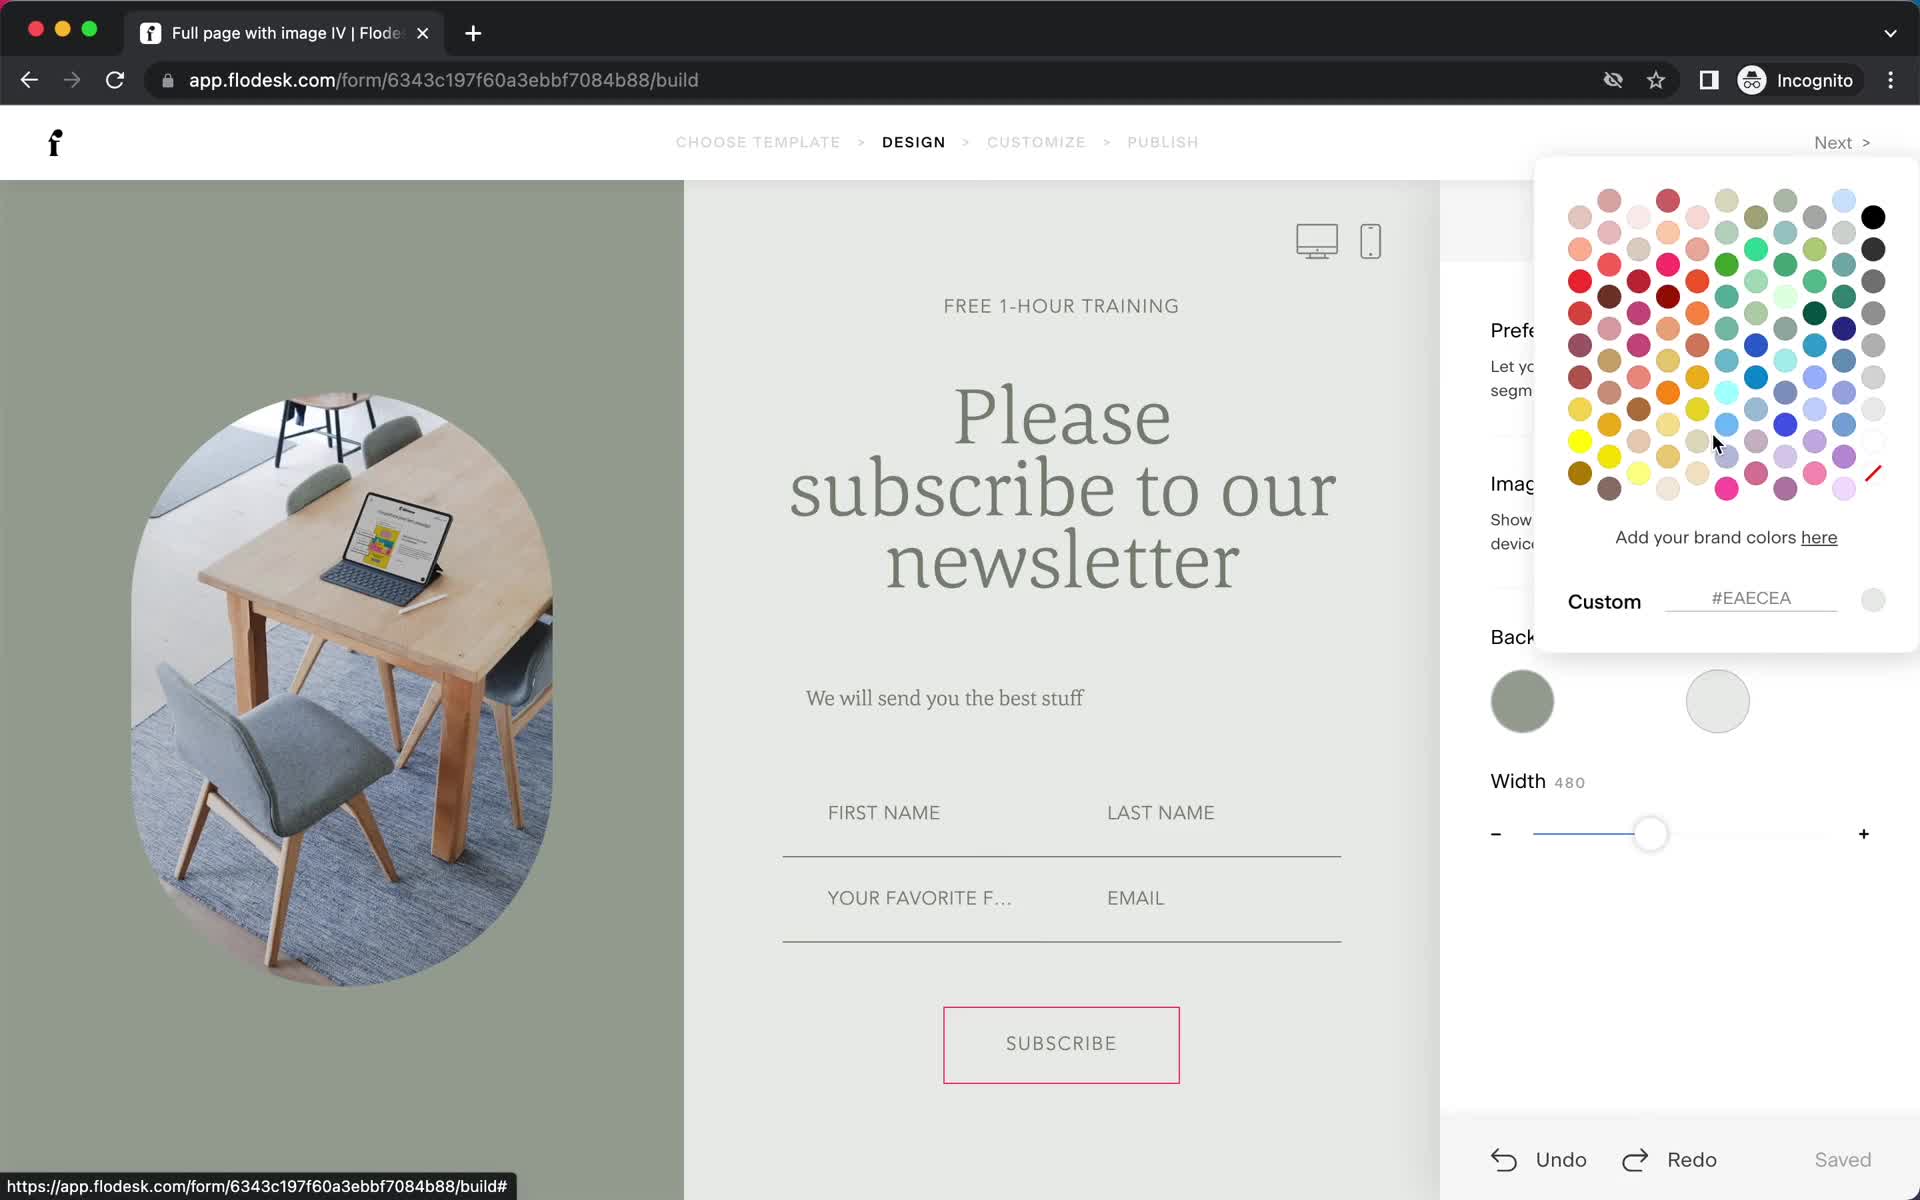
Set colors
this is title
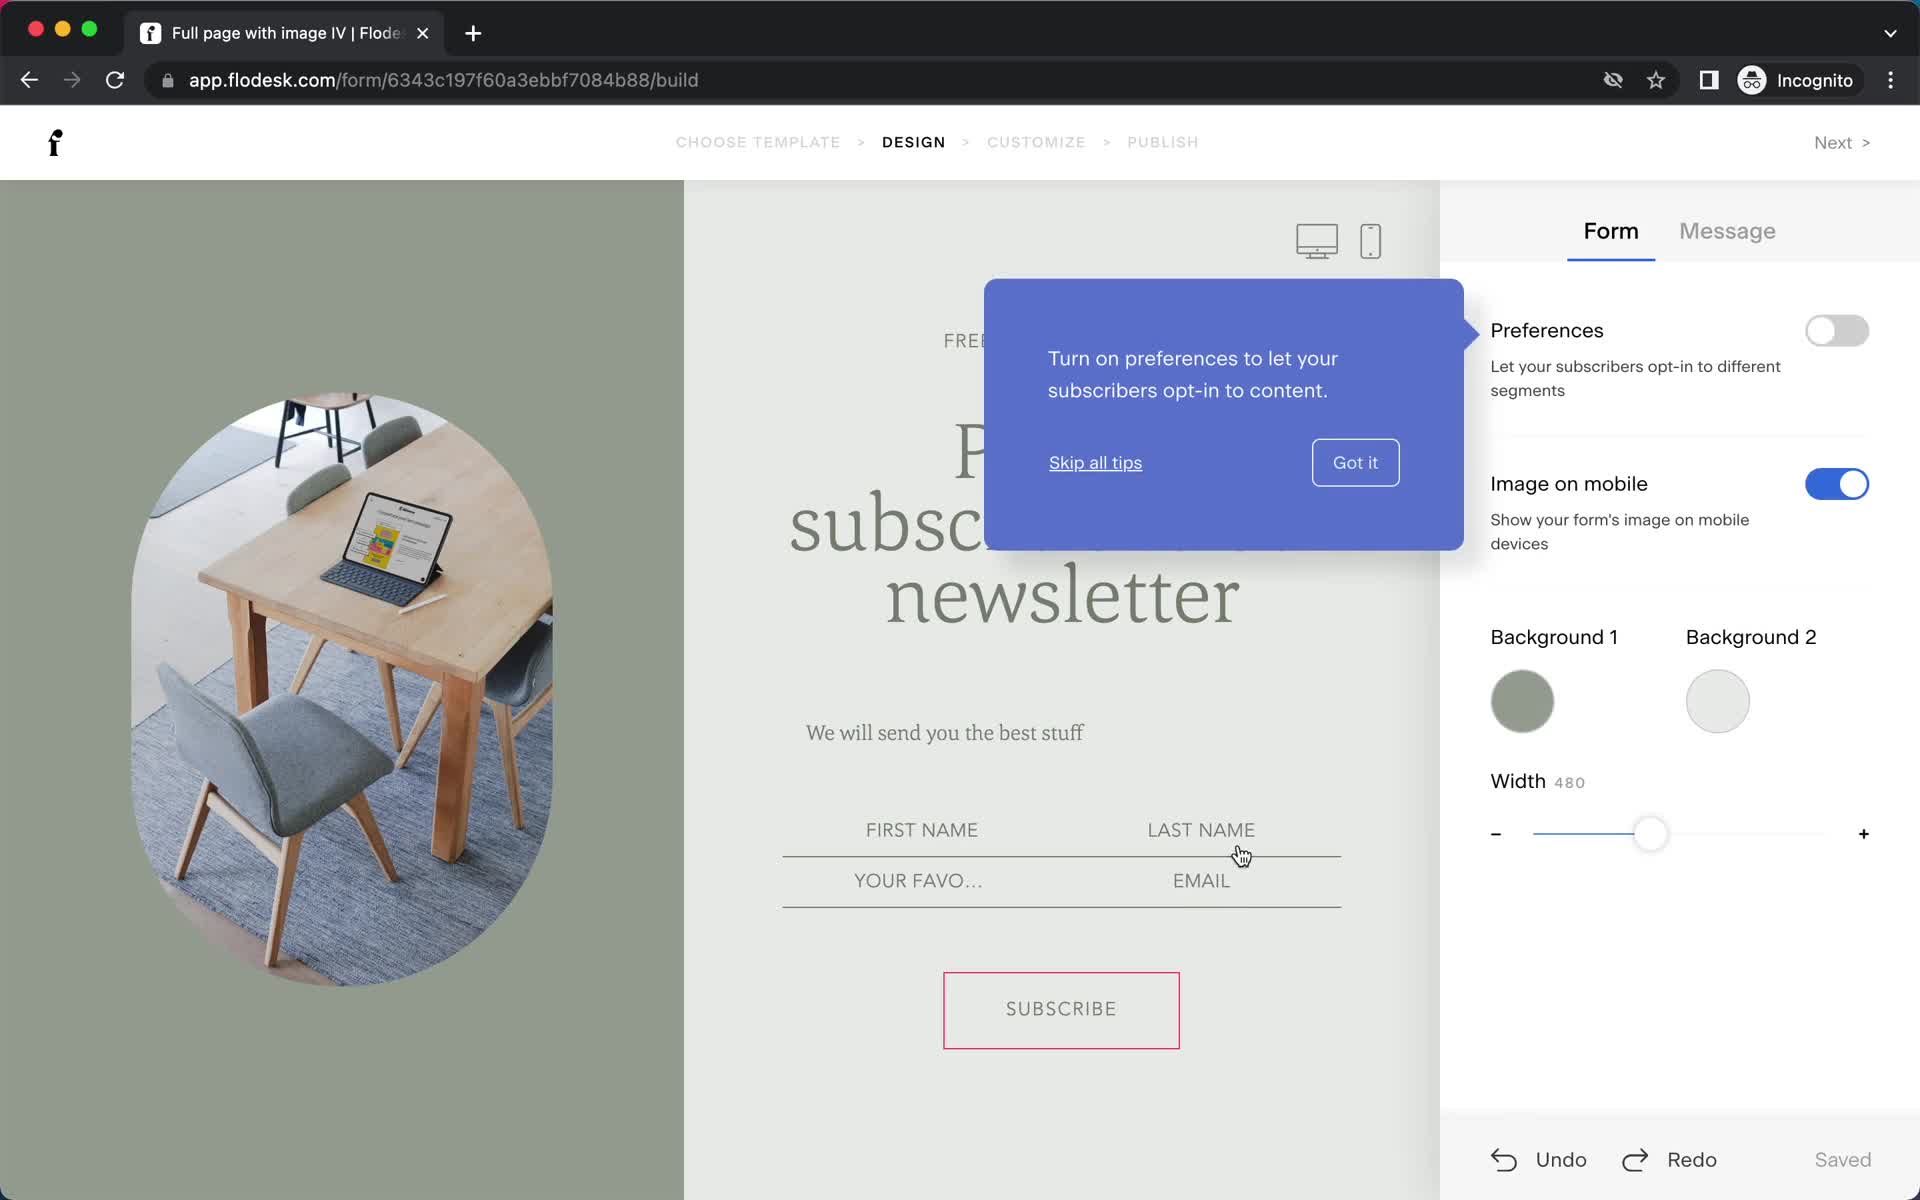
Guide tooltip
this is title
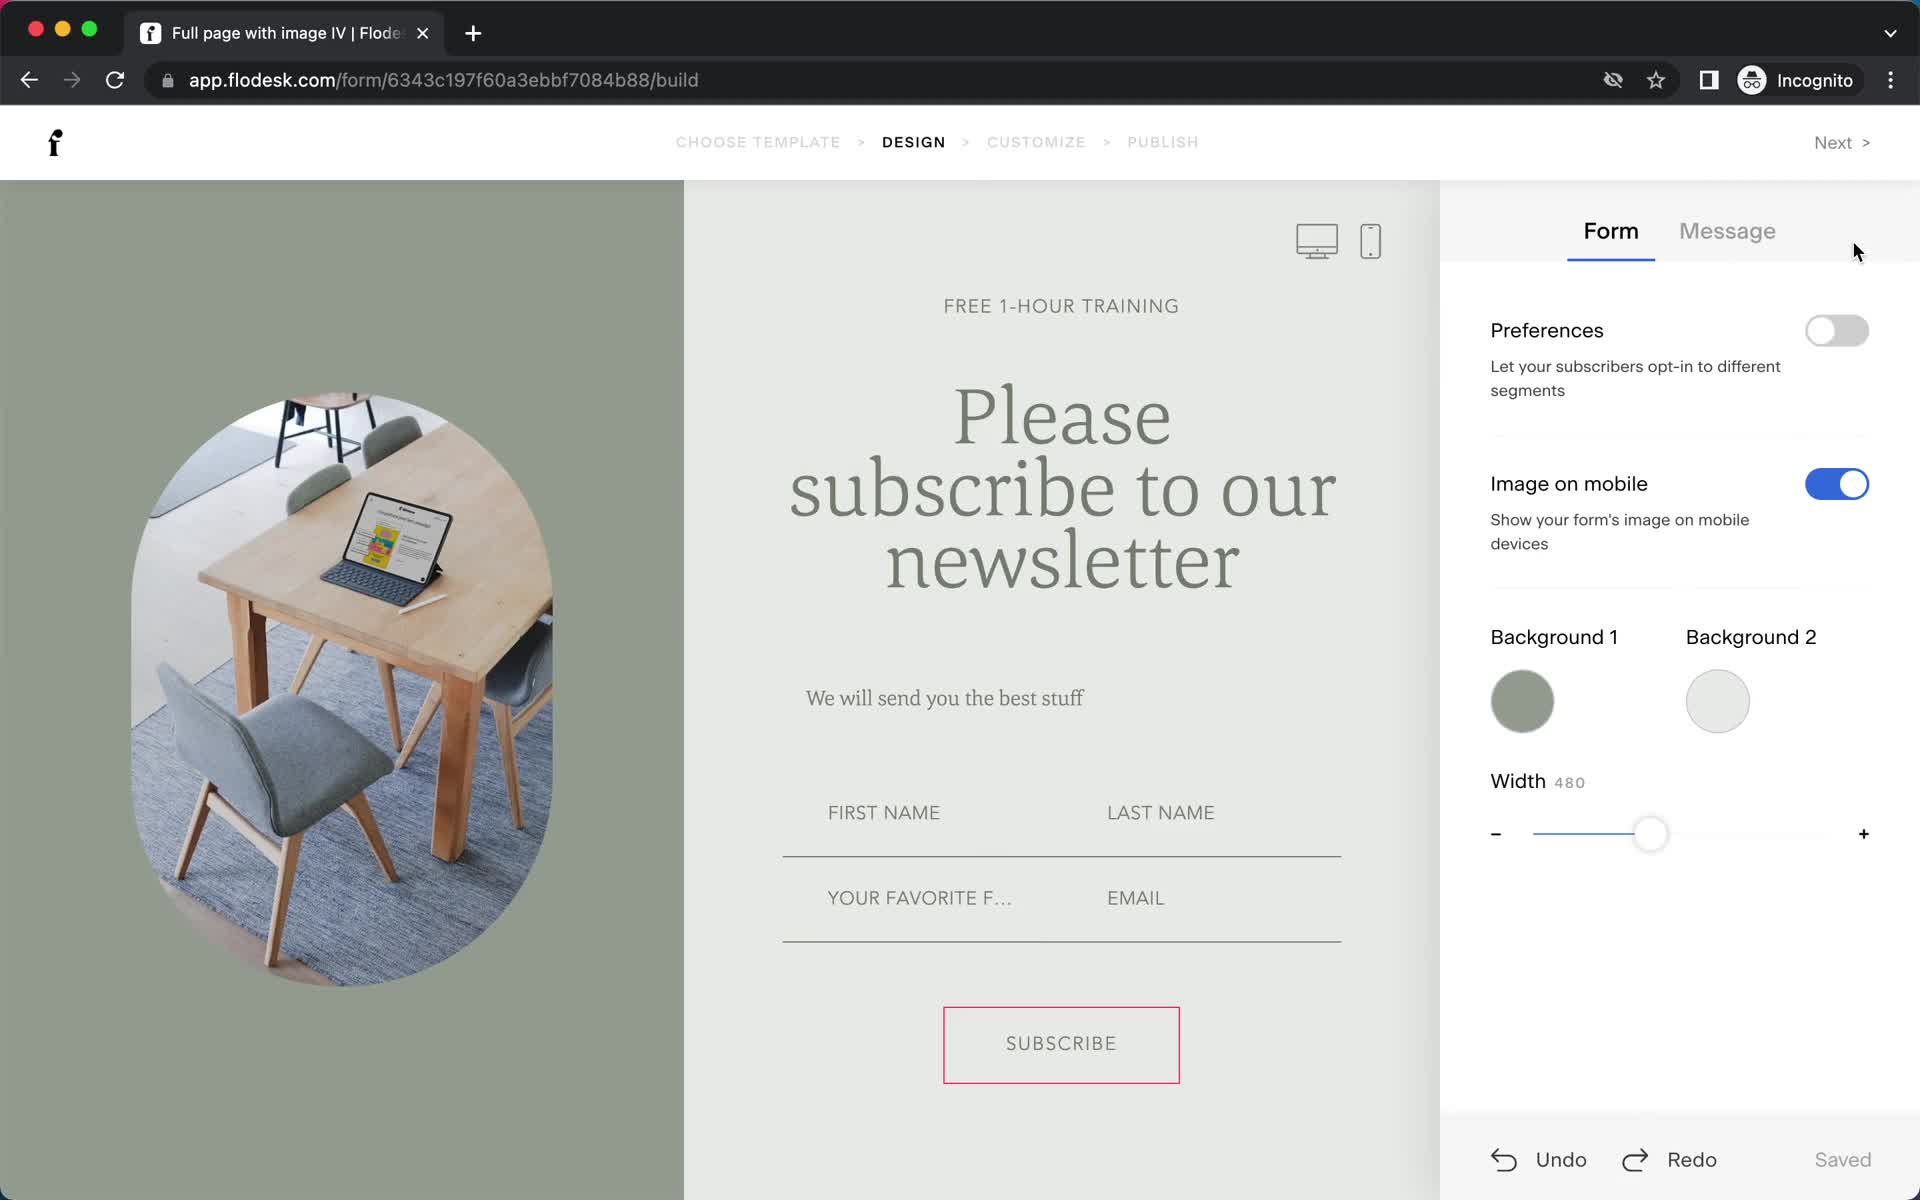
Customize appearance
this is title
Form builder
this is title
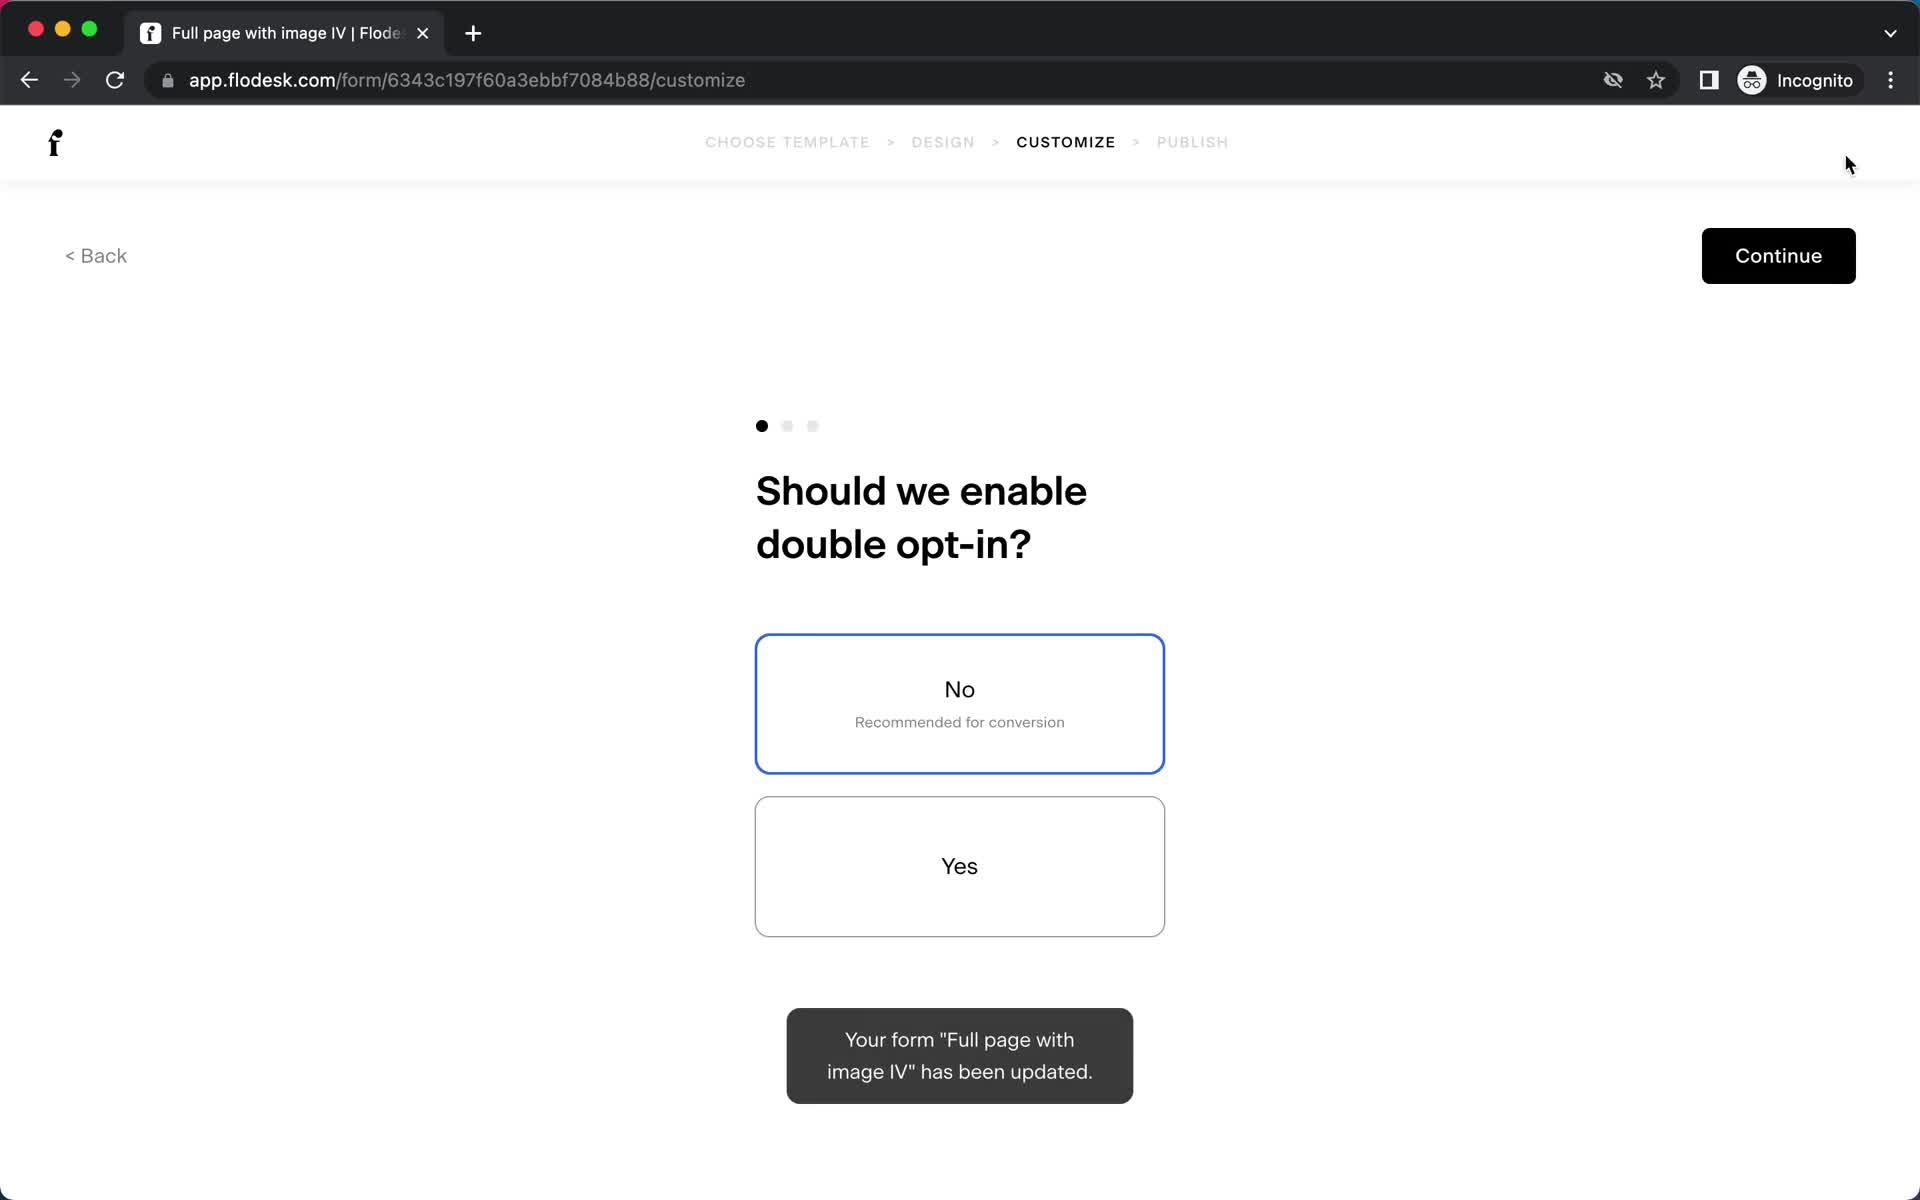
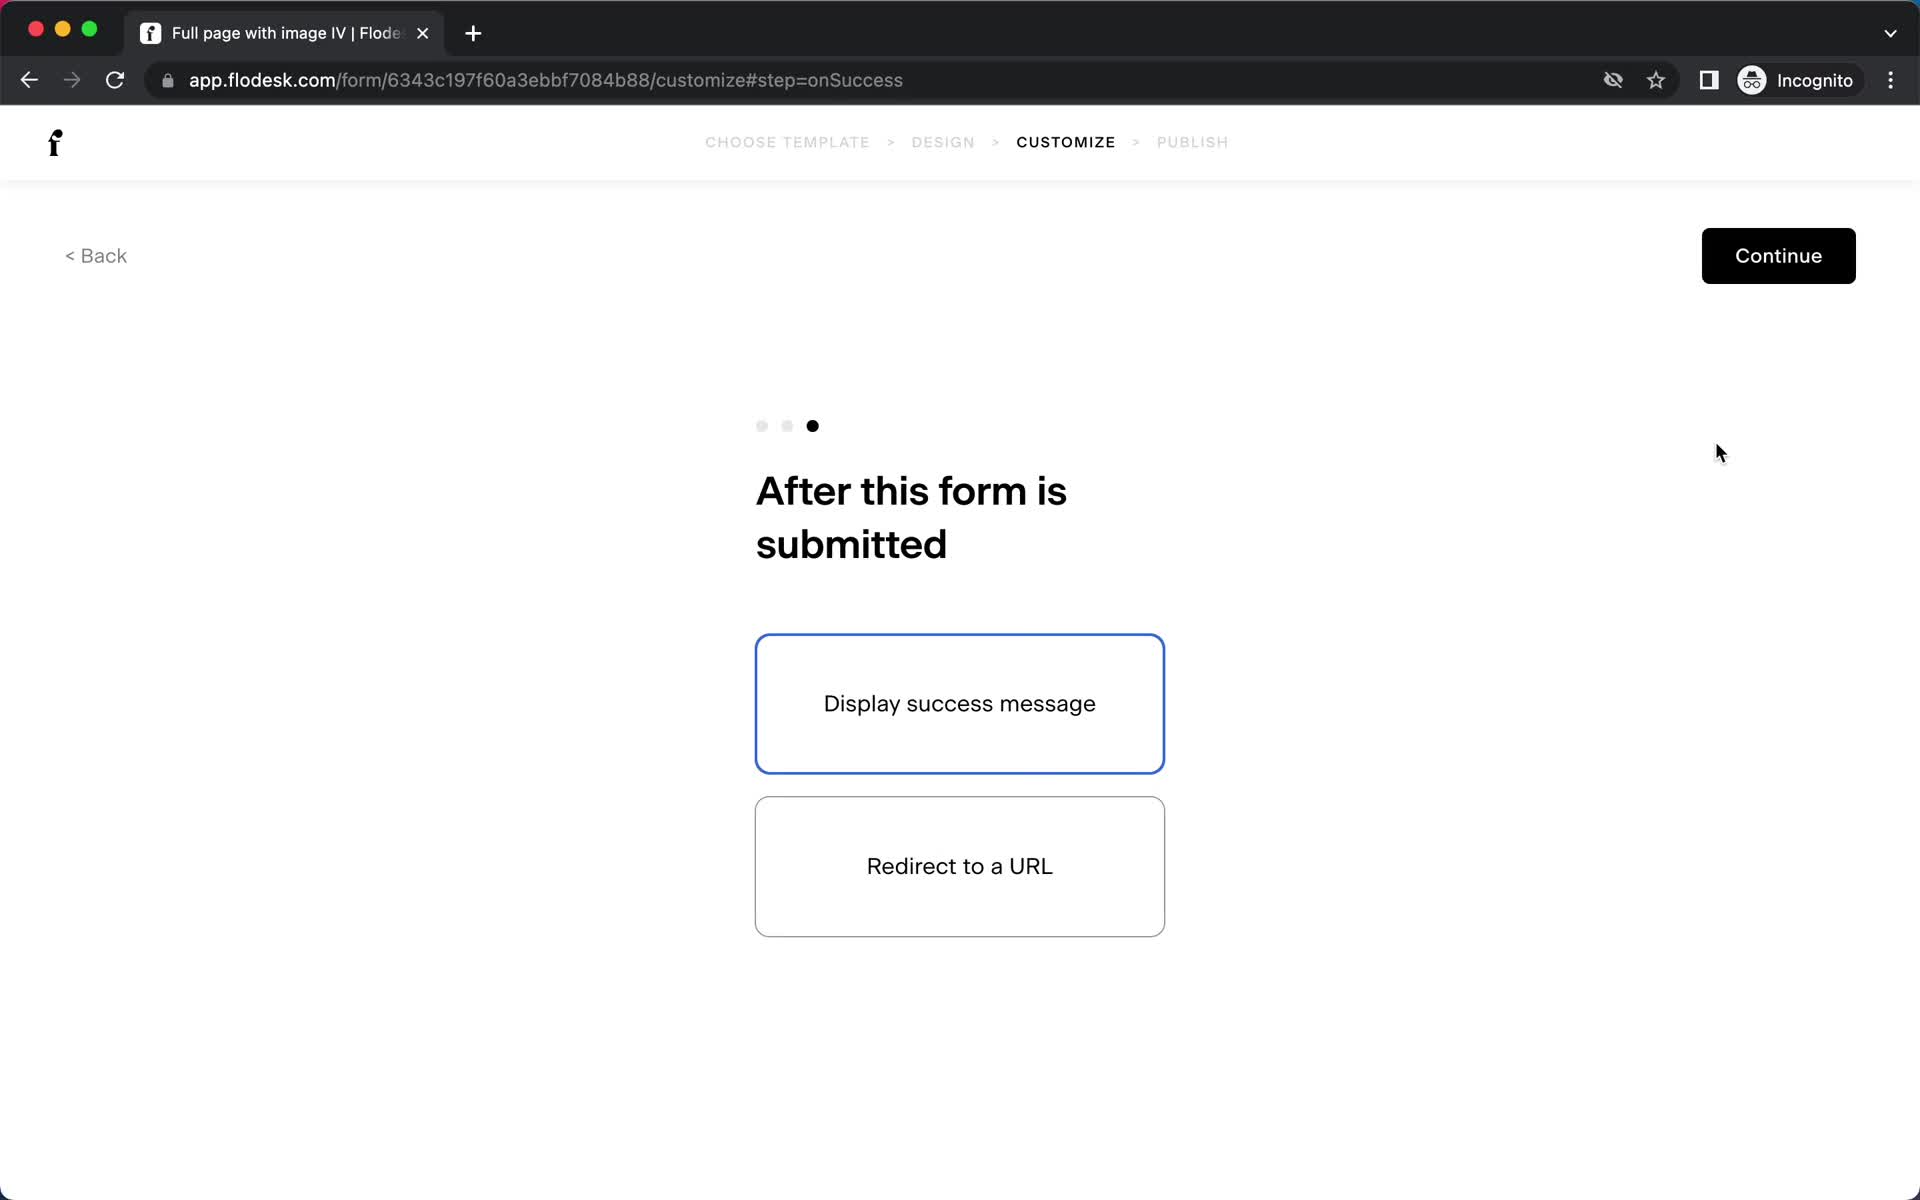
Set preferences
this is title
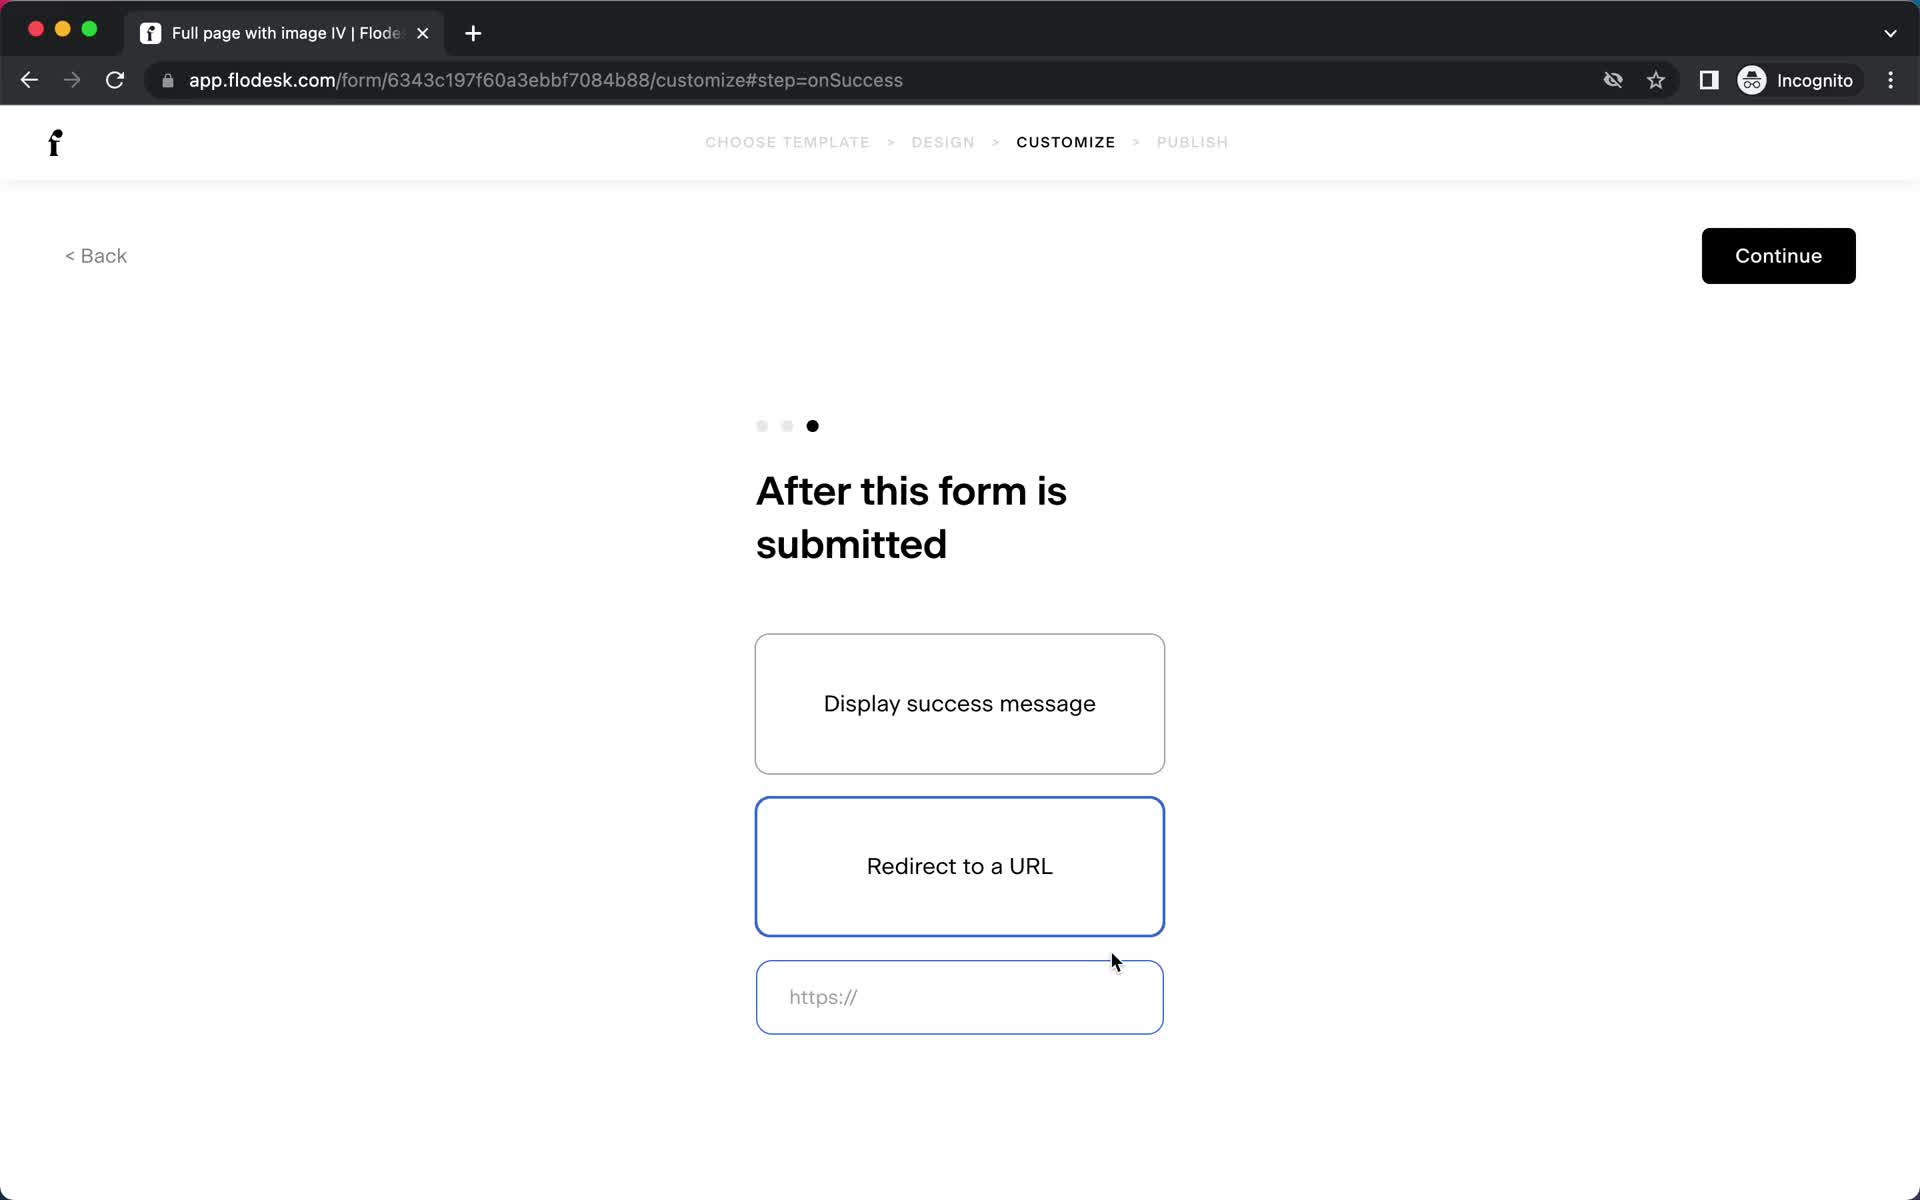
Set preferences
this is title
Set preferences
this is title
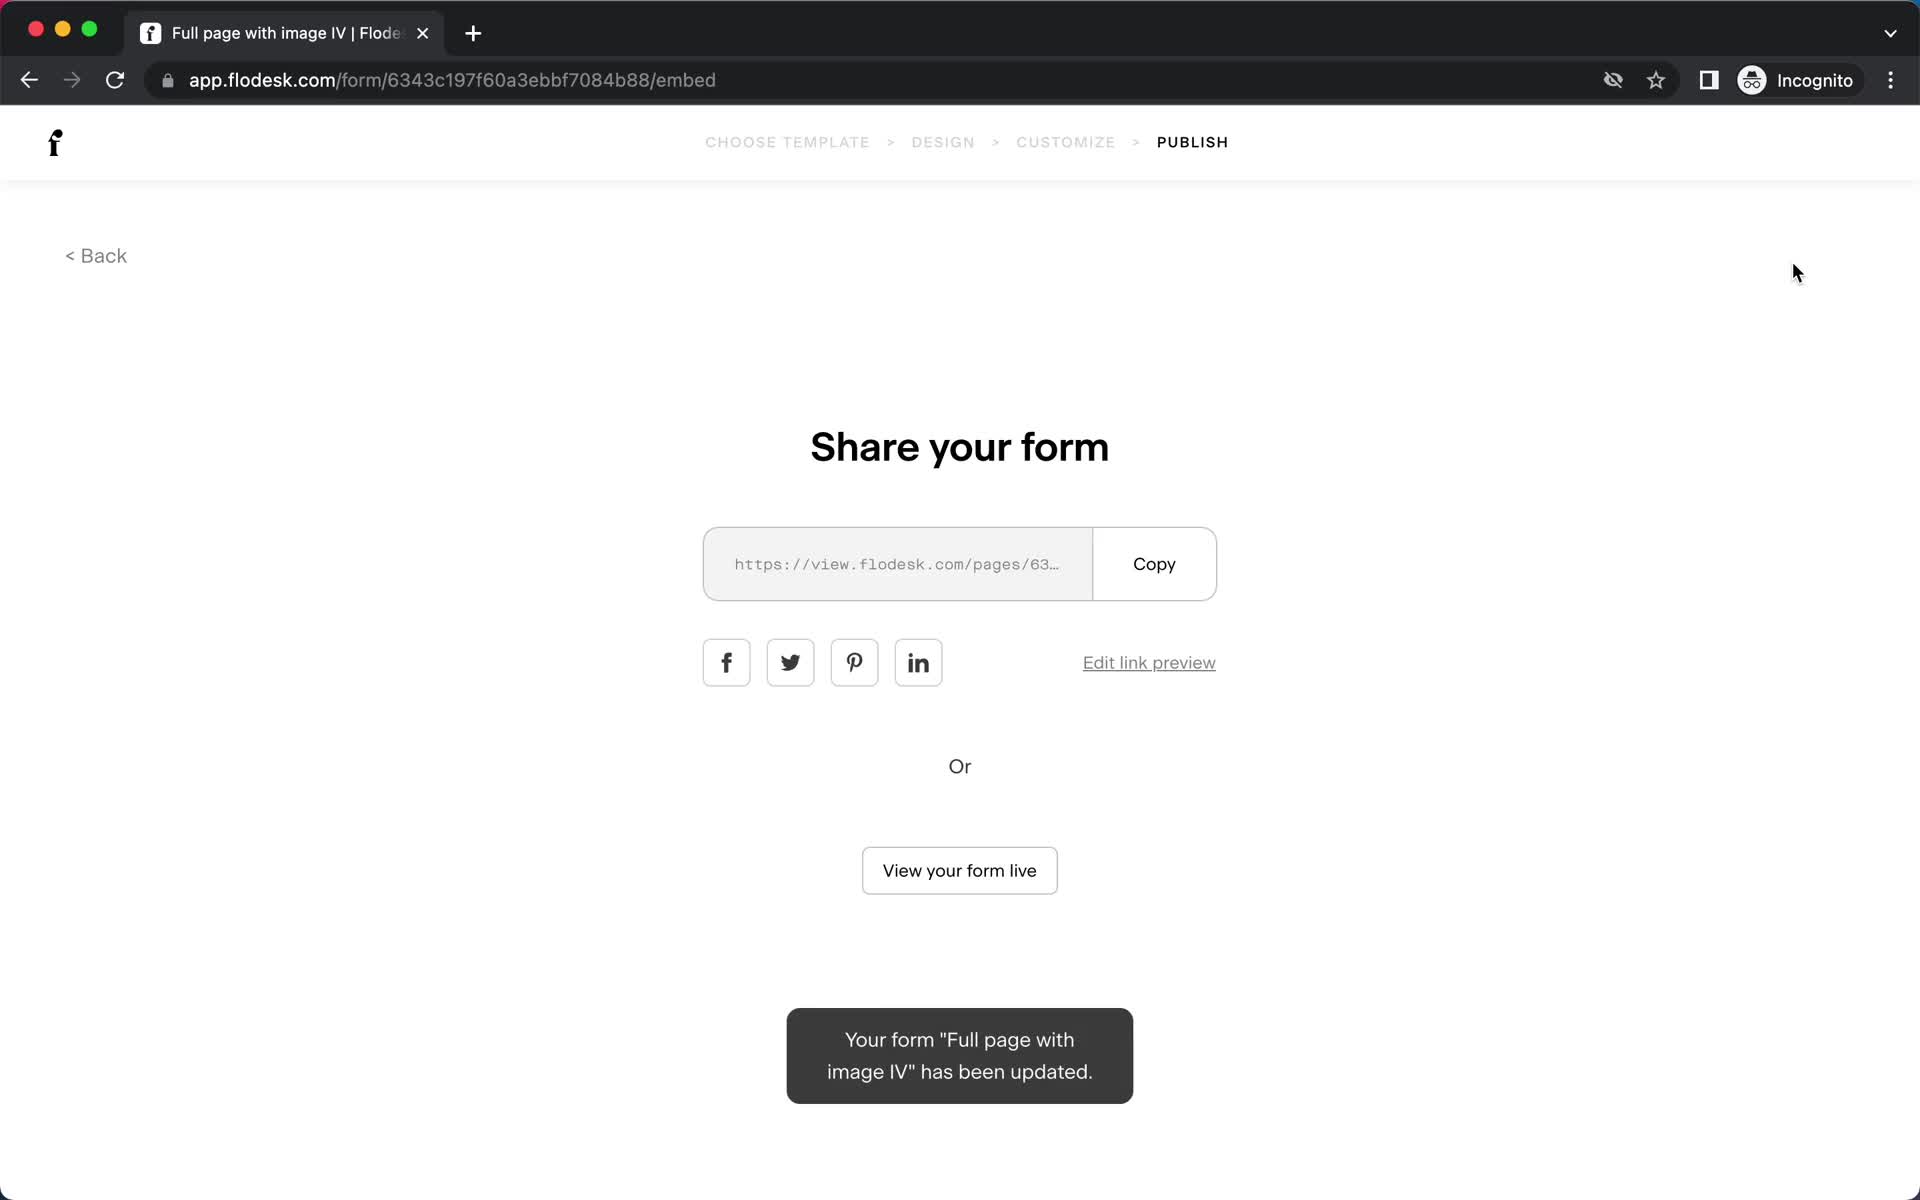
Share
this is title
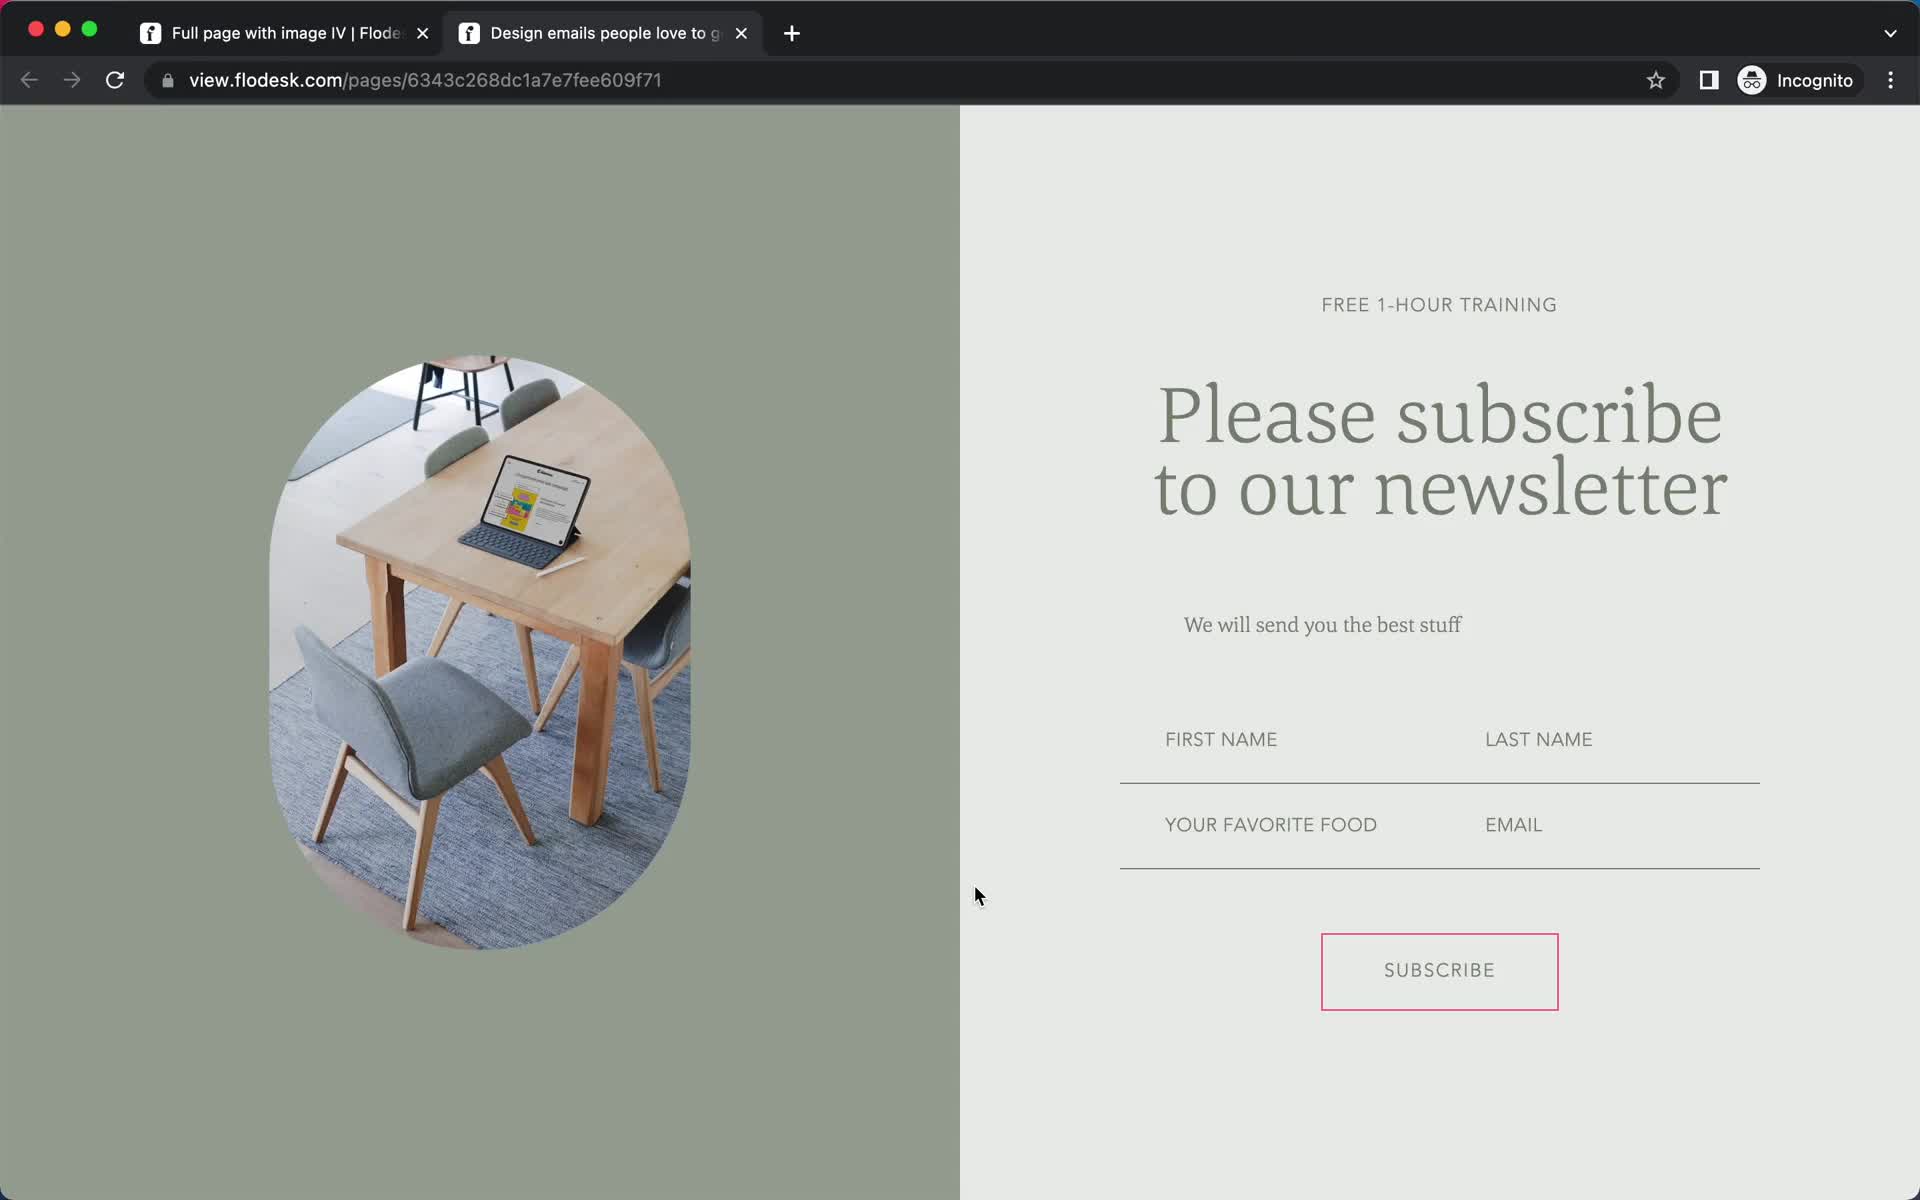
Form
this is title
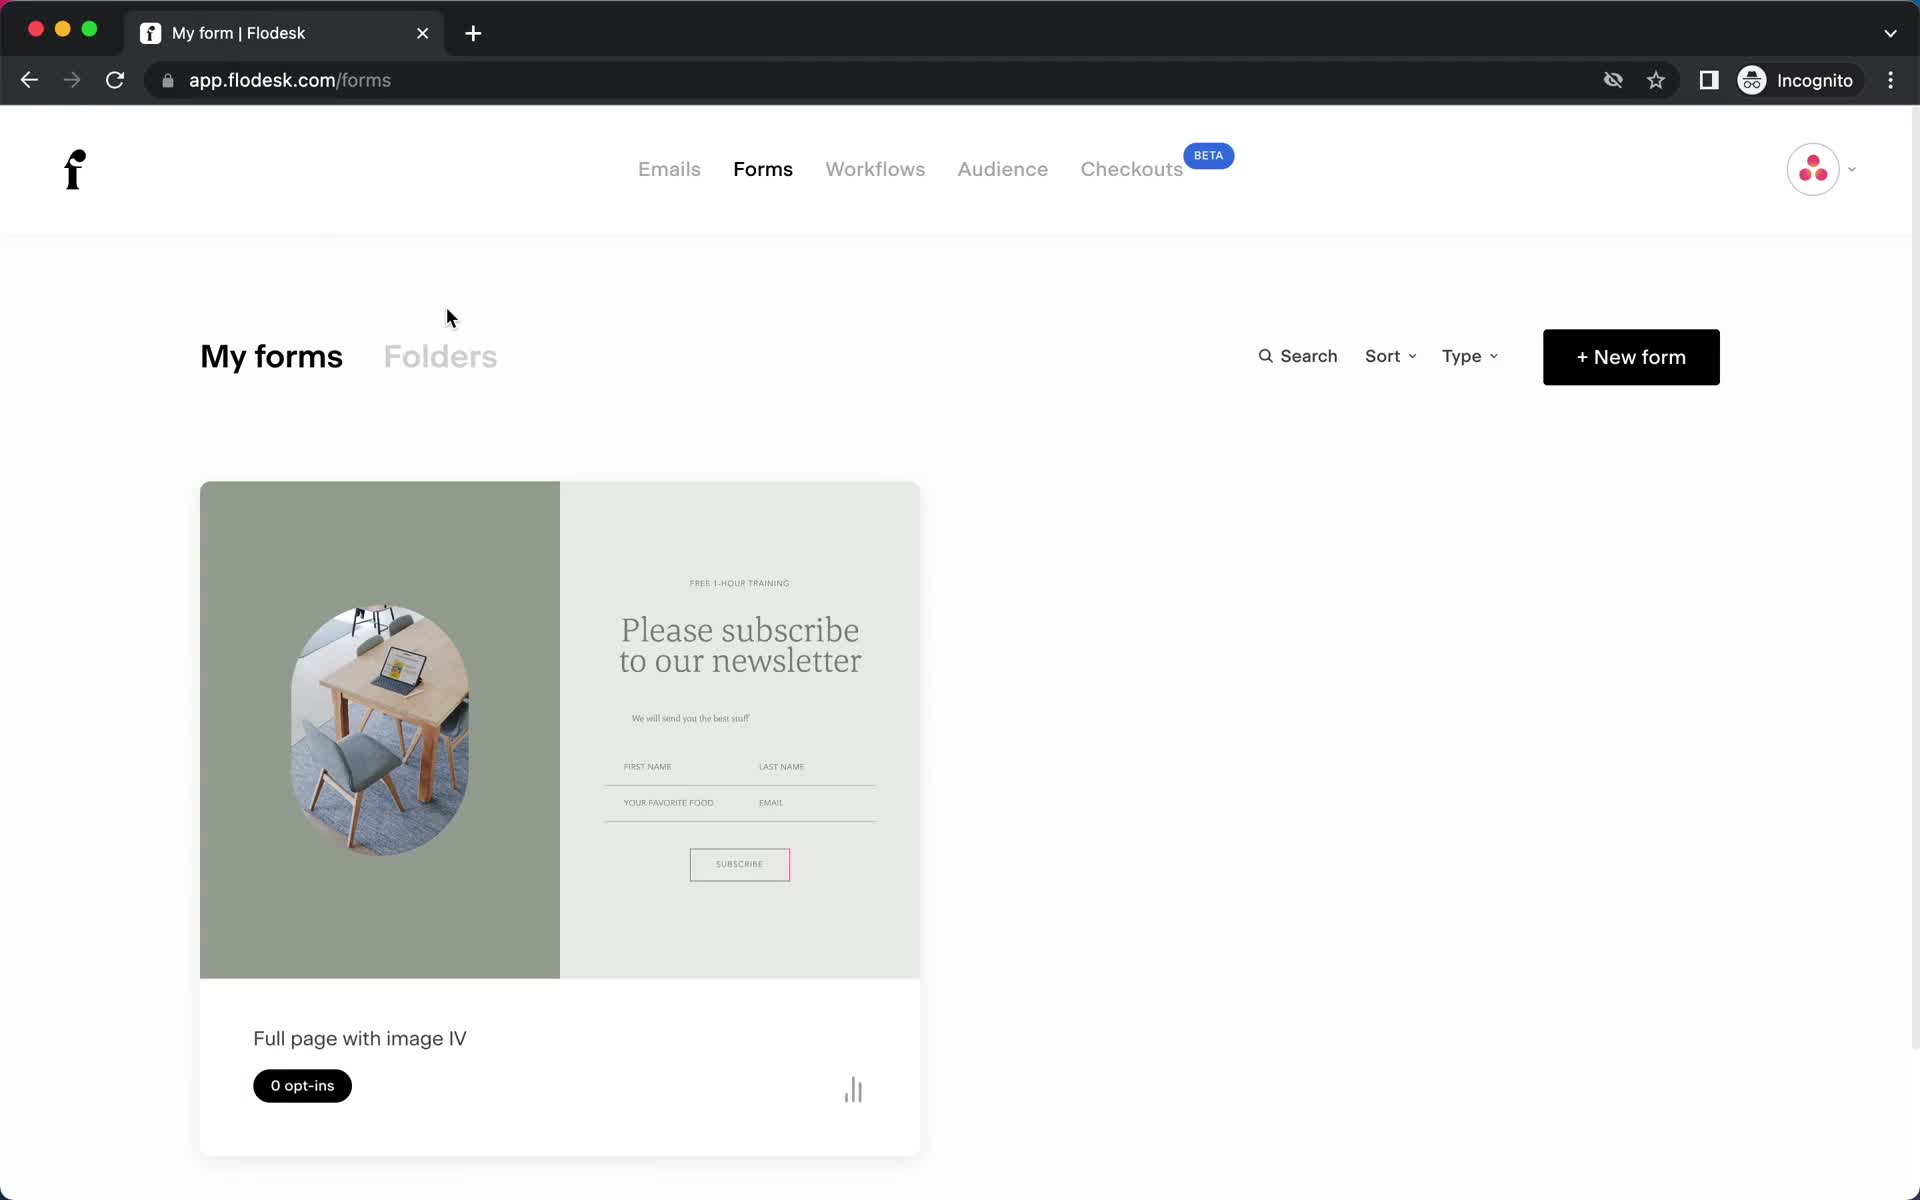
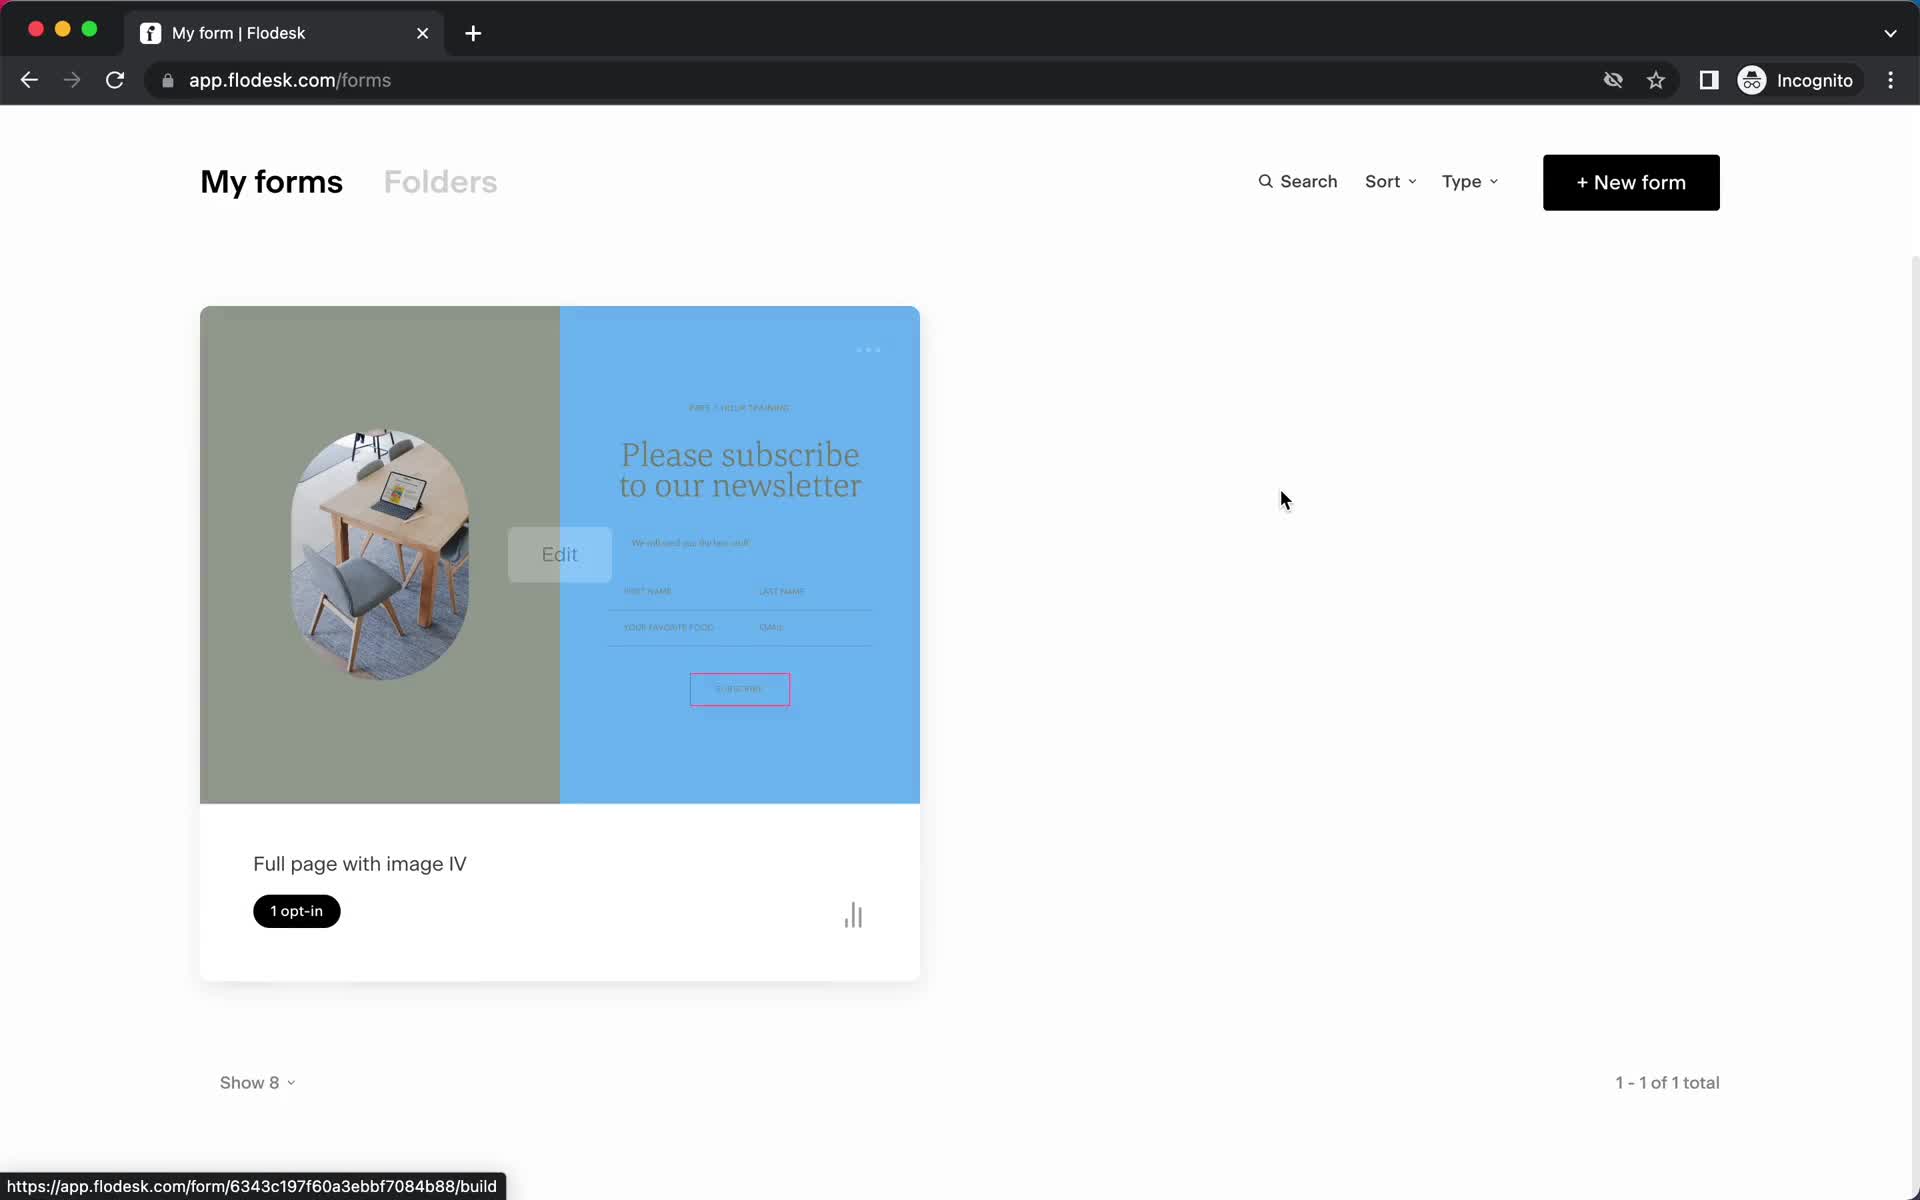
Forms
this is title
Email campaigns
this is title
Workflows
this is title
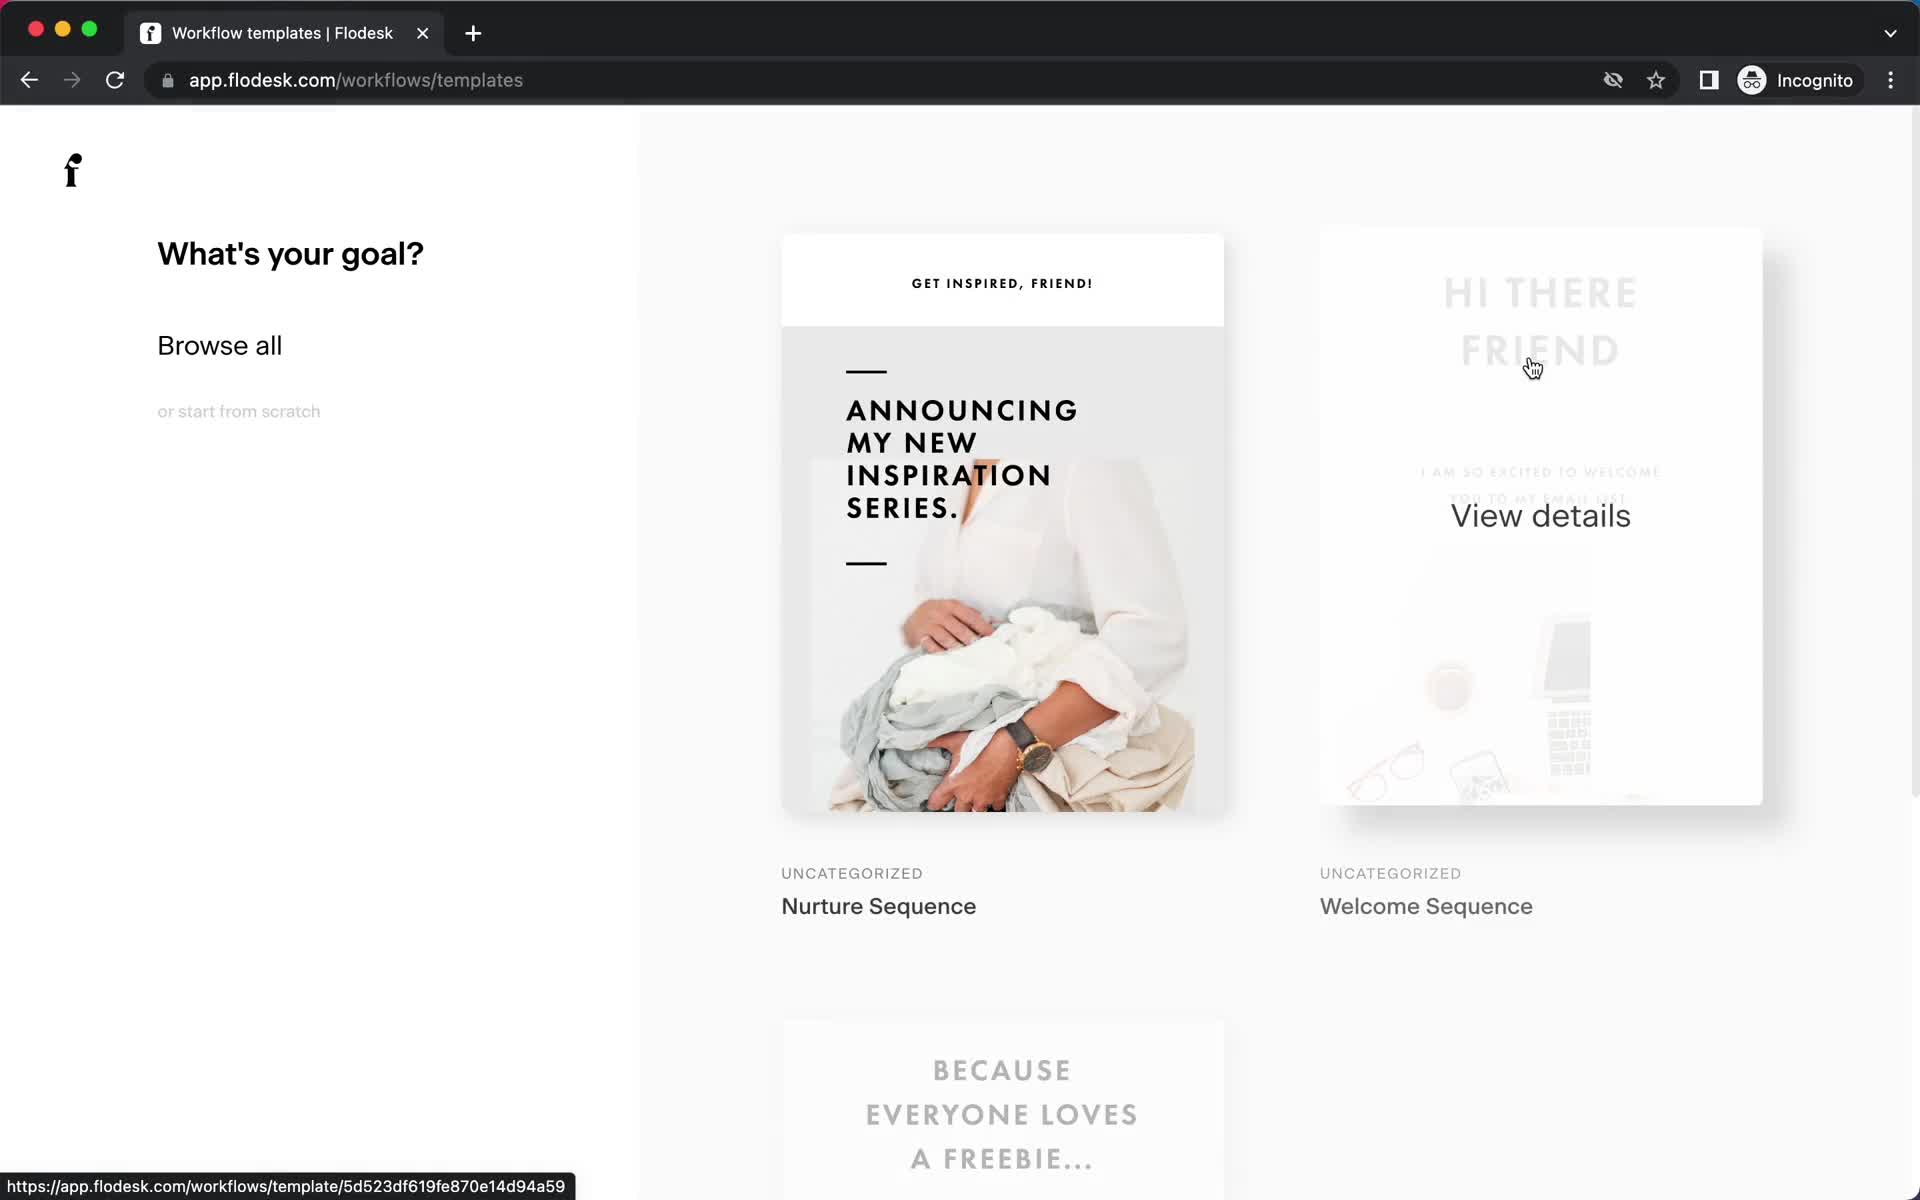
Select goal
this is title
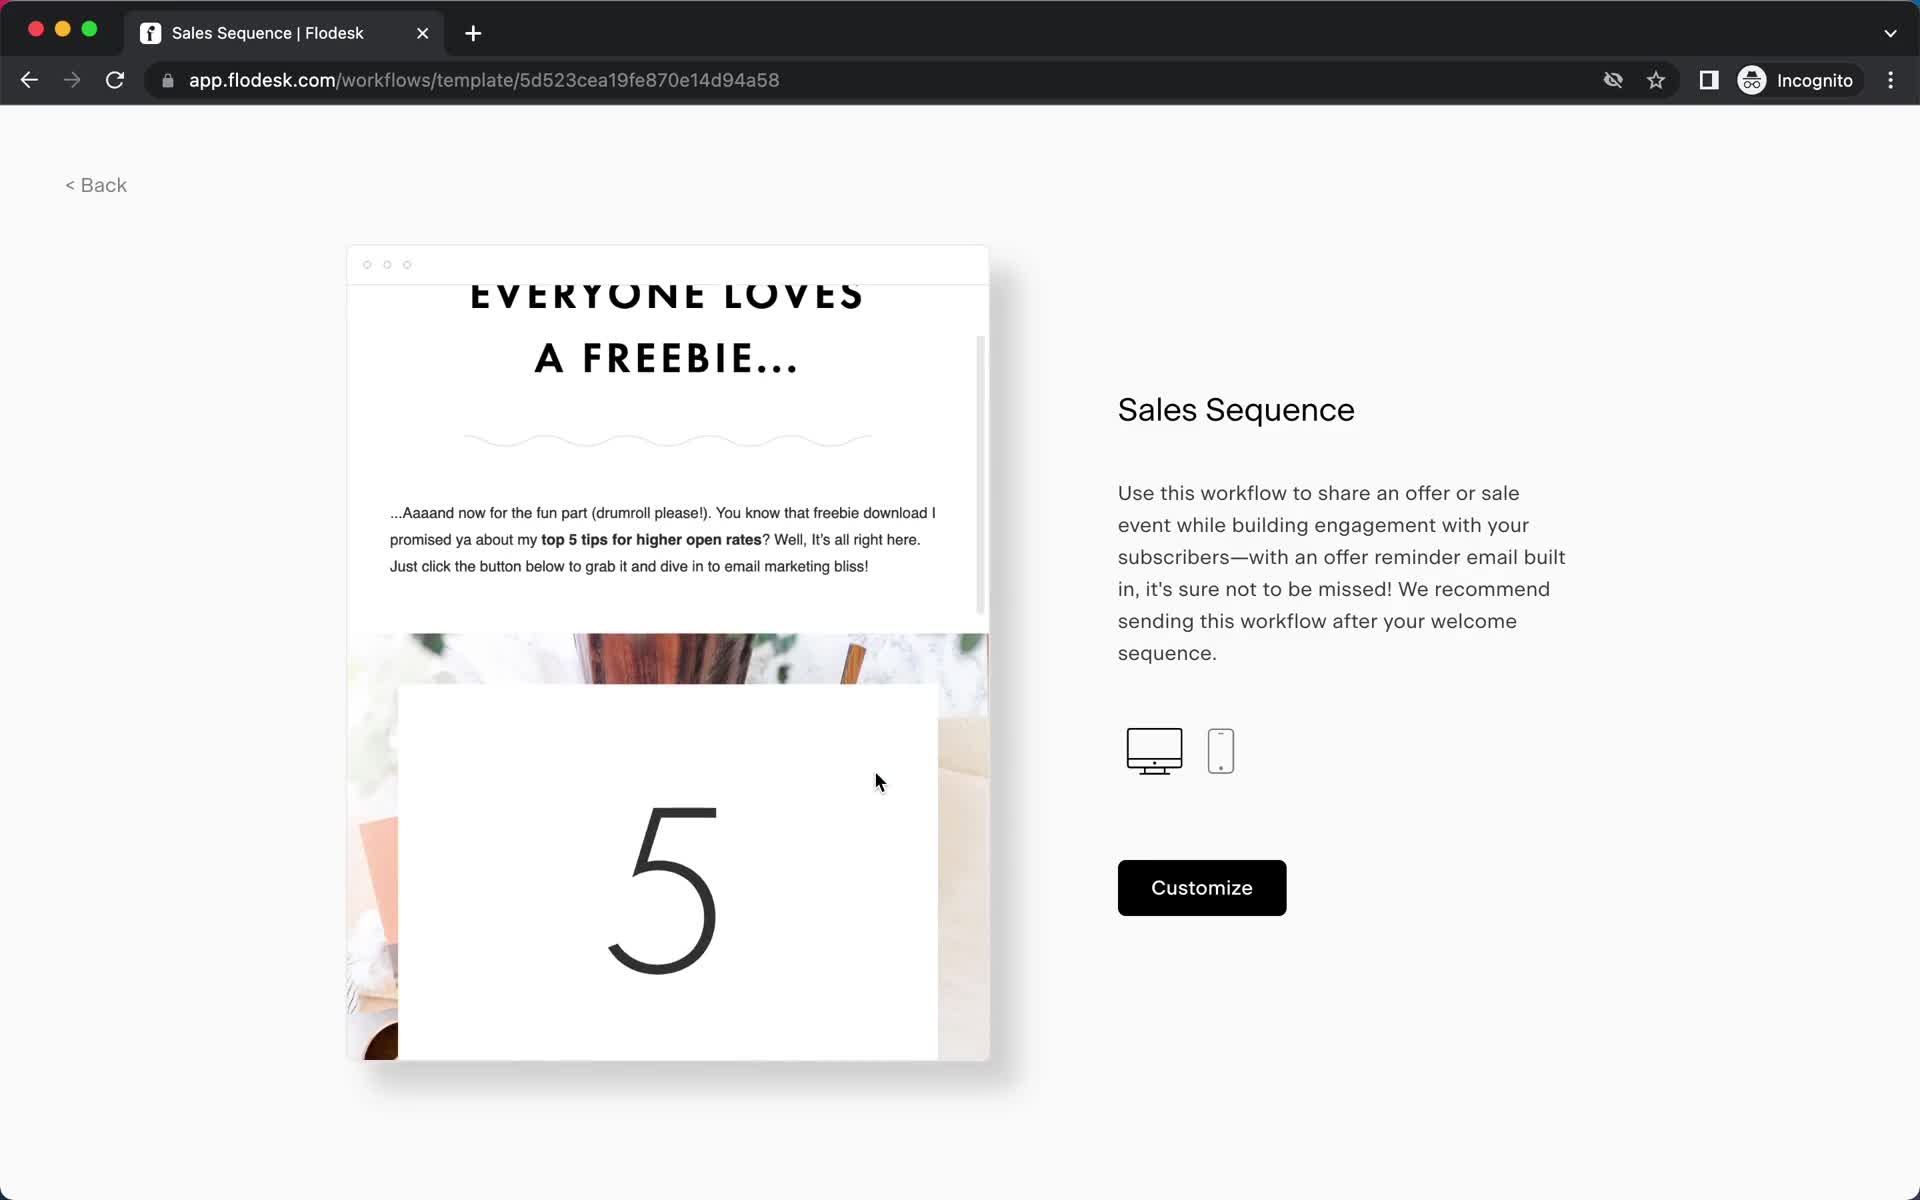
Template preview
this is title
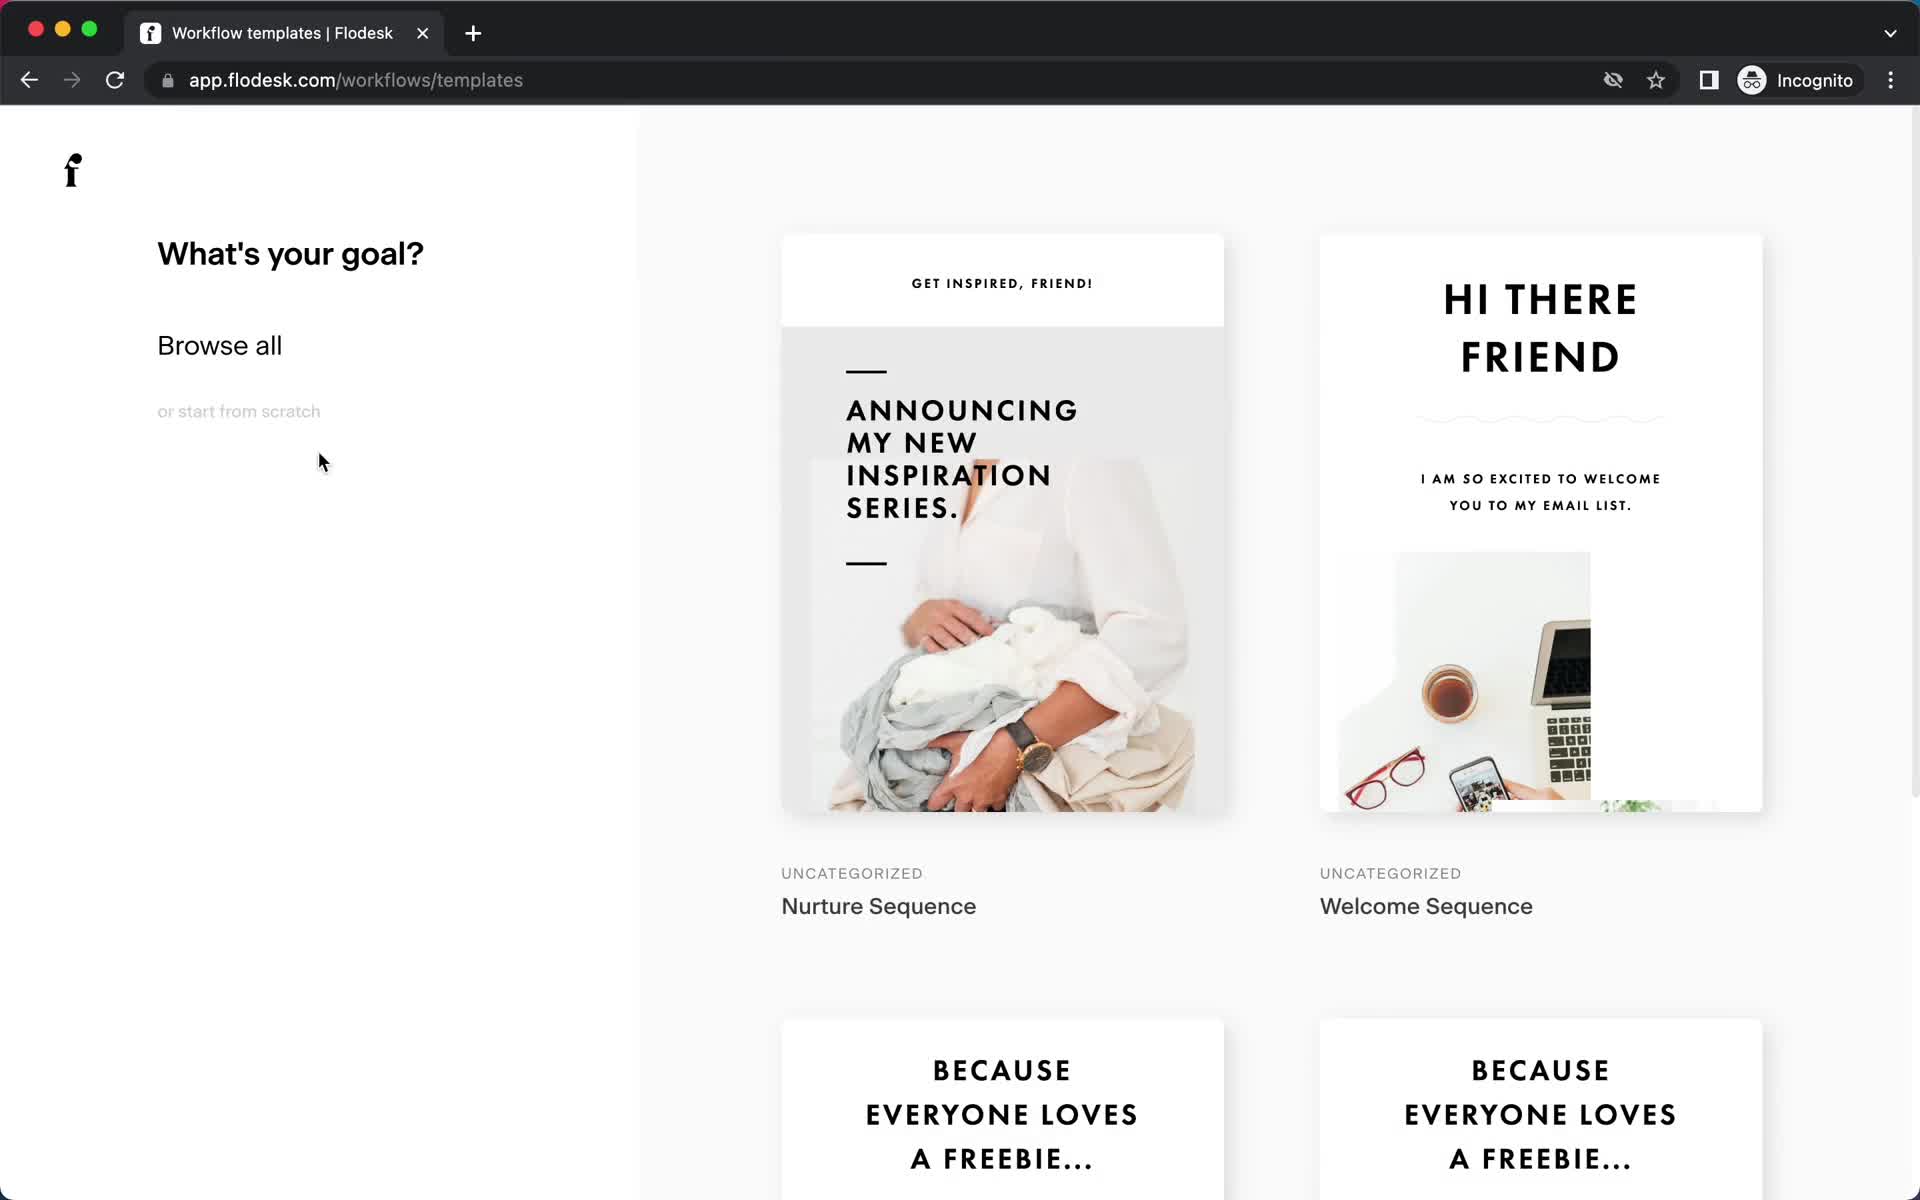
Templates
this is title
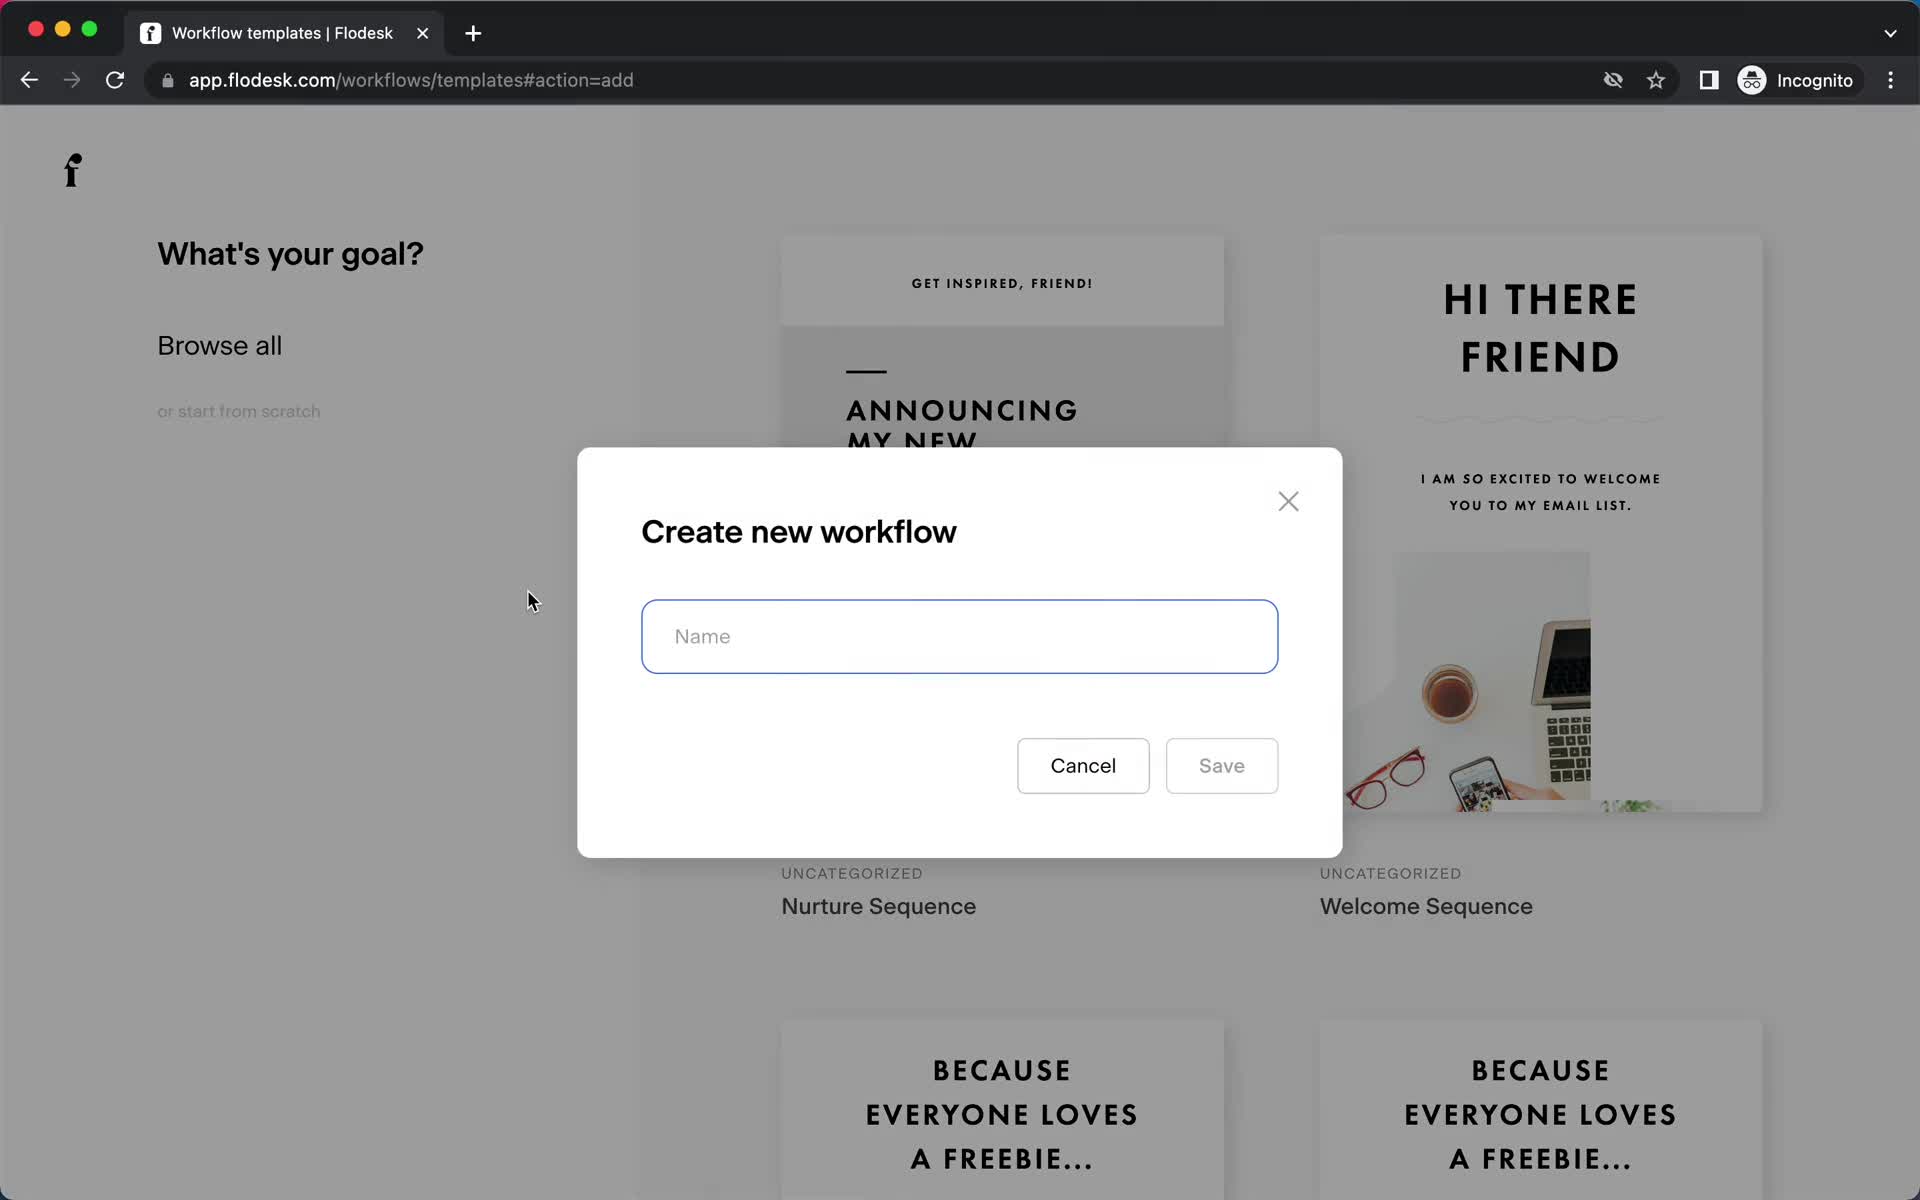
Create workflow
this is title
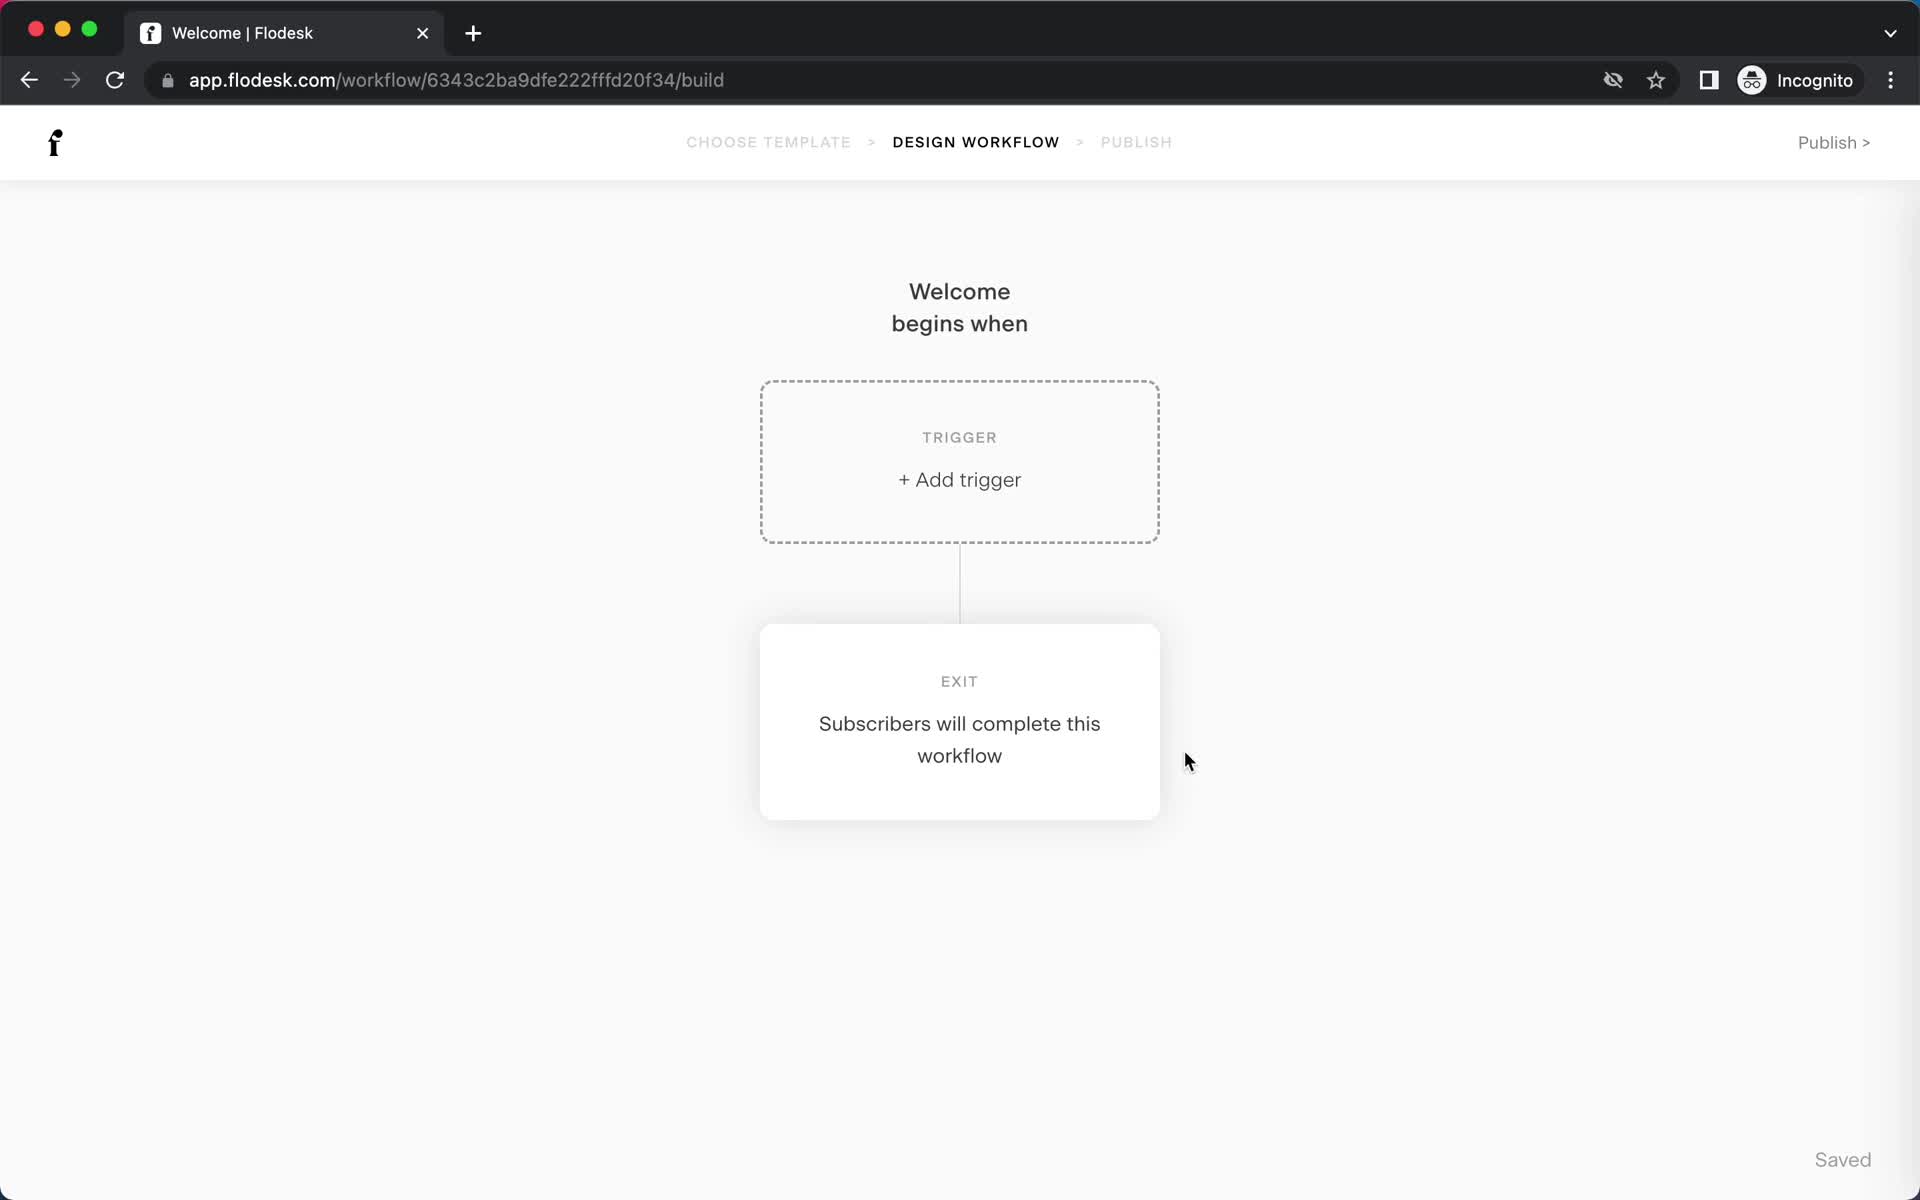
Workflow builder
this is title
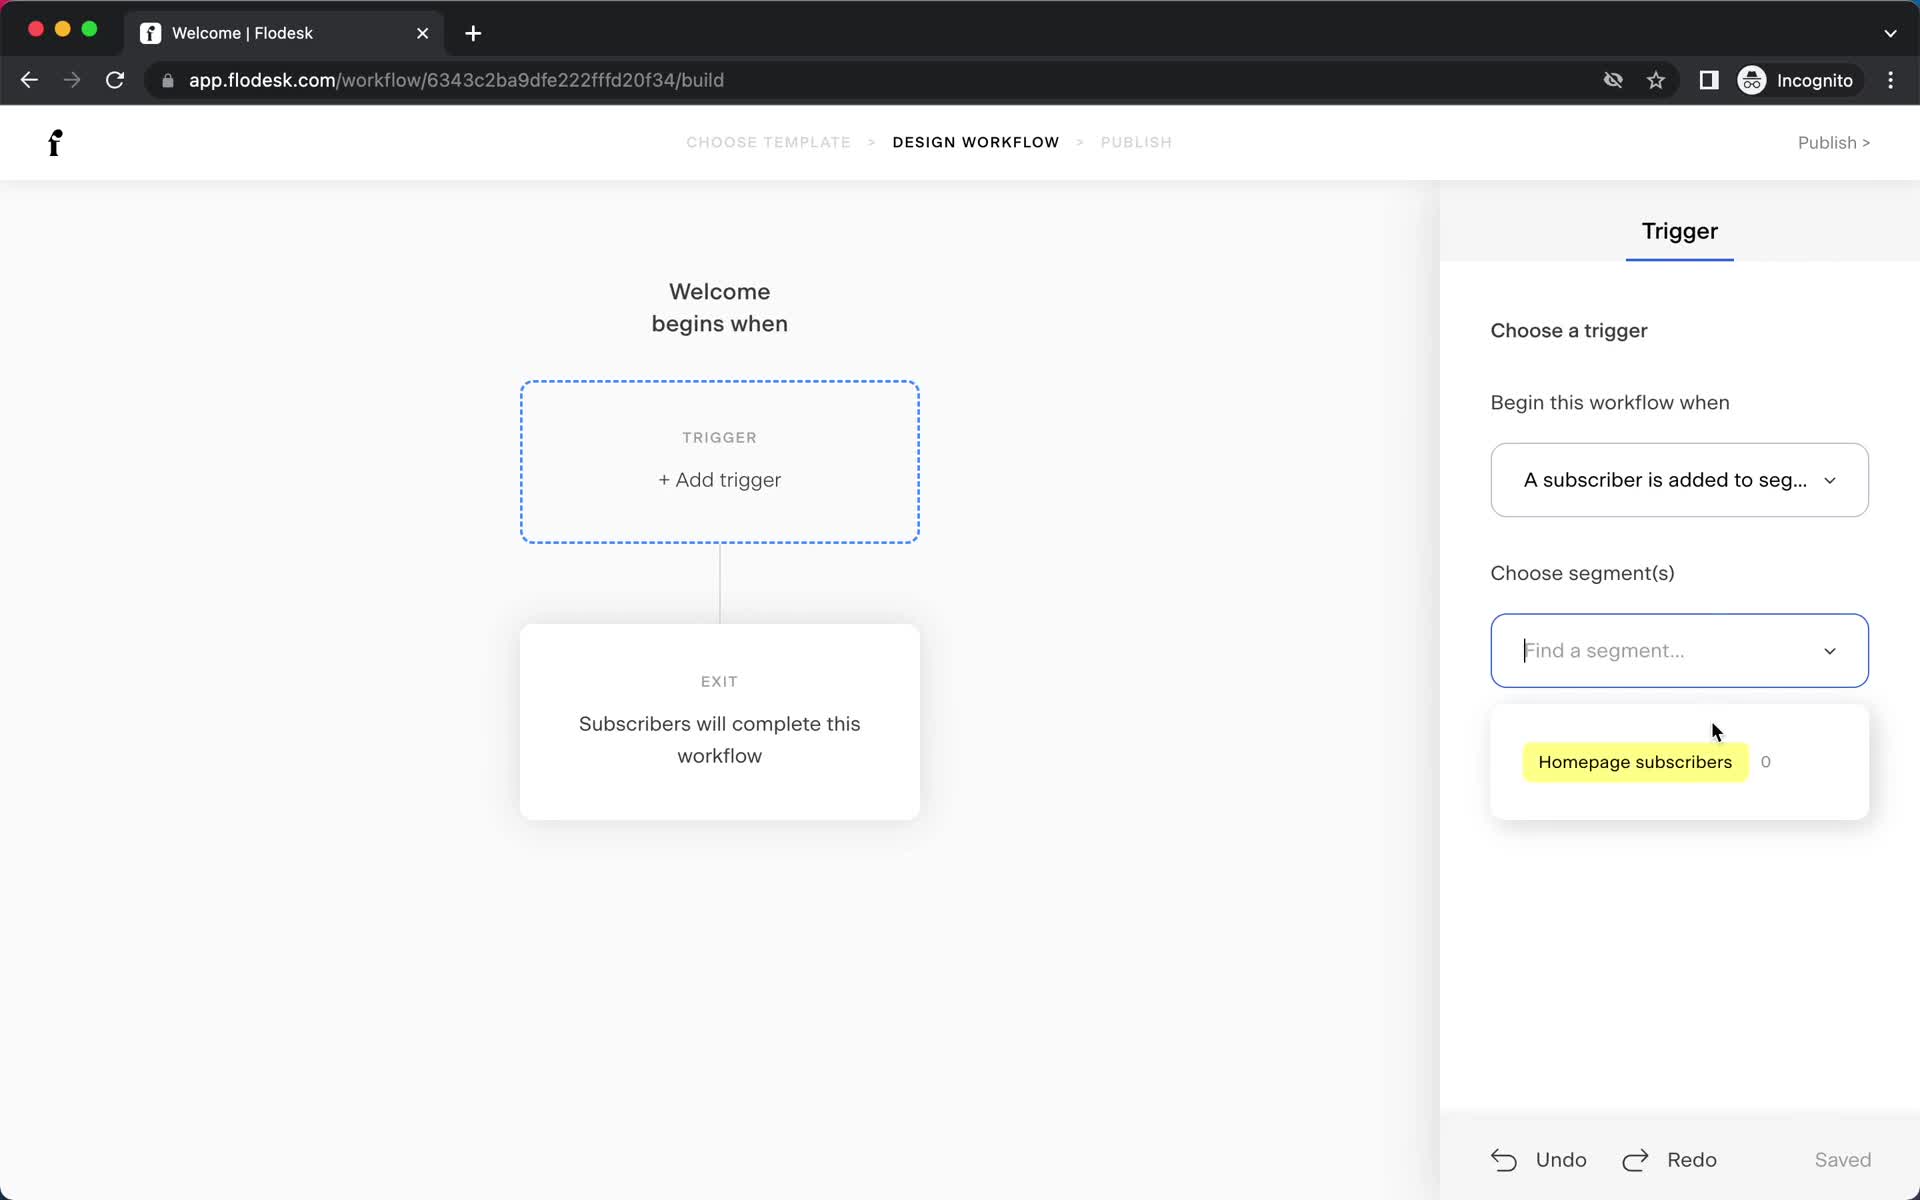
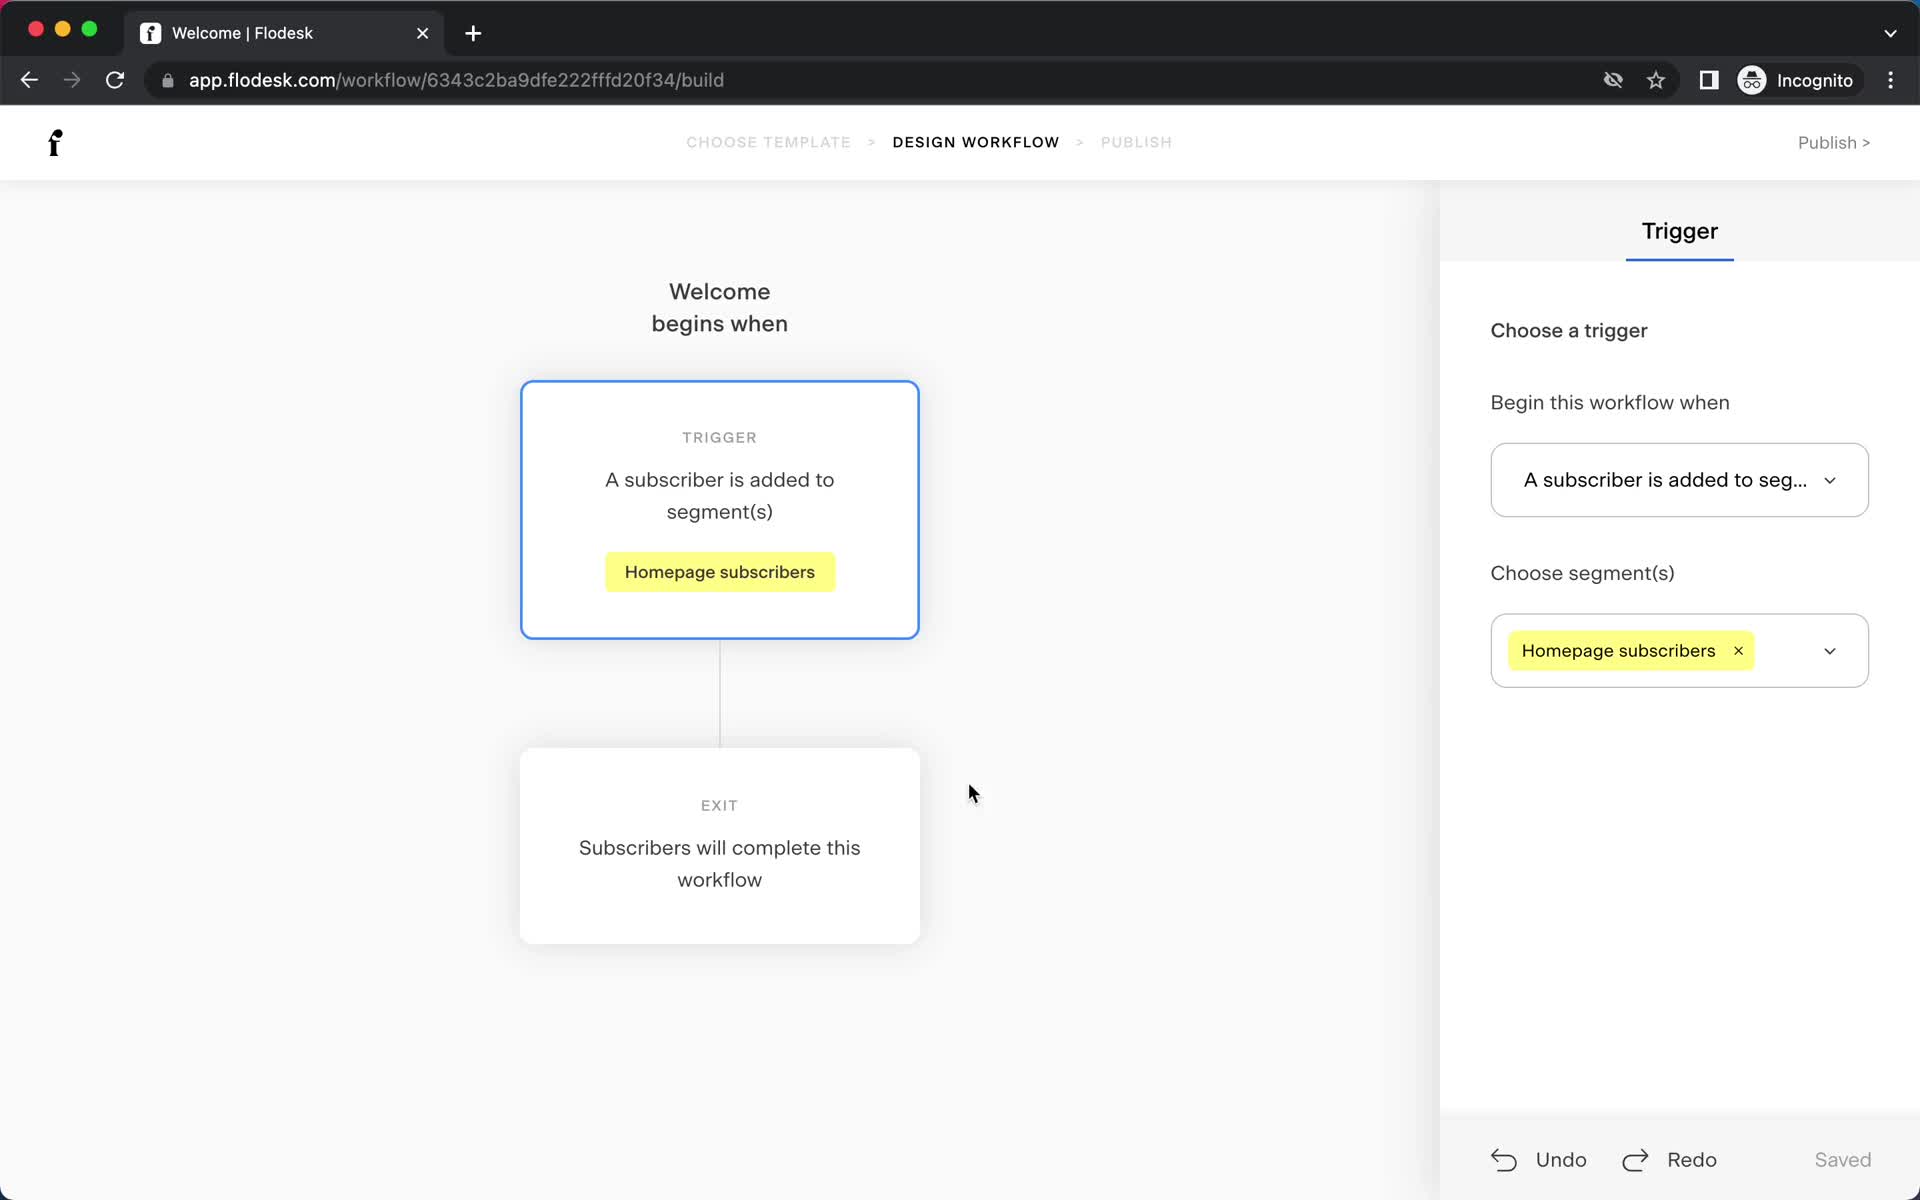
Set trigger
this is title
Set trigger
this is title
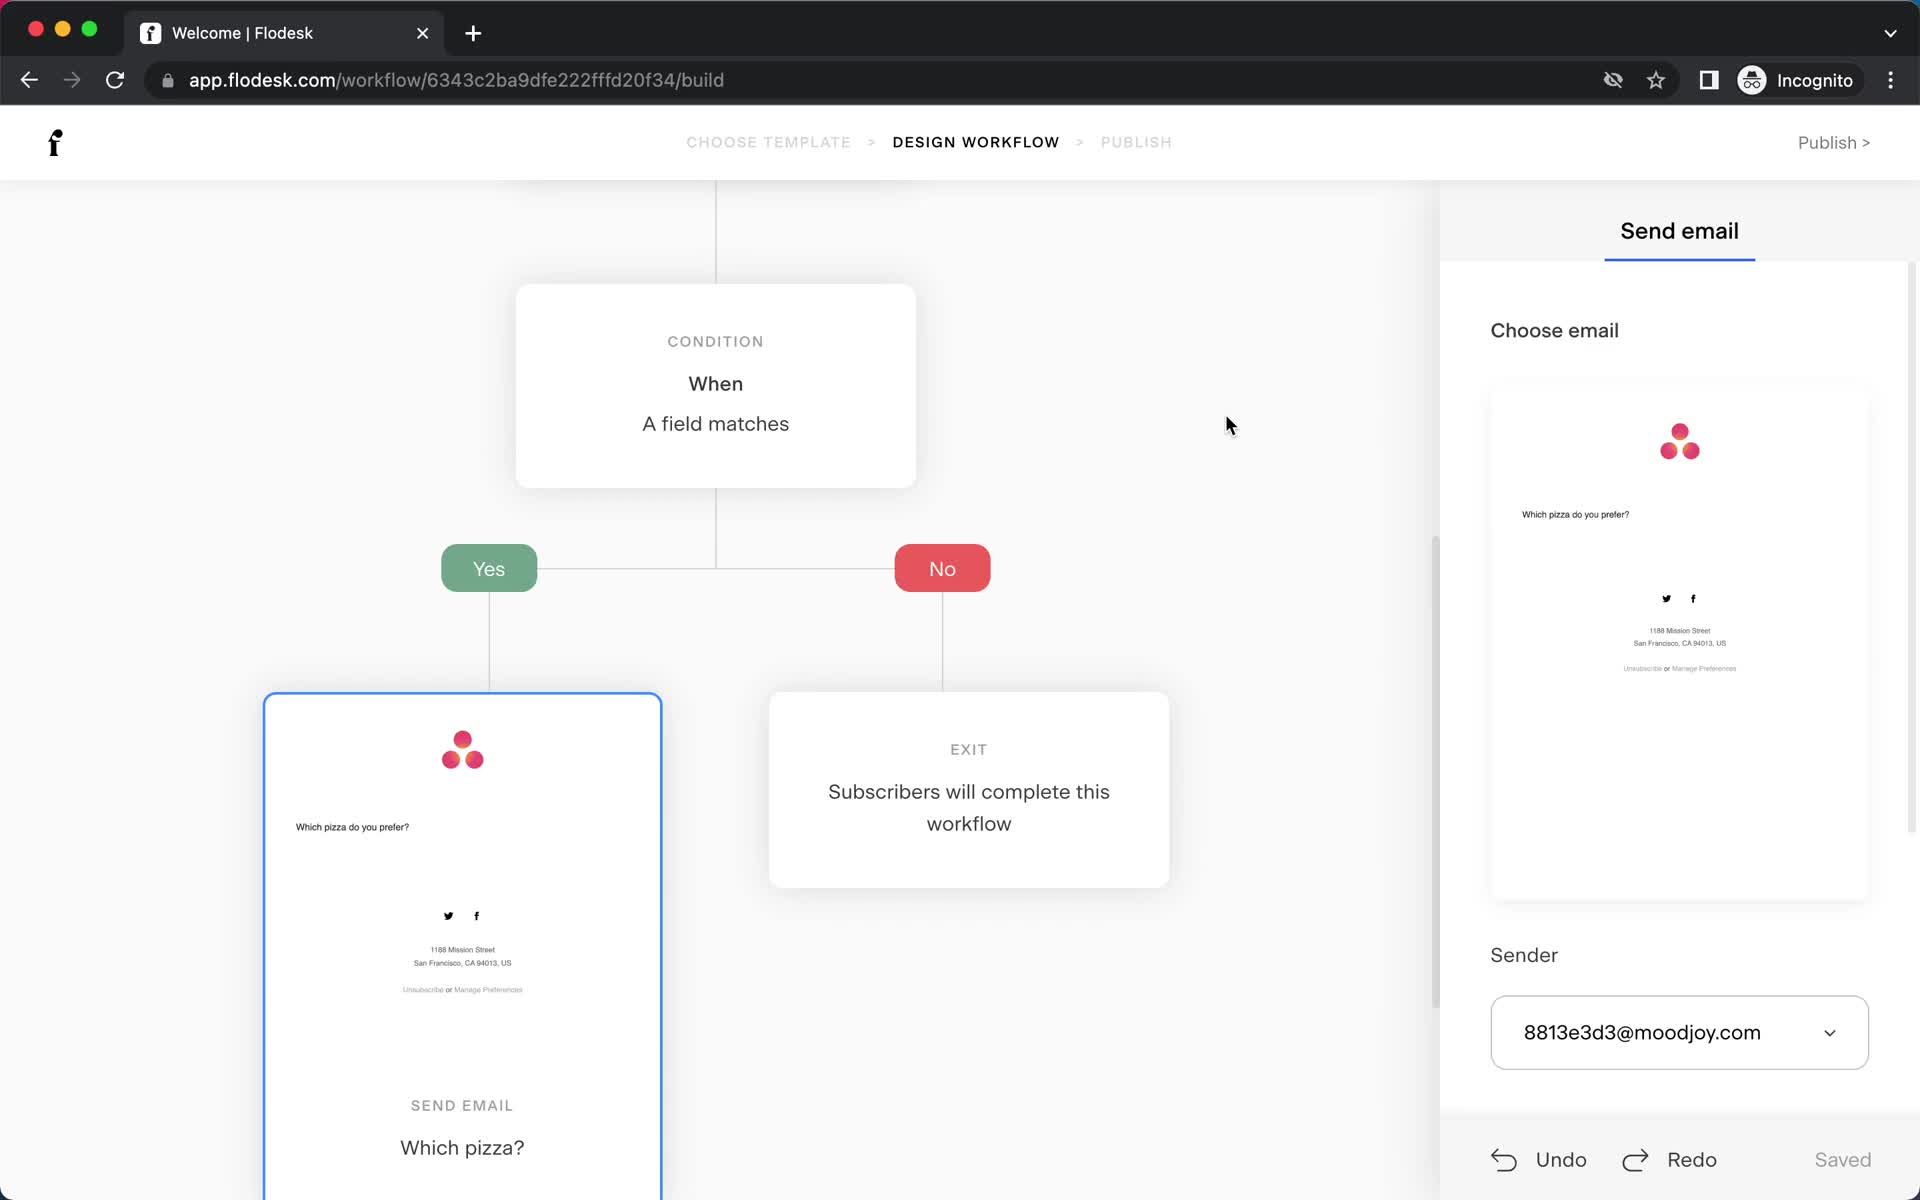
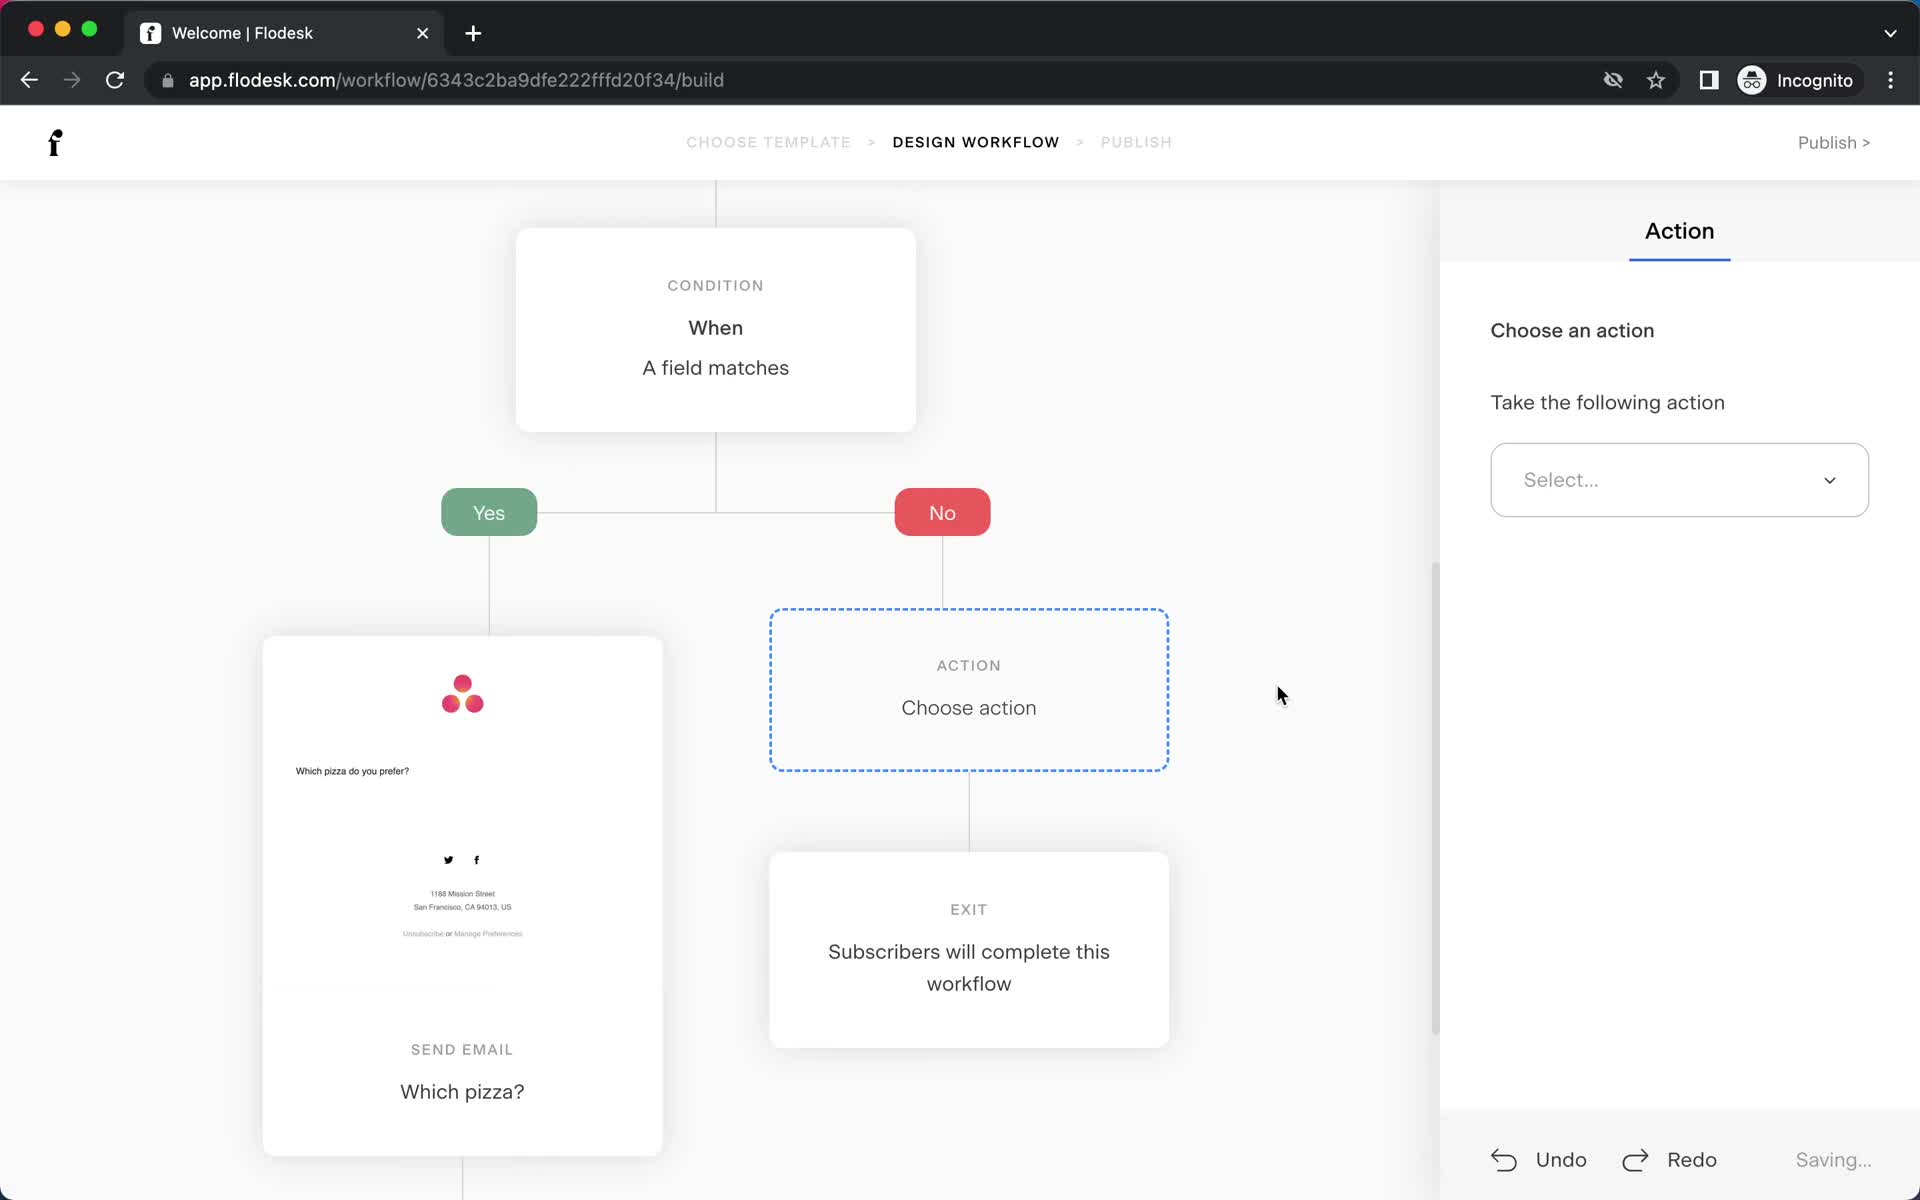
Set action
this is title
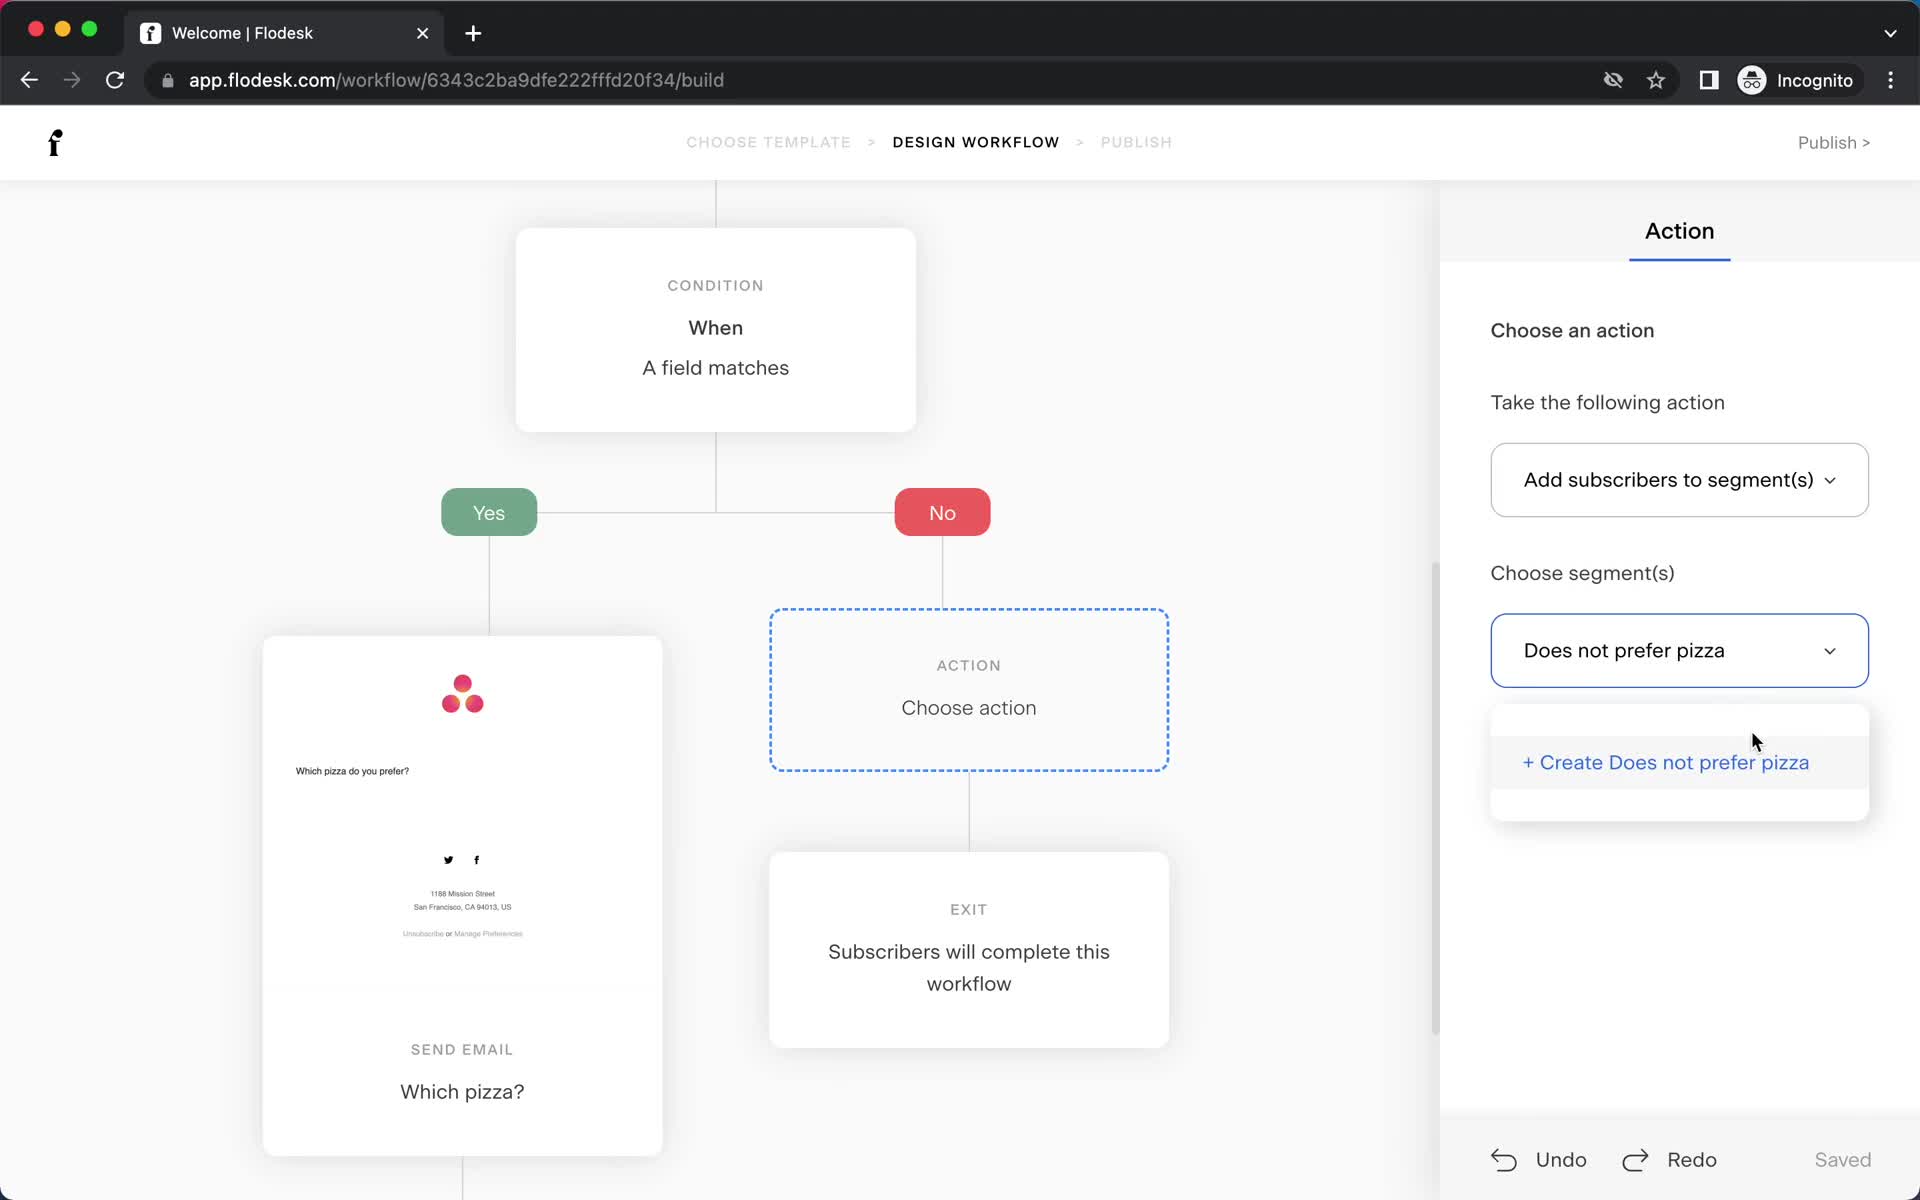
Set action
this is title
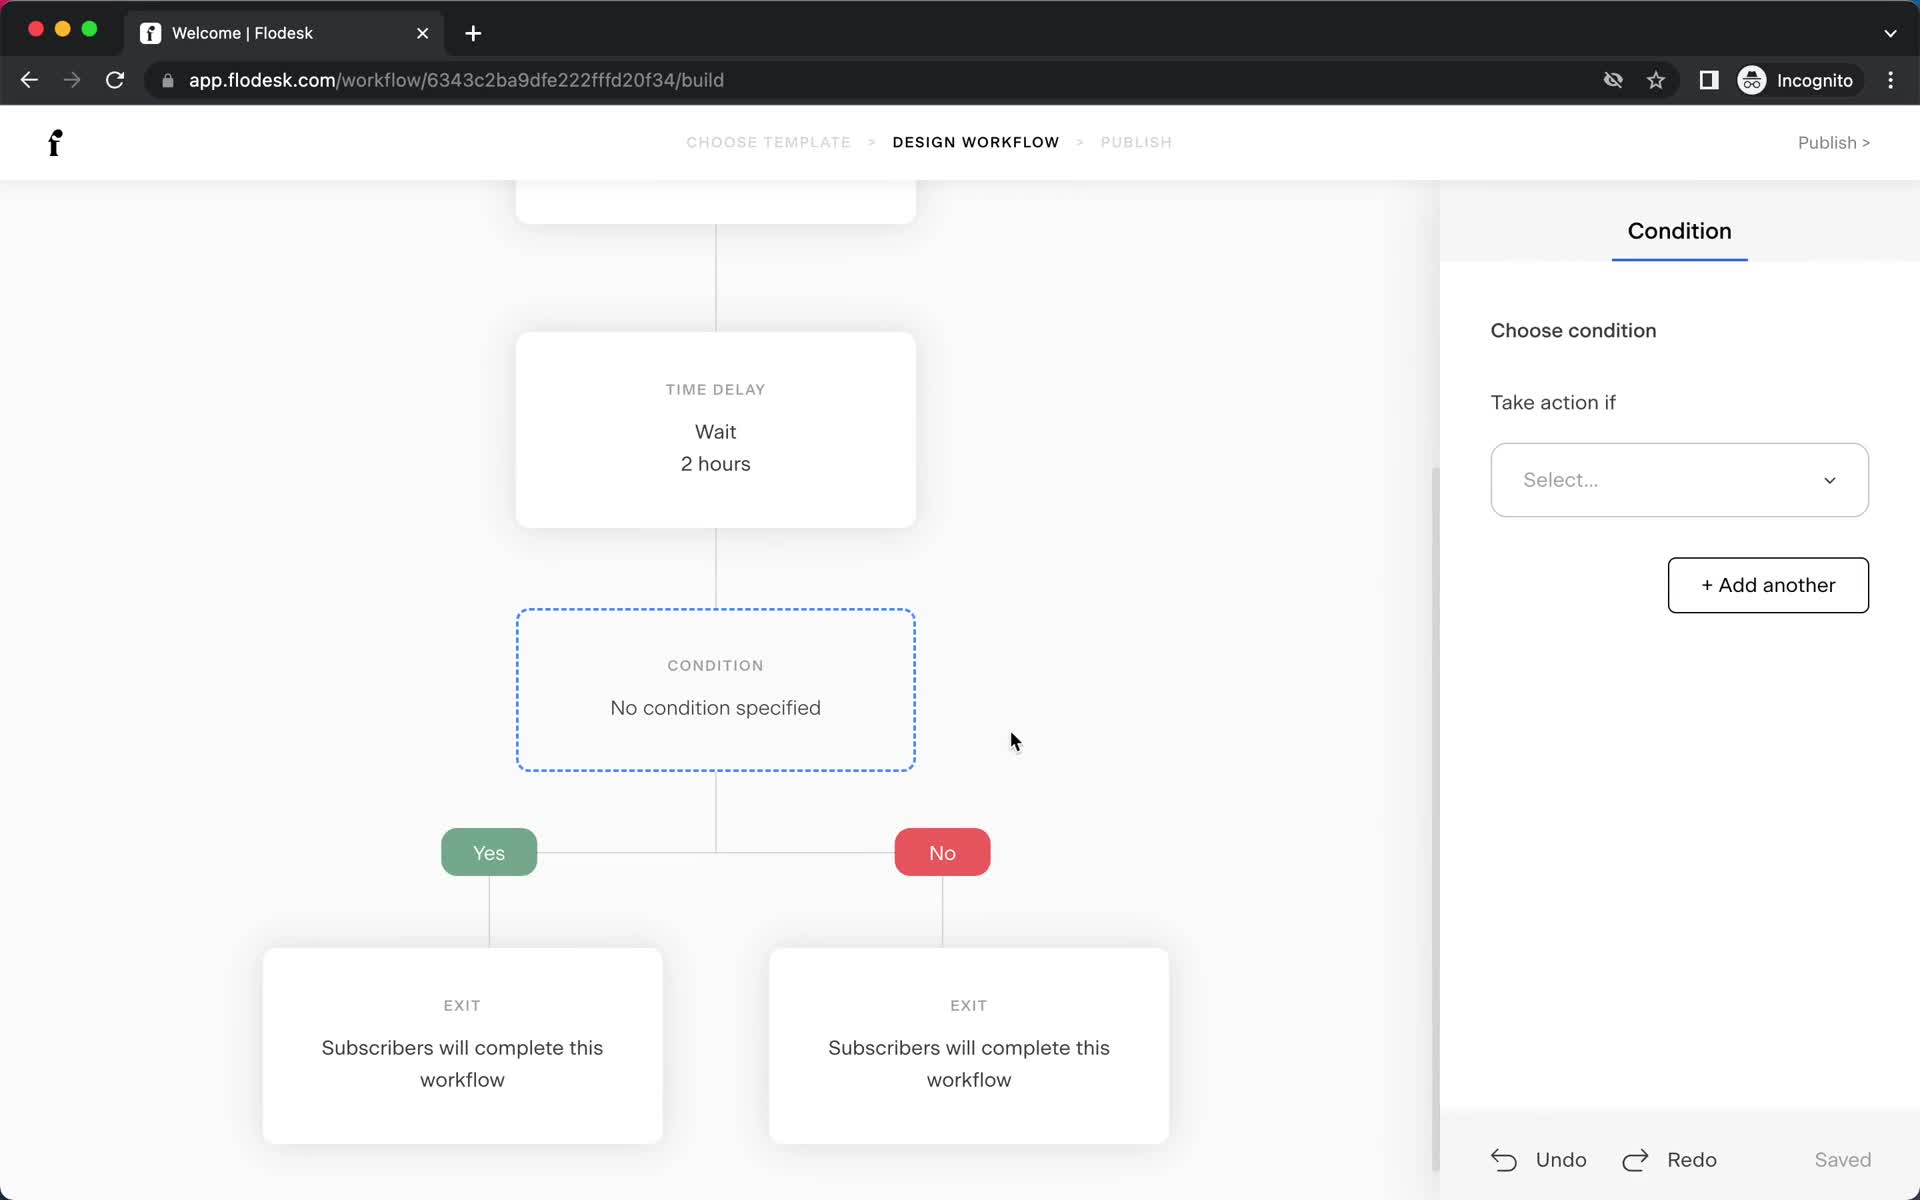
Conditional logic
this is title
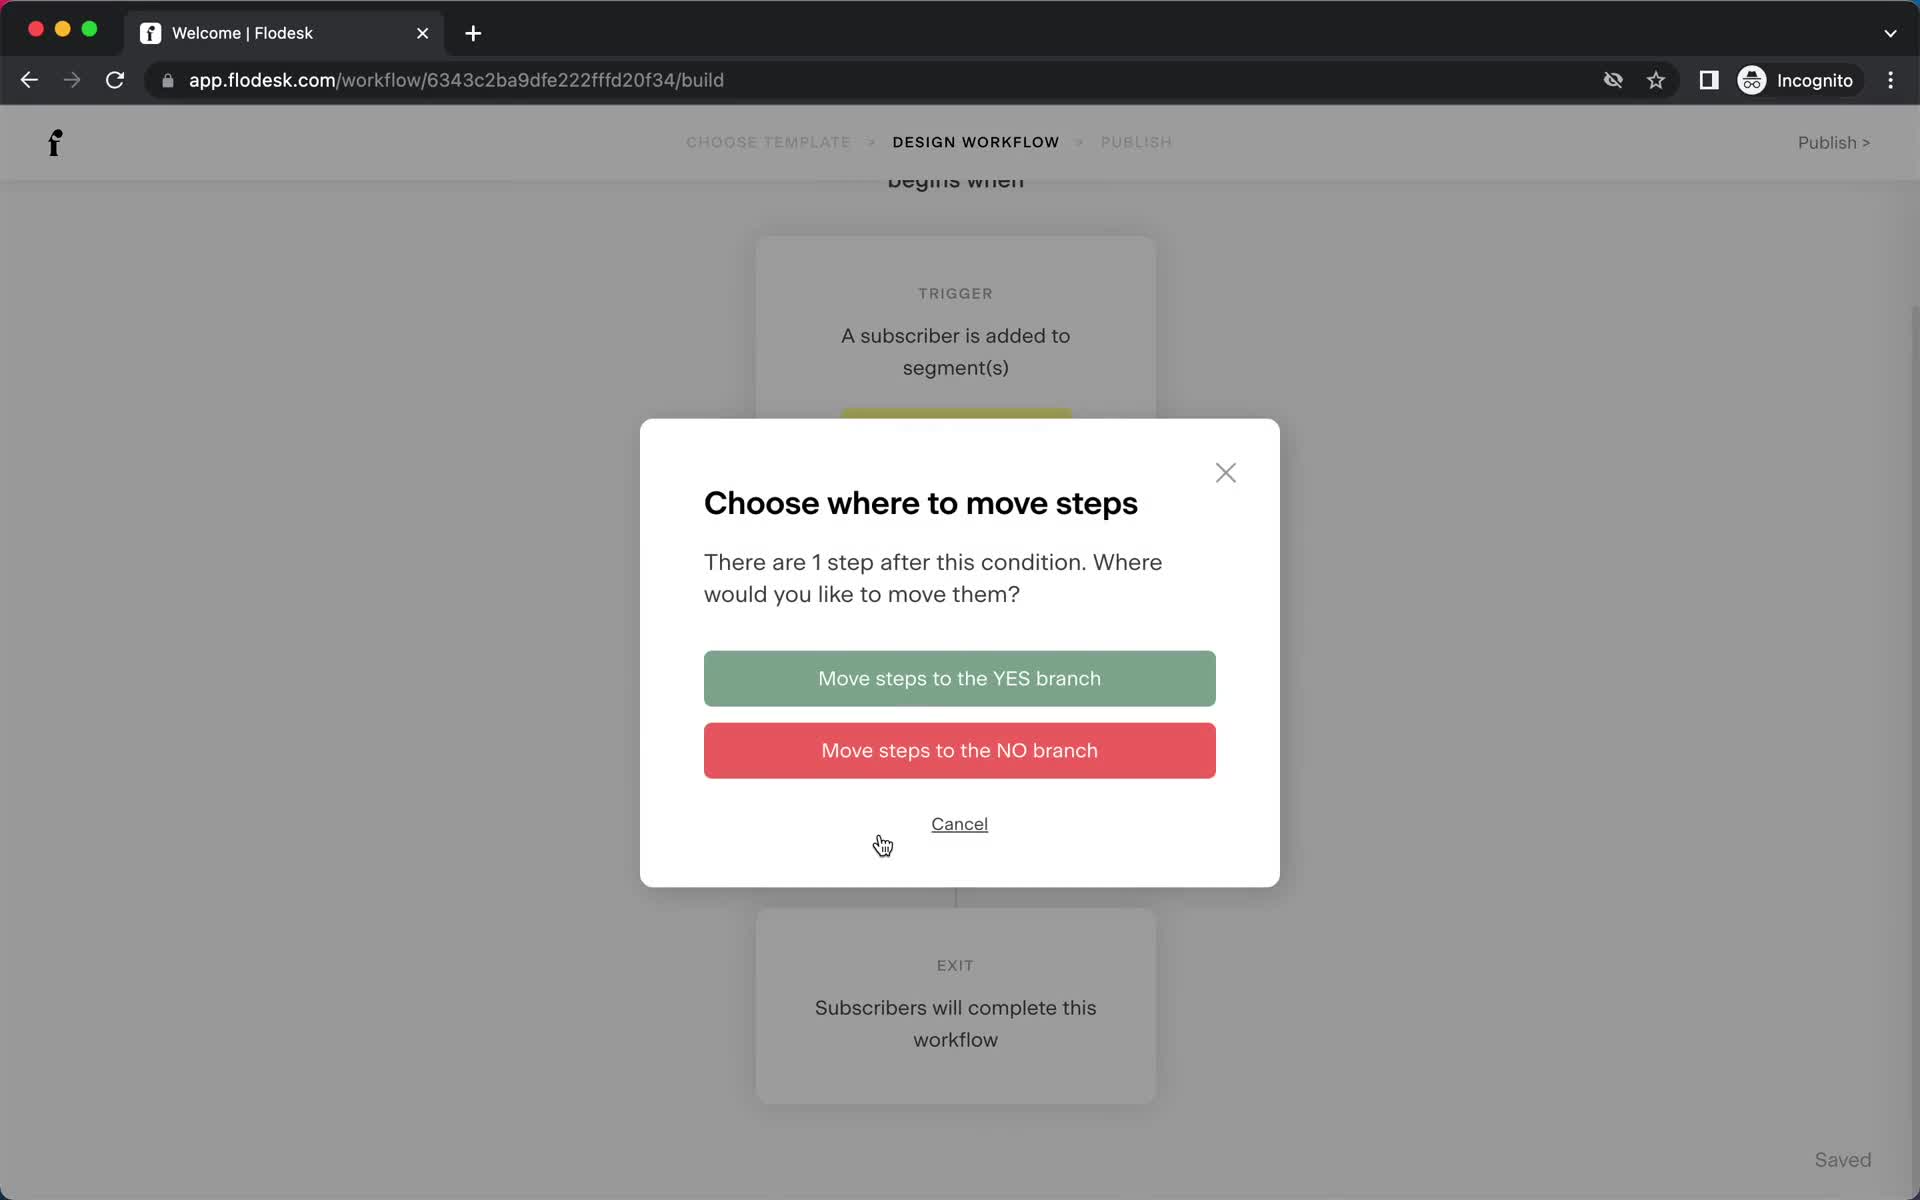
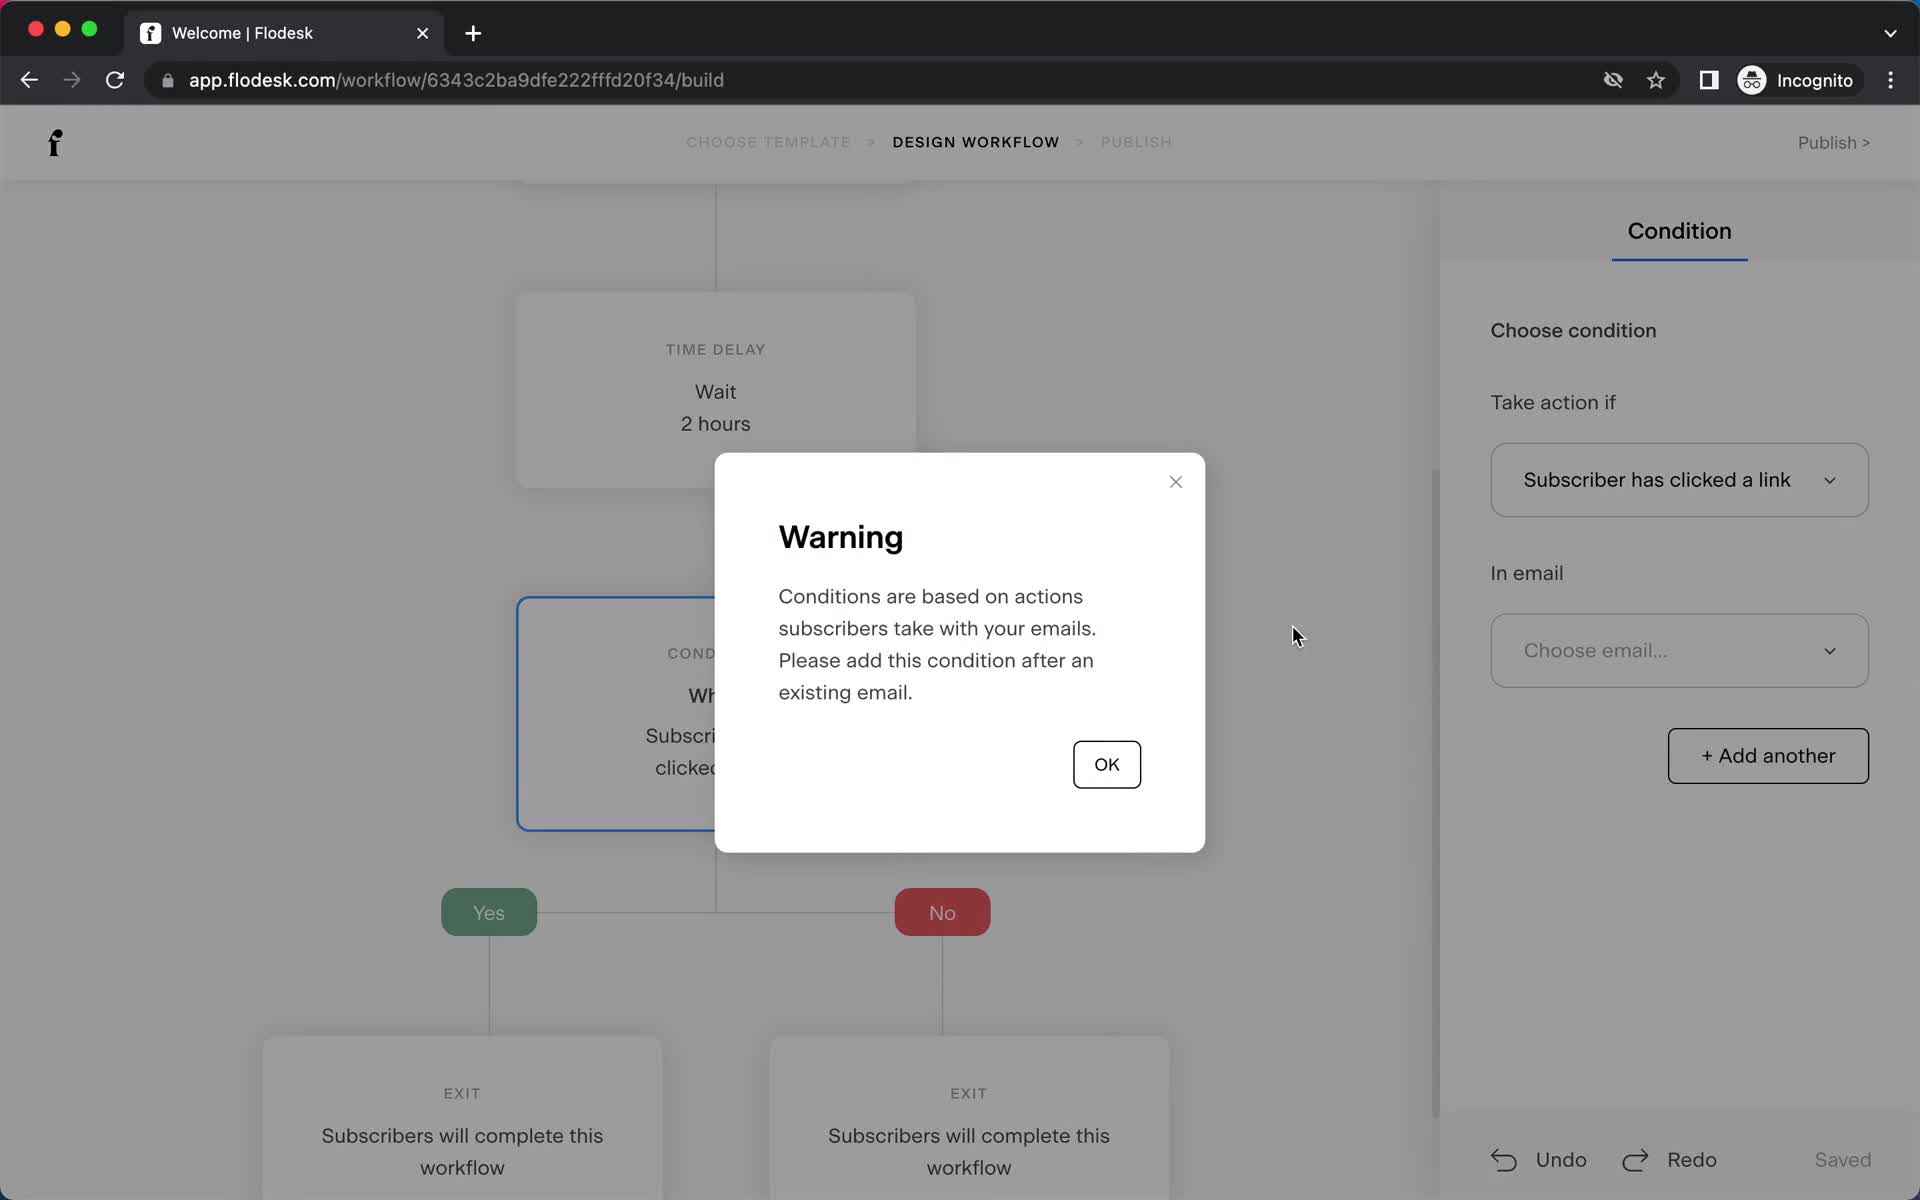
Warning
this is title
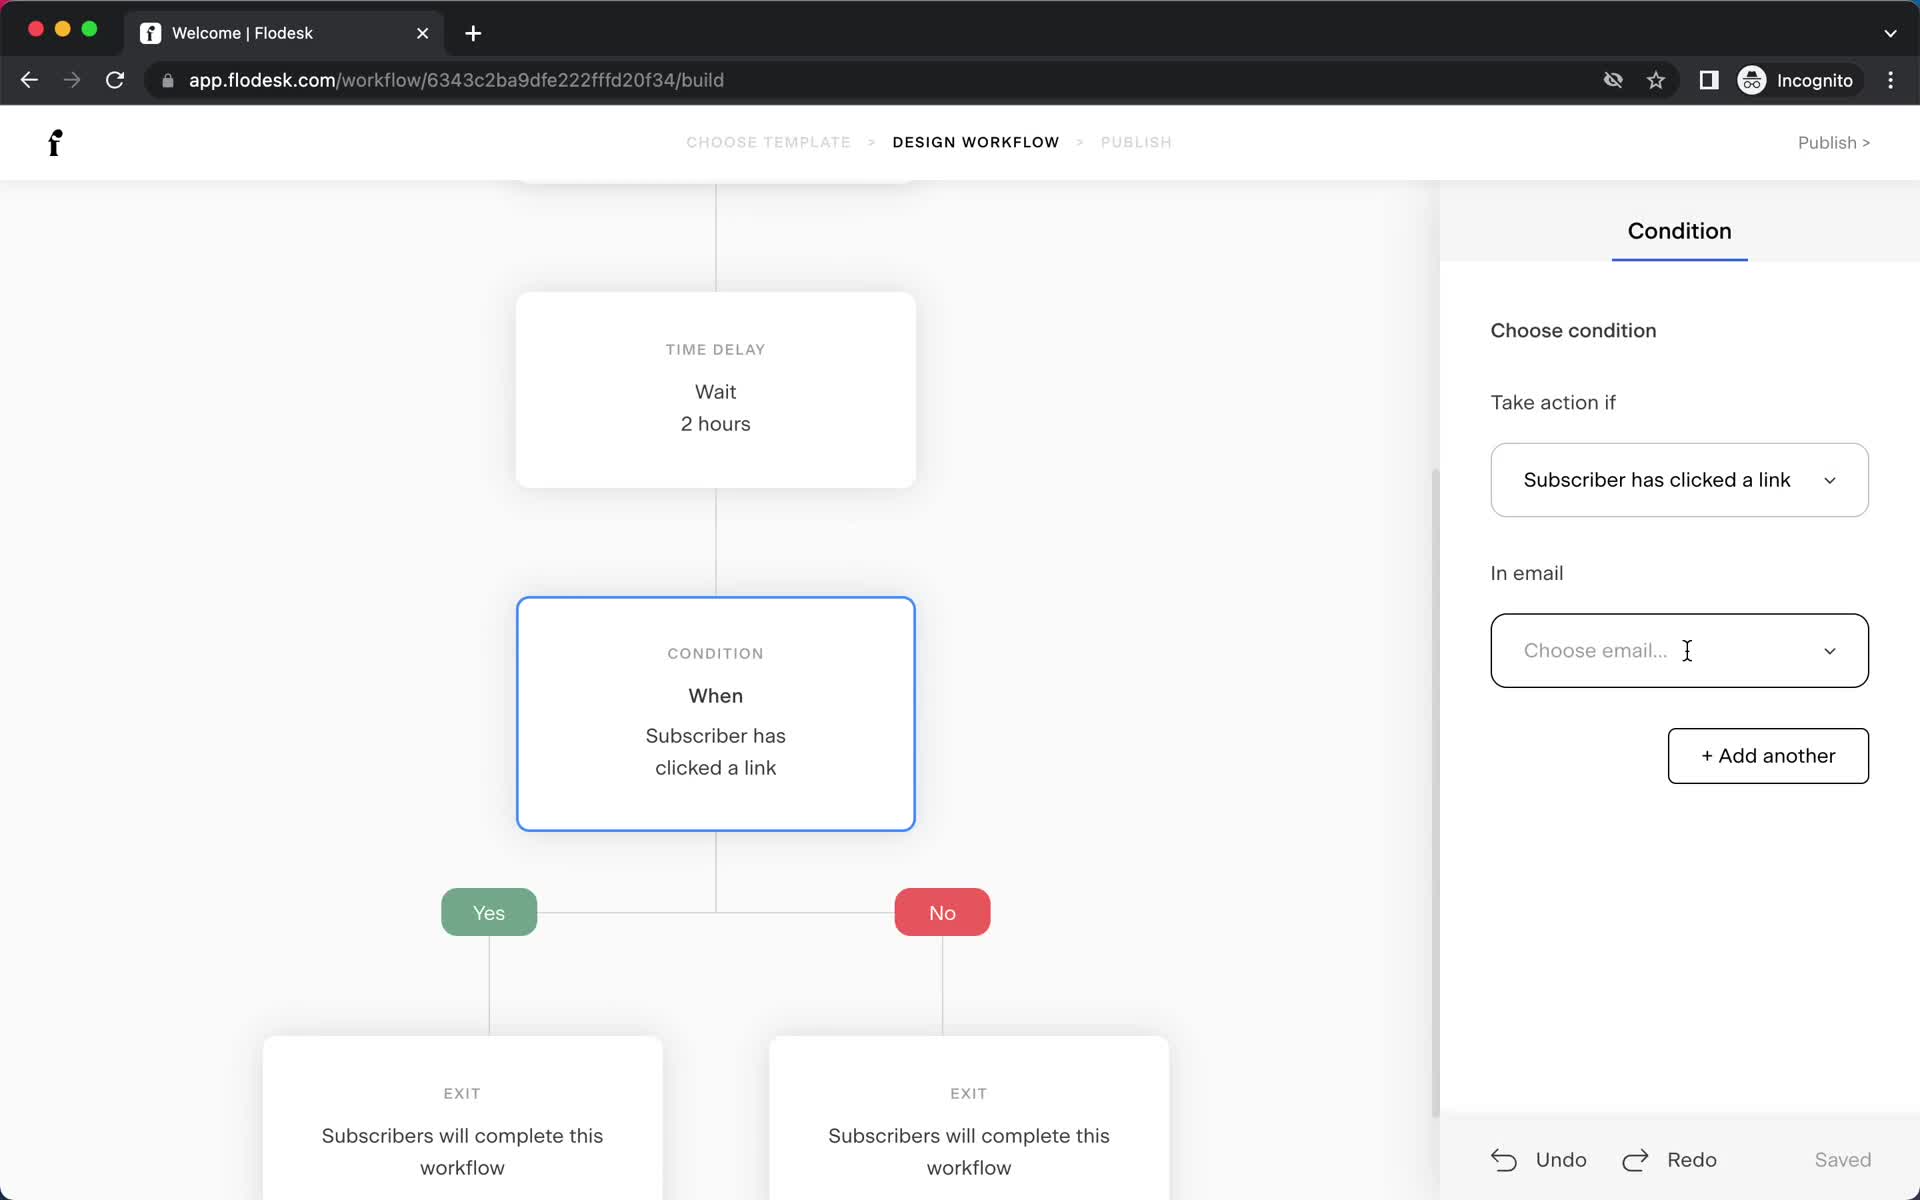
Conditional logic
this is title
Guide modal
this is title
Conditional logic
this is title
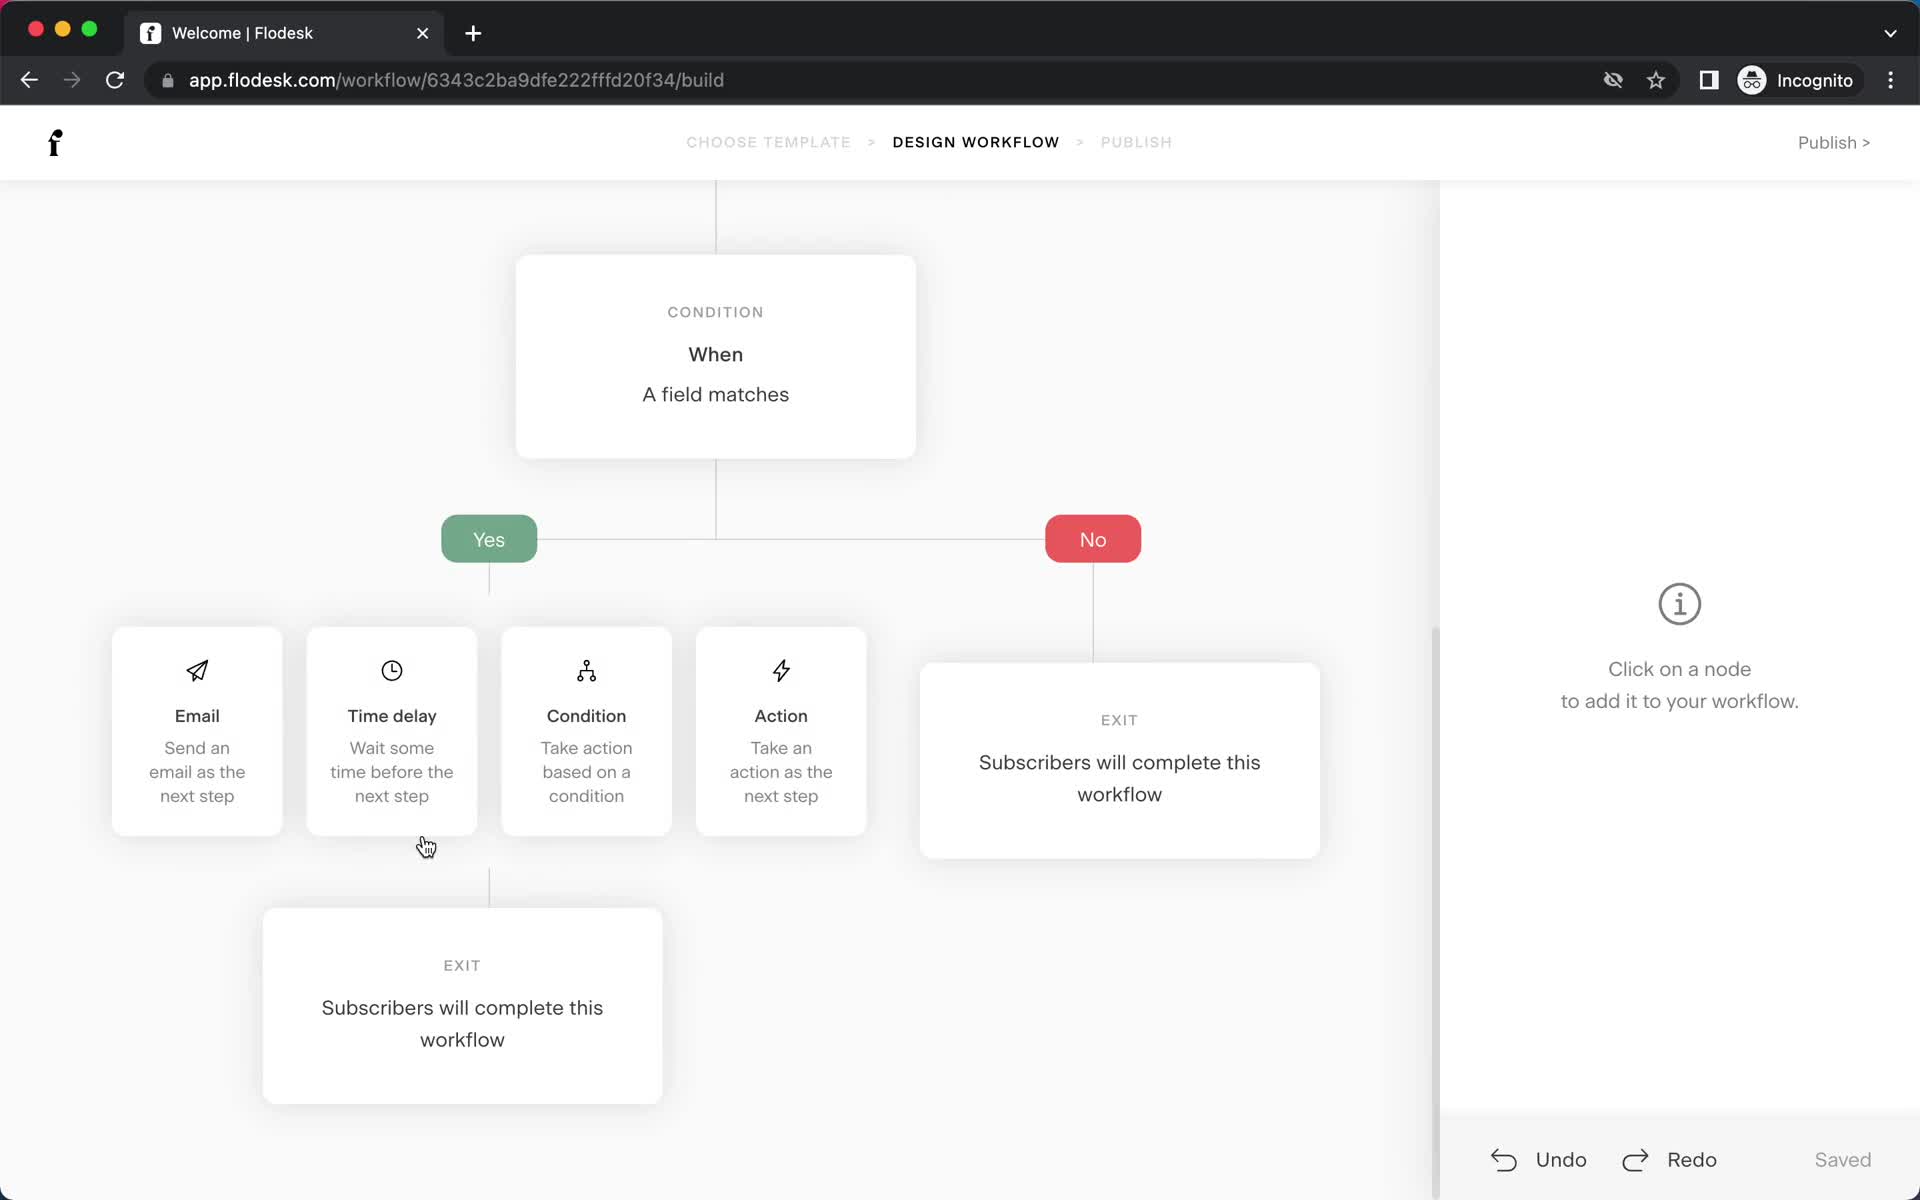
Workflow builder
this is title
Workflow builder
this is title
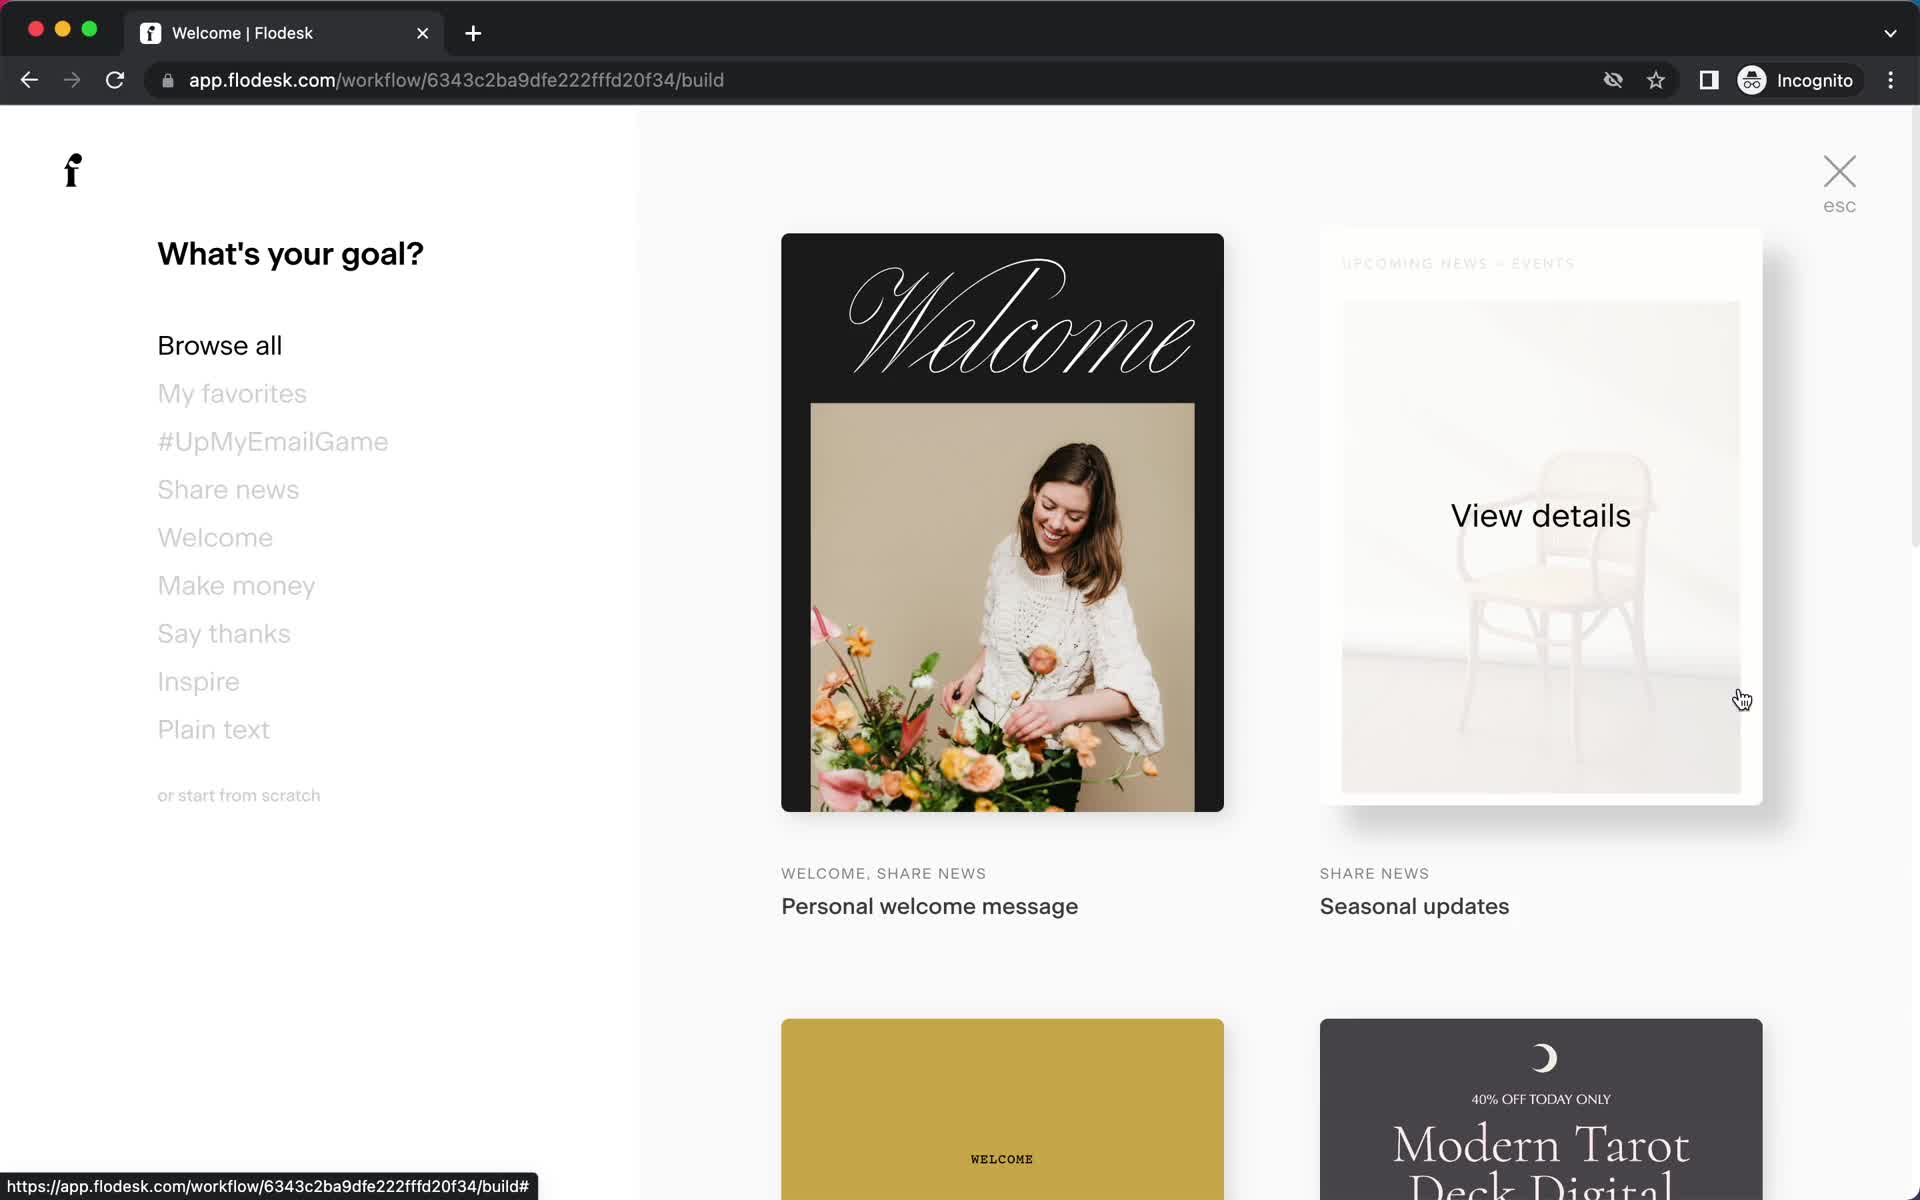
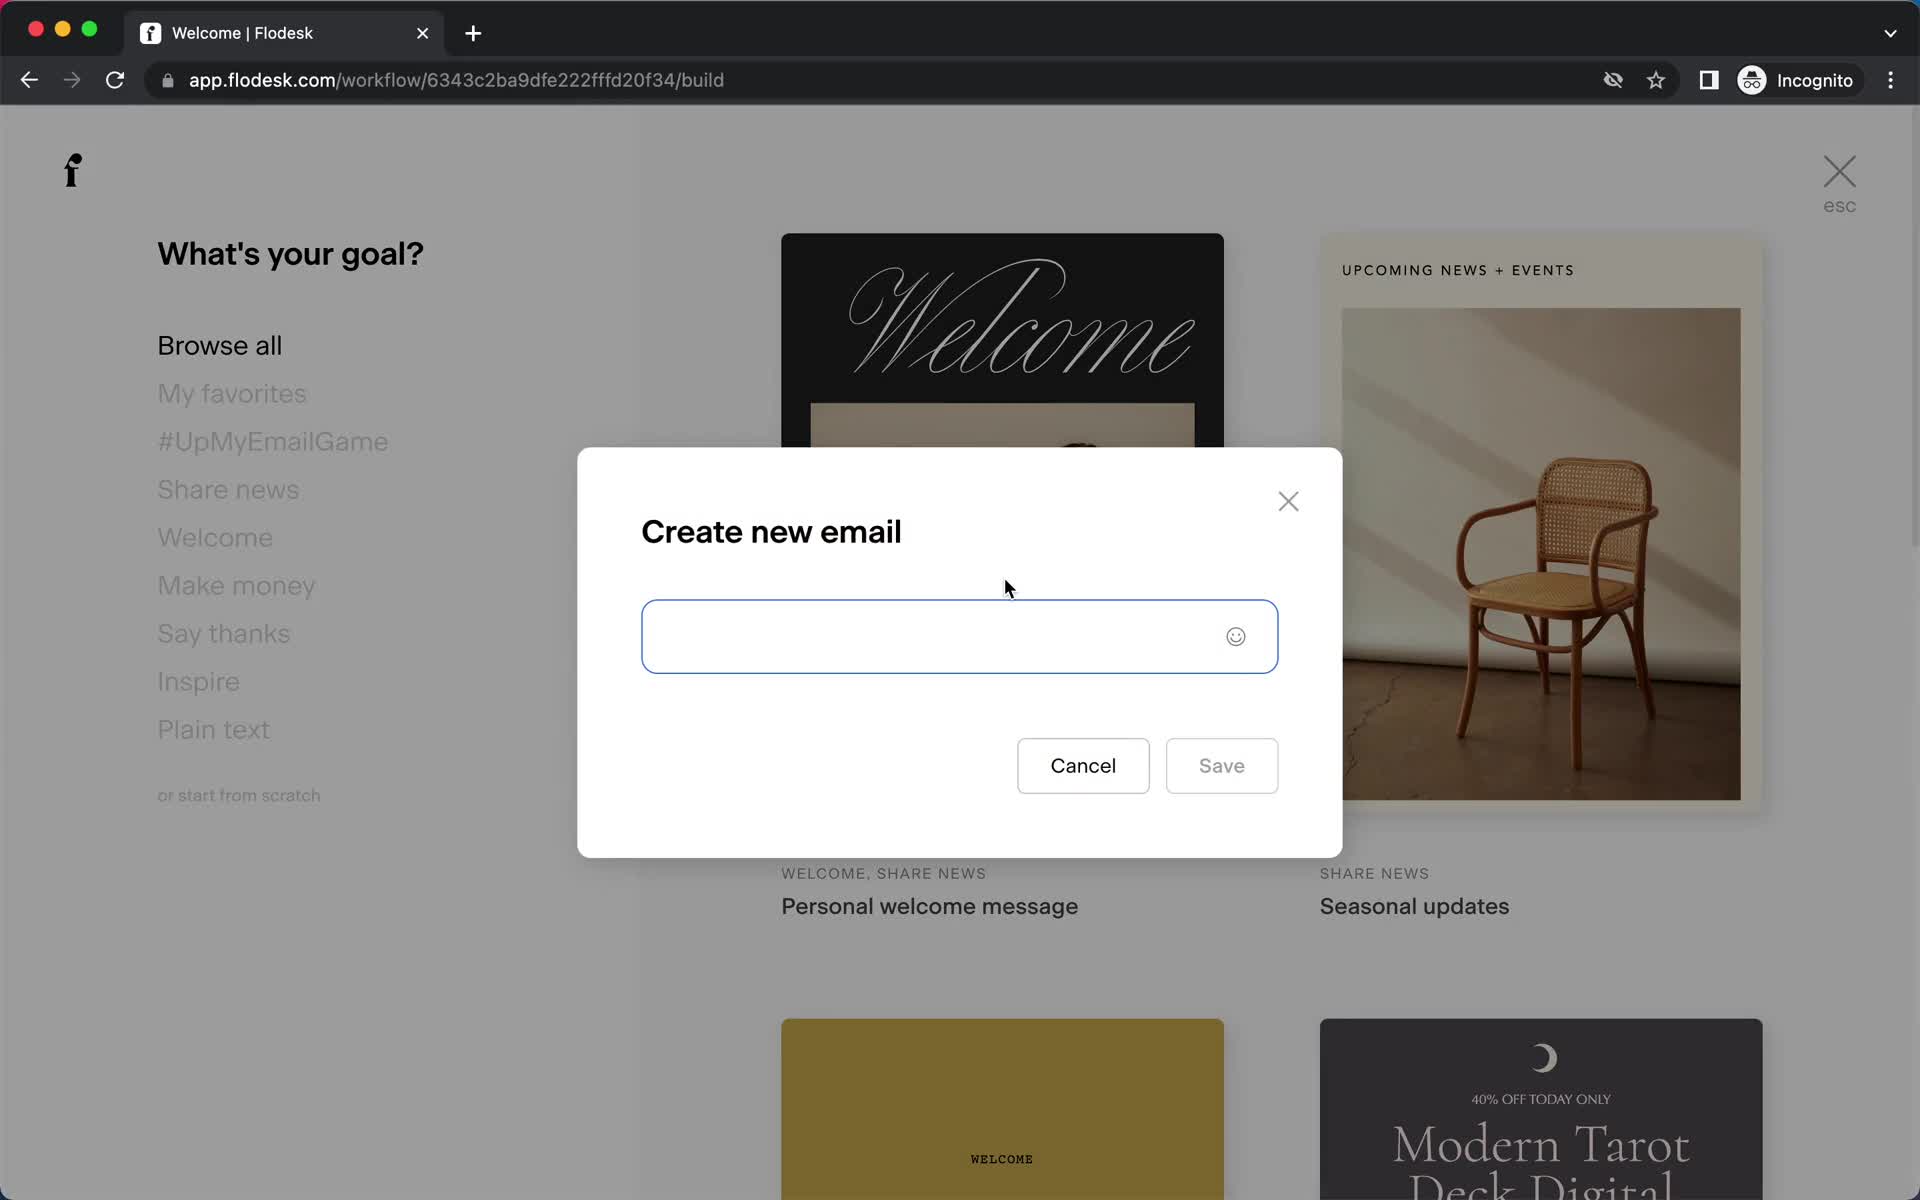
Create email campaign
this is title
Create email campaign
this is title
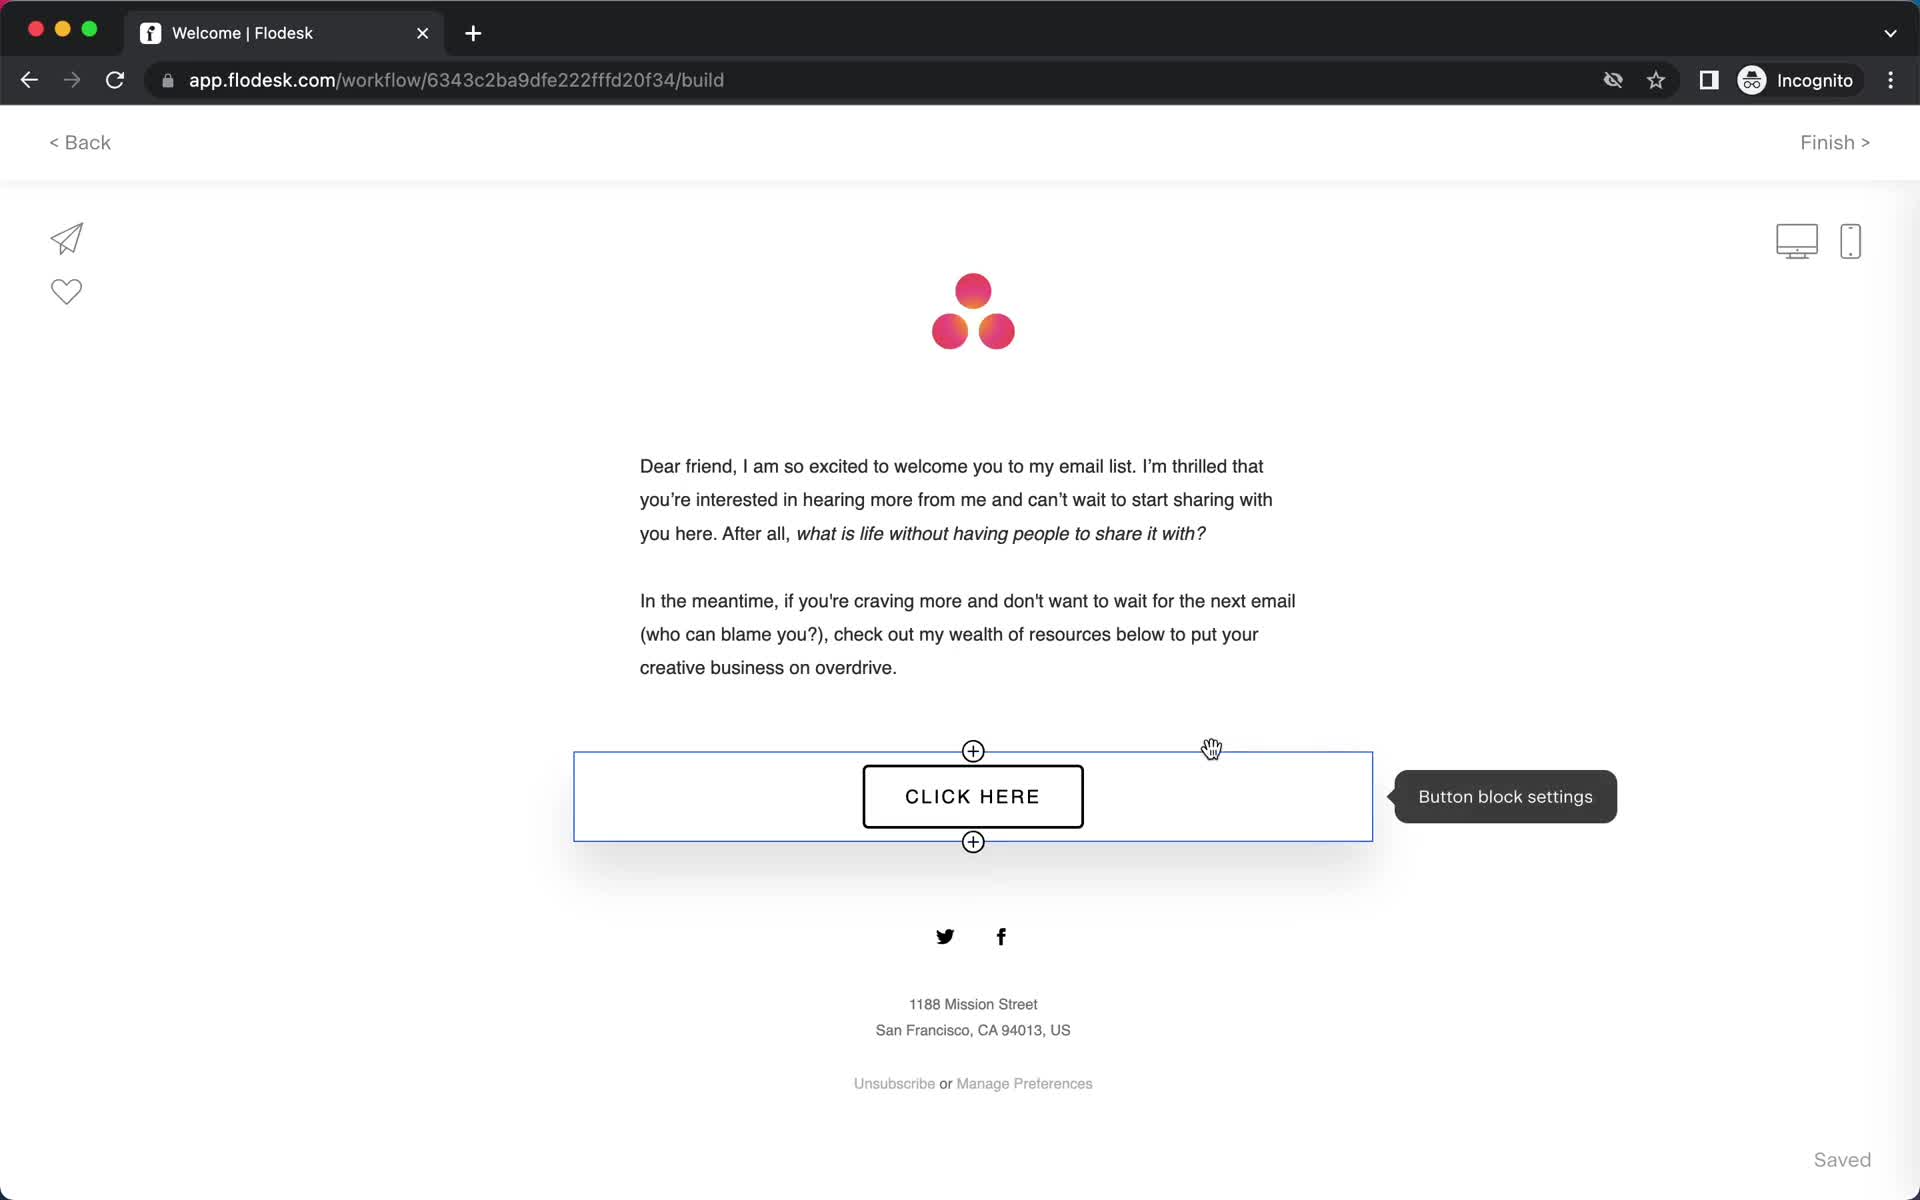
Editor
this is title
Workflow builder
this is title
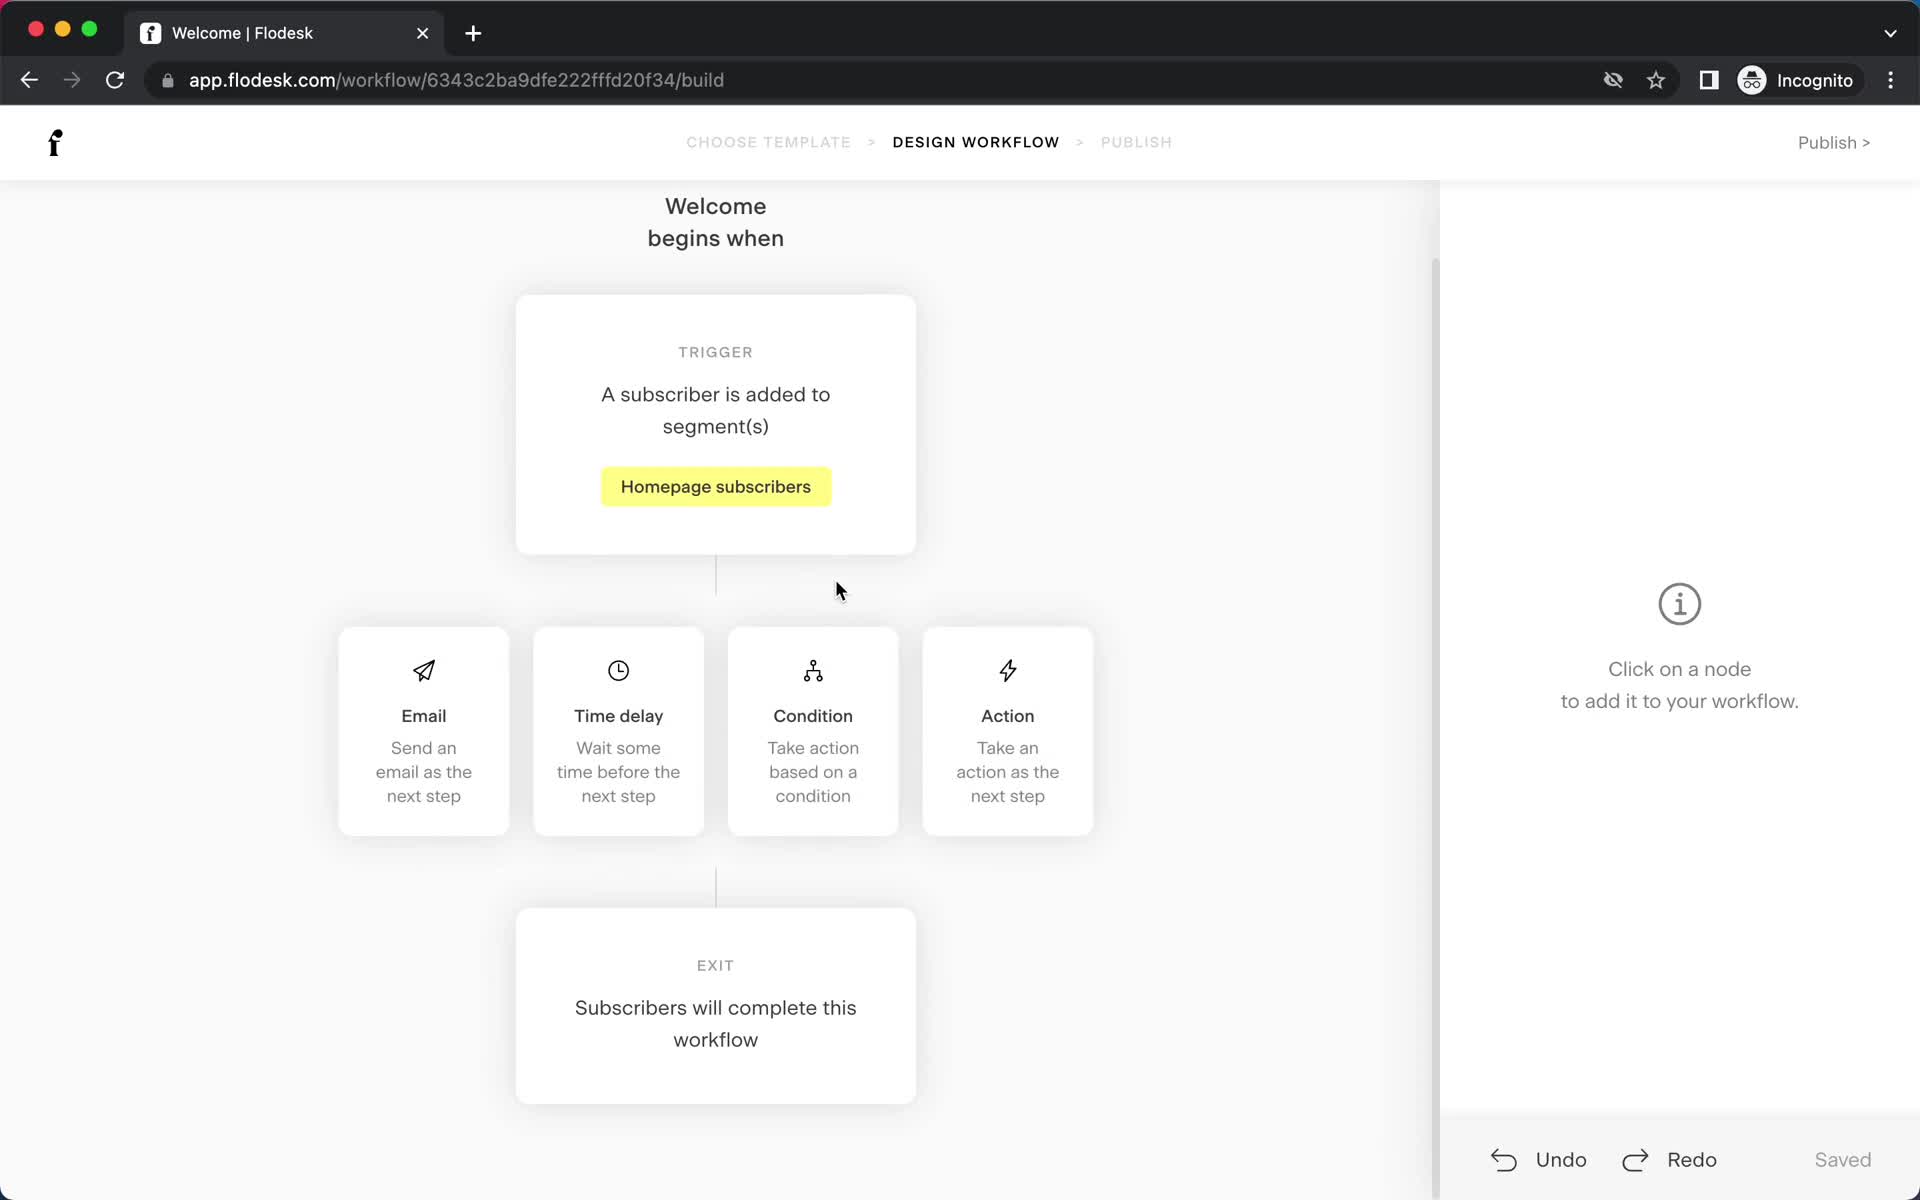
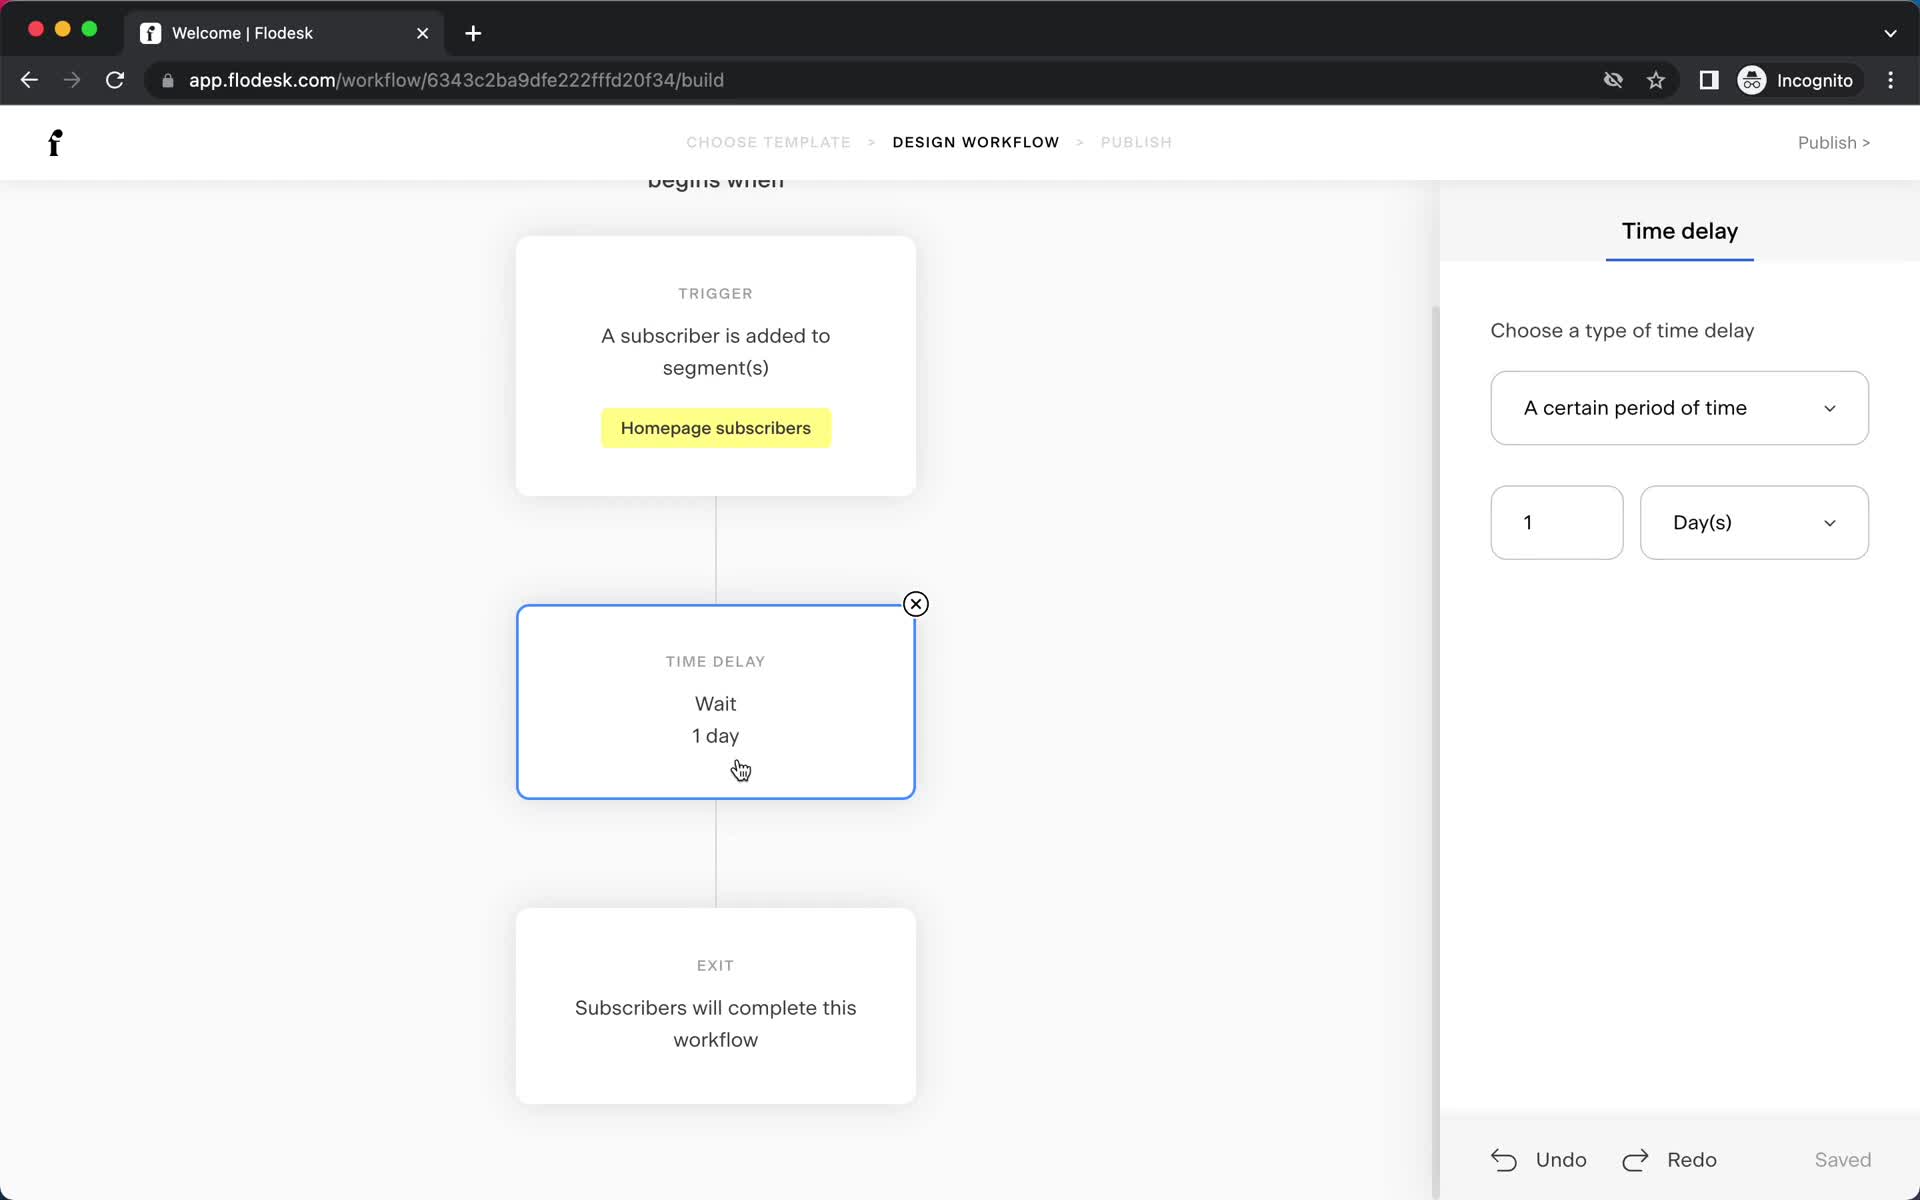
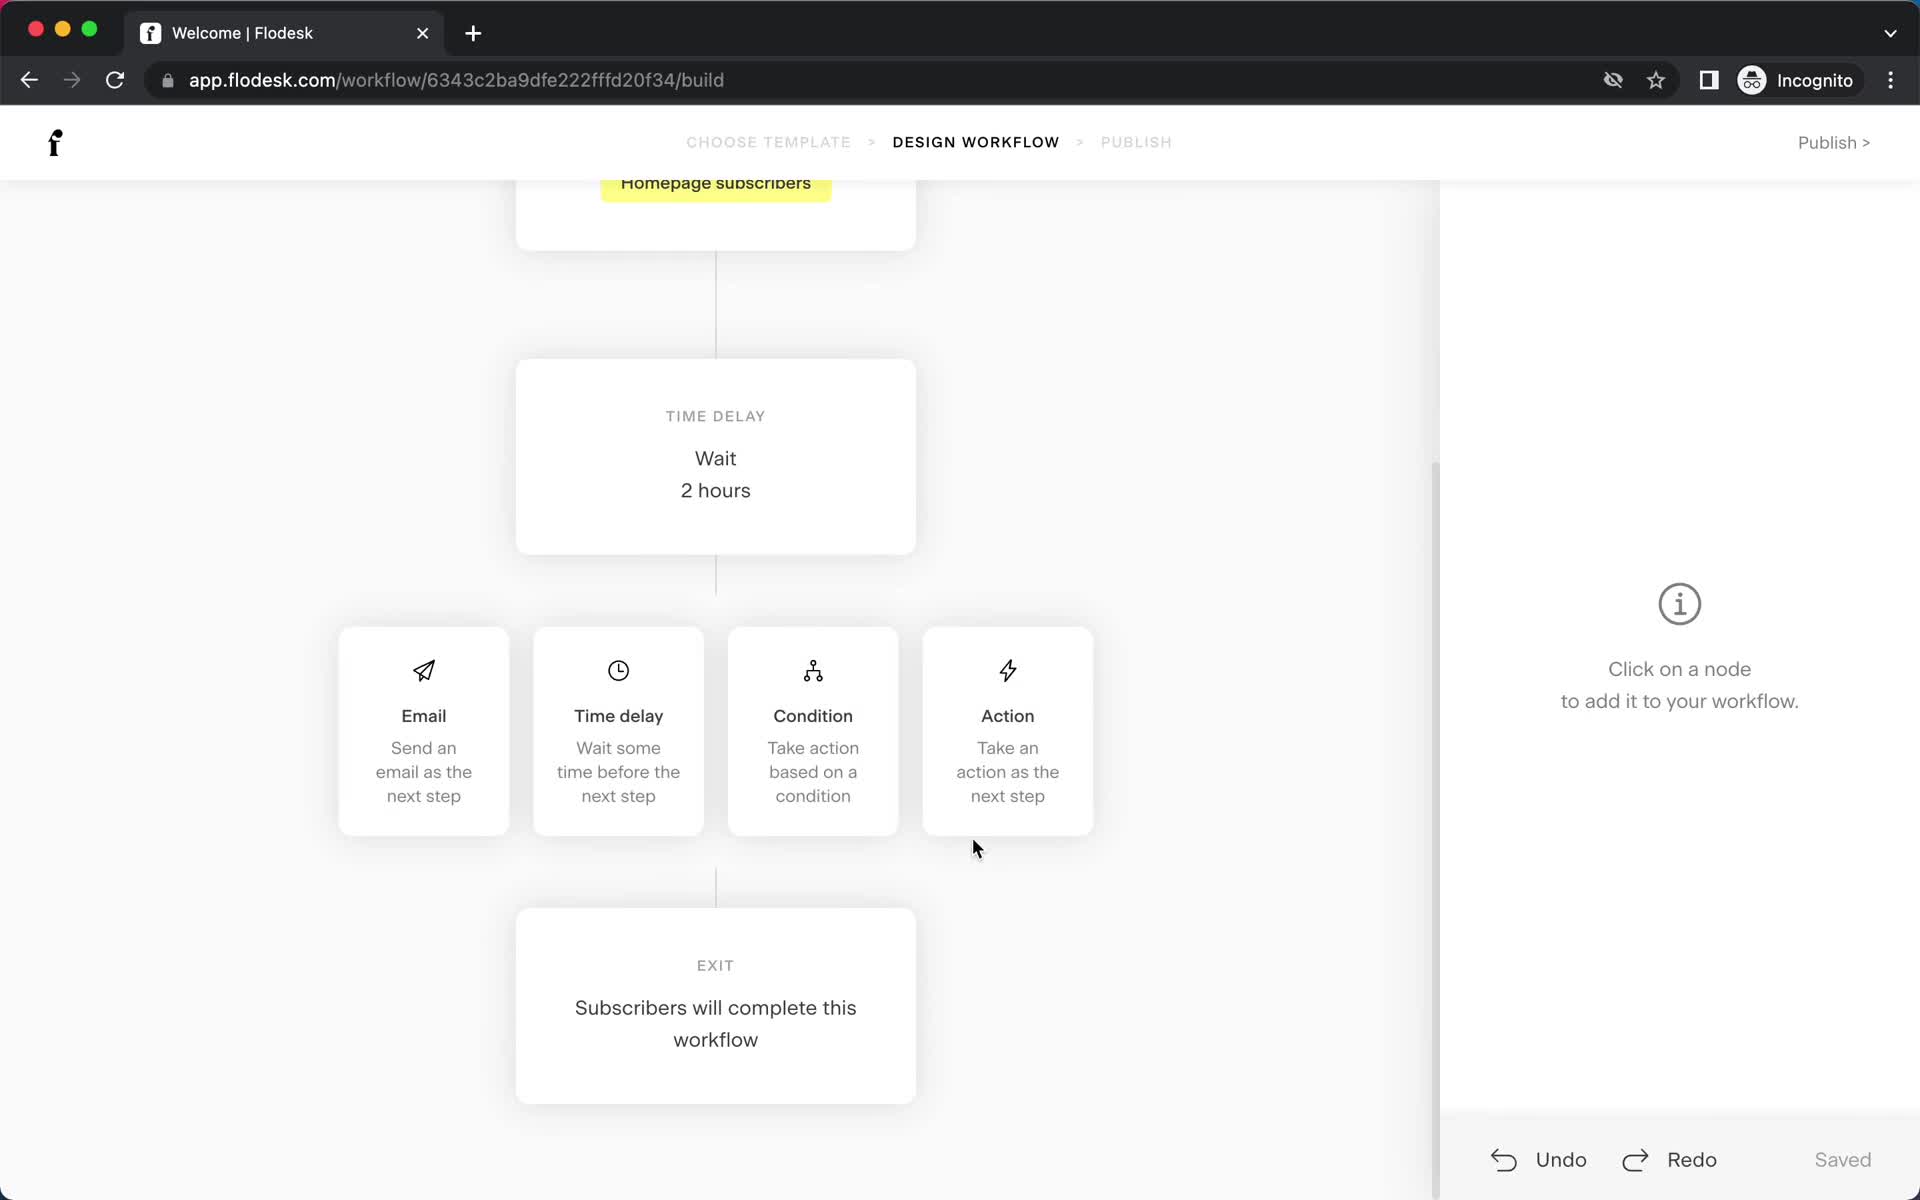
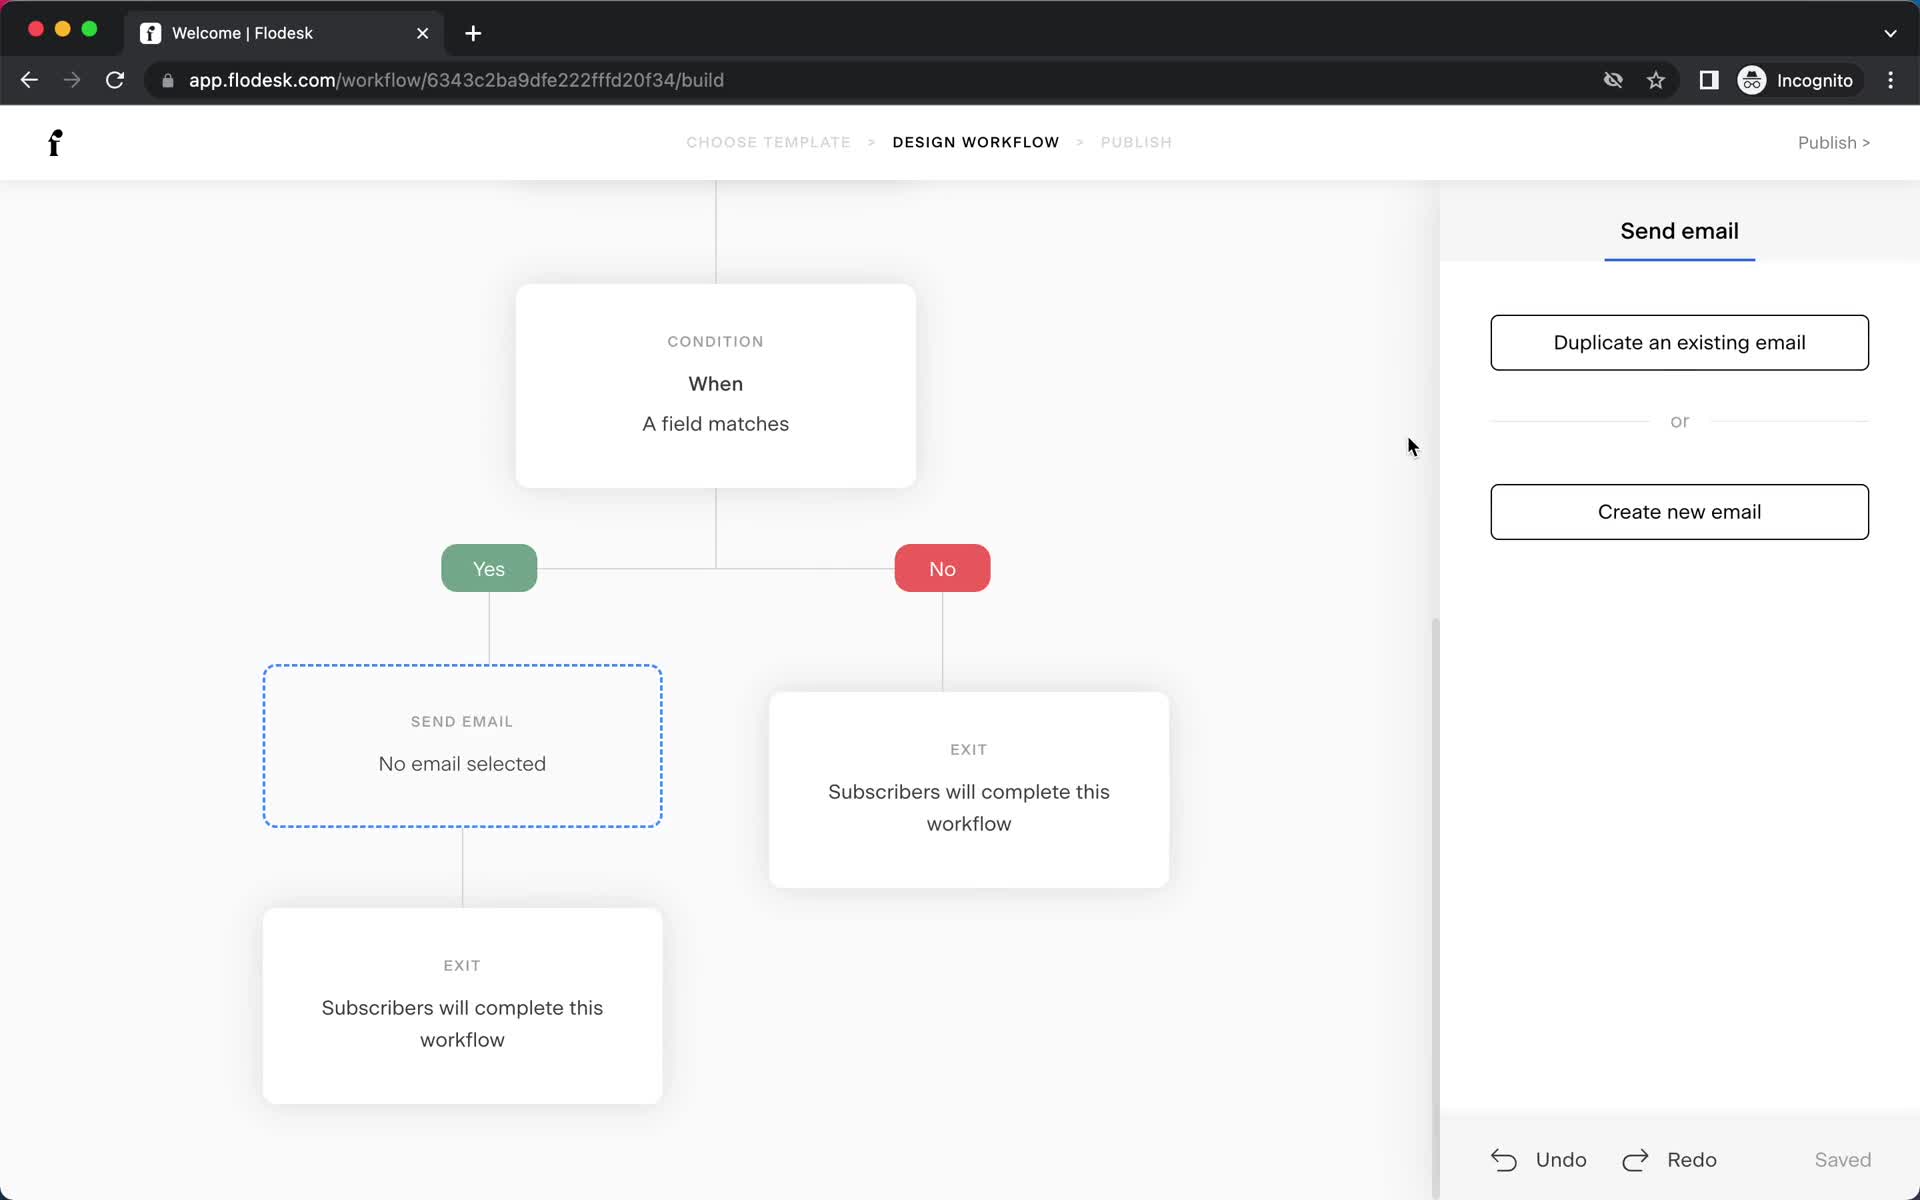
Workflow builder
this is title
this is title
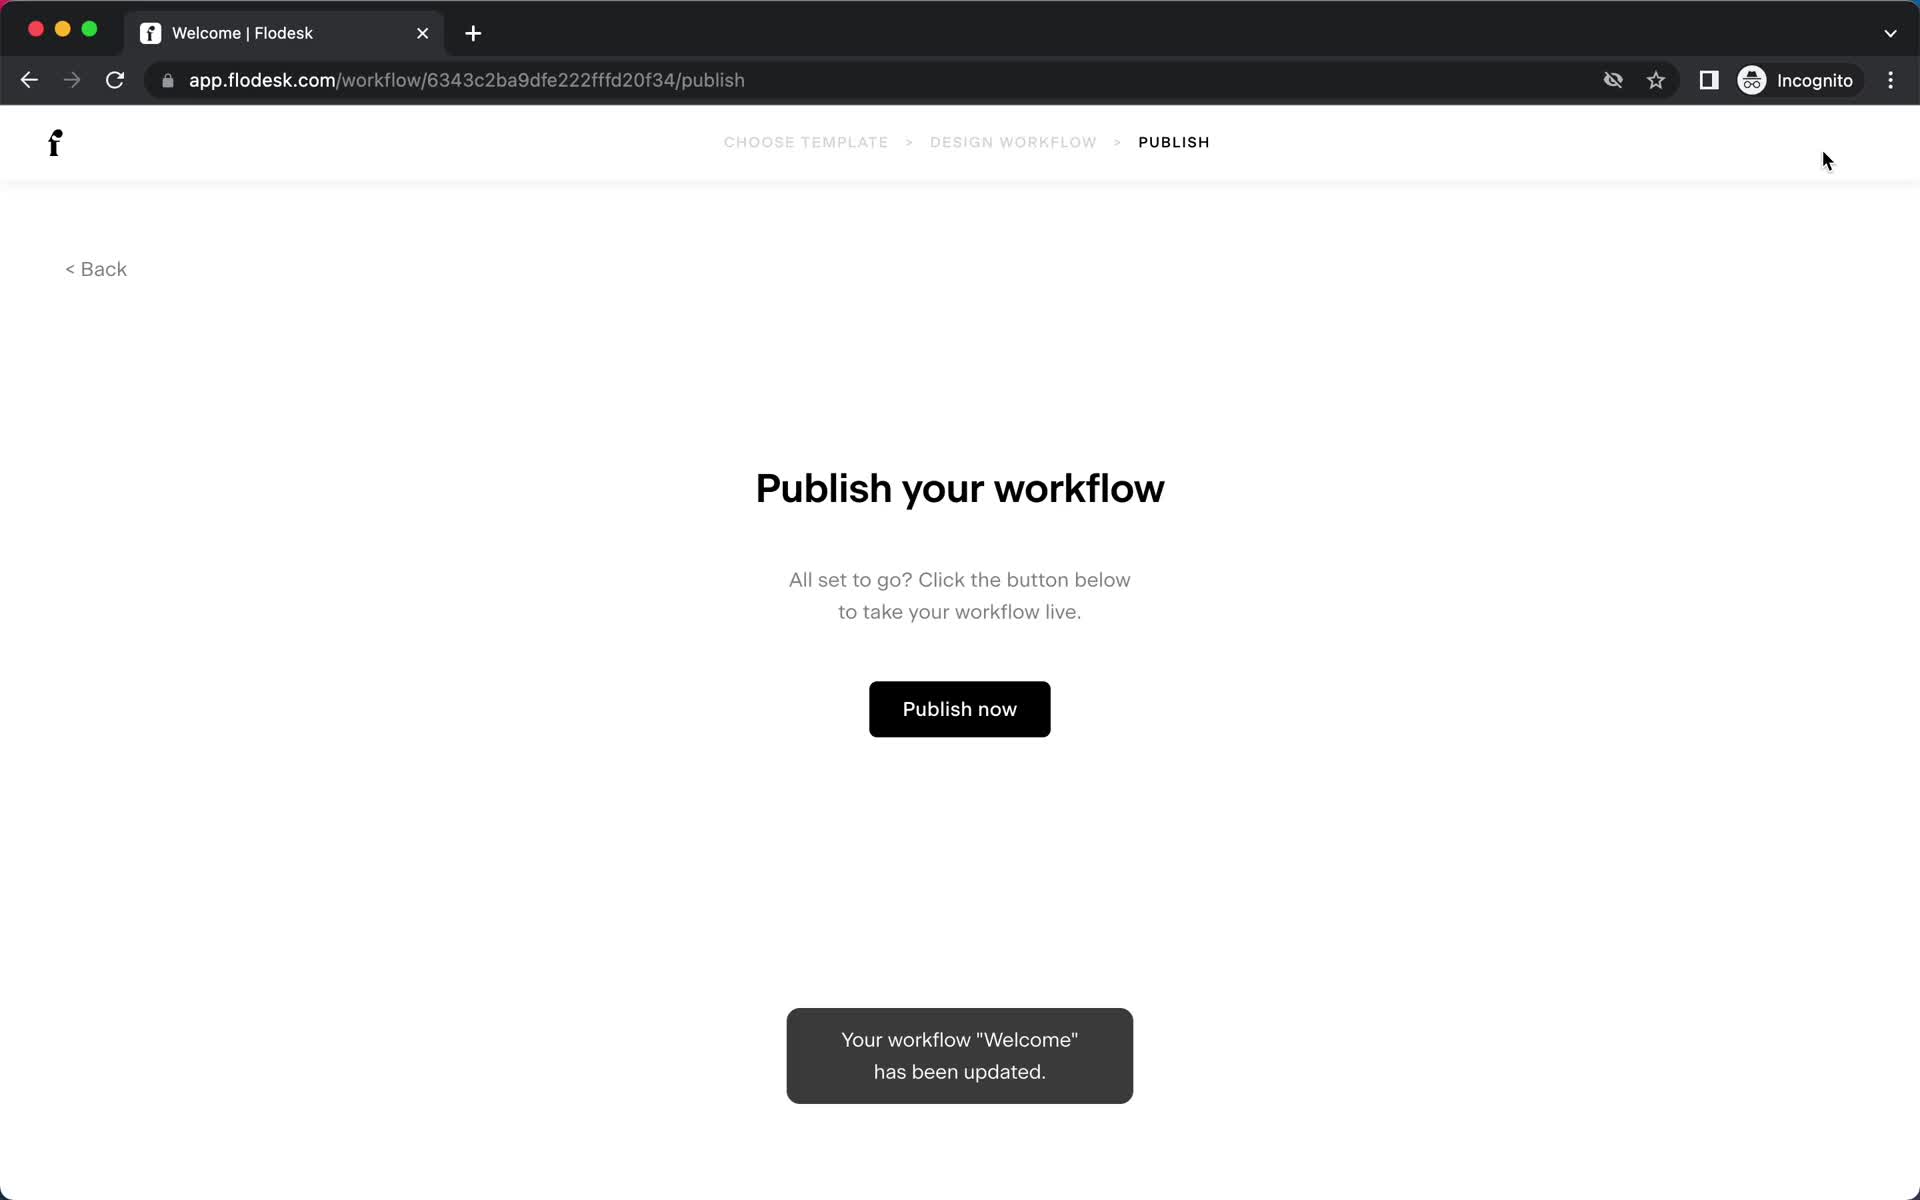
Publish
this is title
Email campaigns
this is title
Audience
this is title
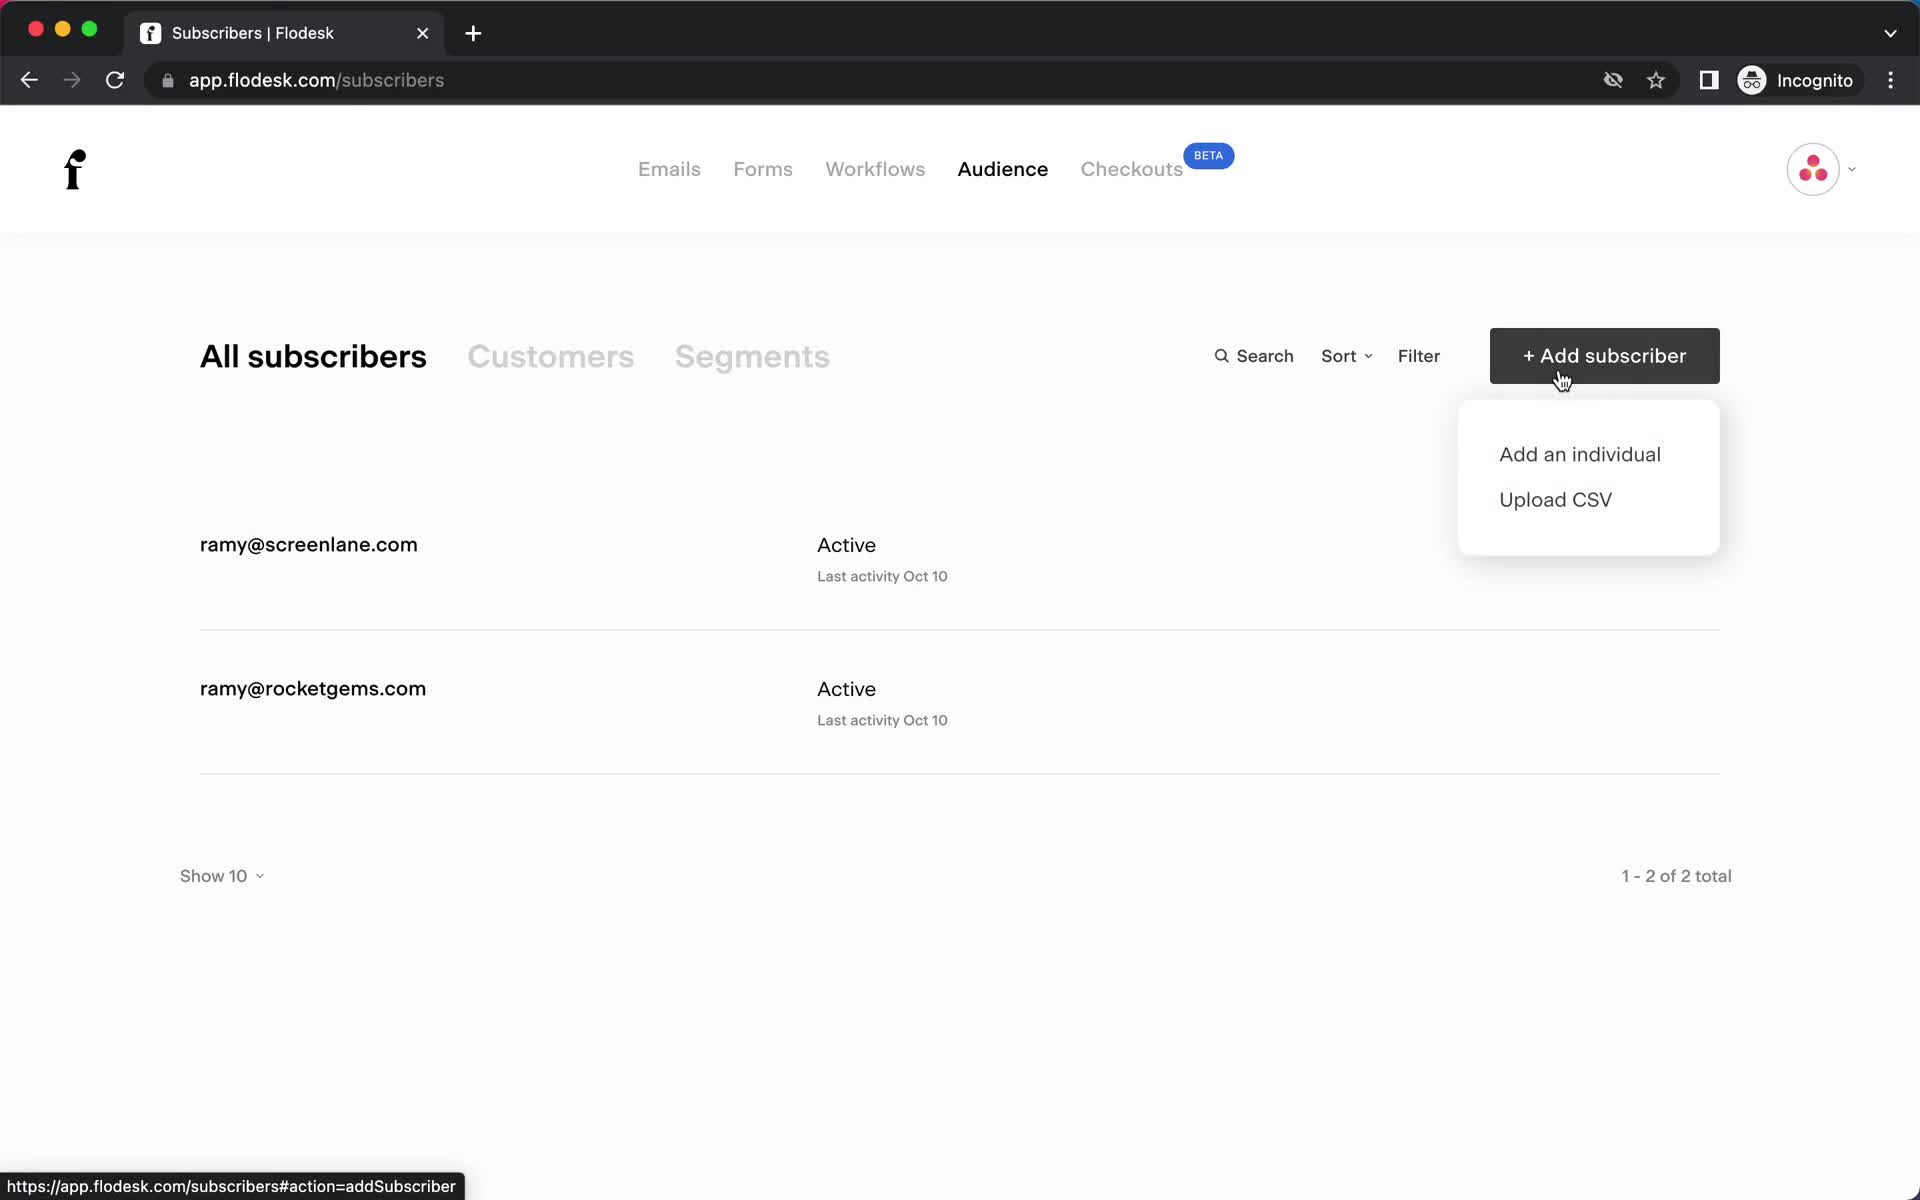
Create menu
this is title
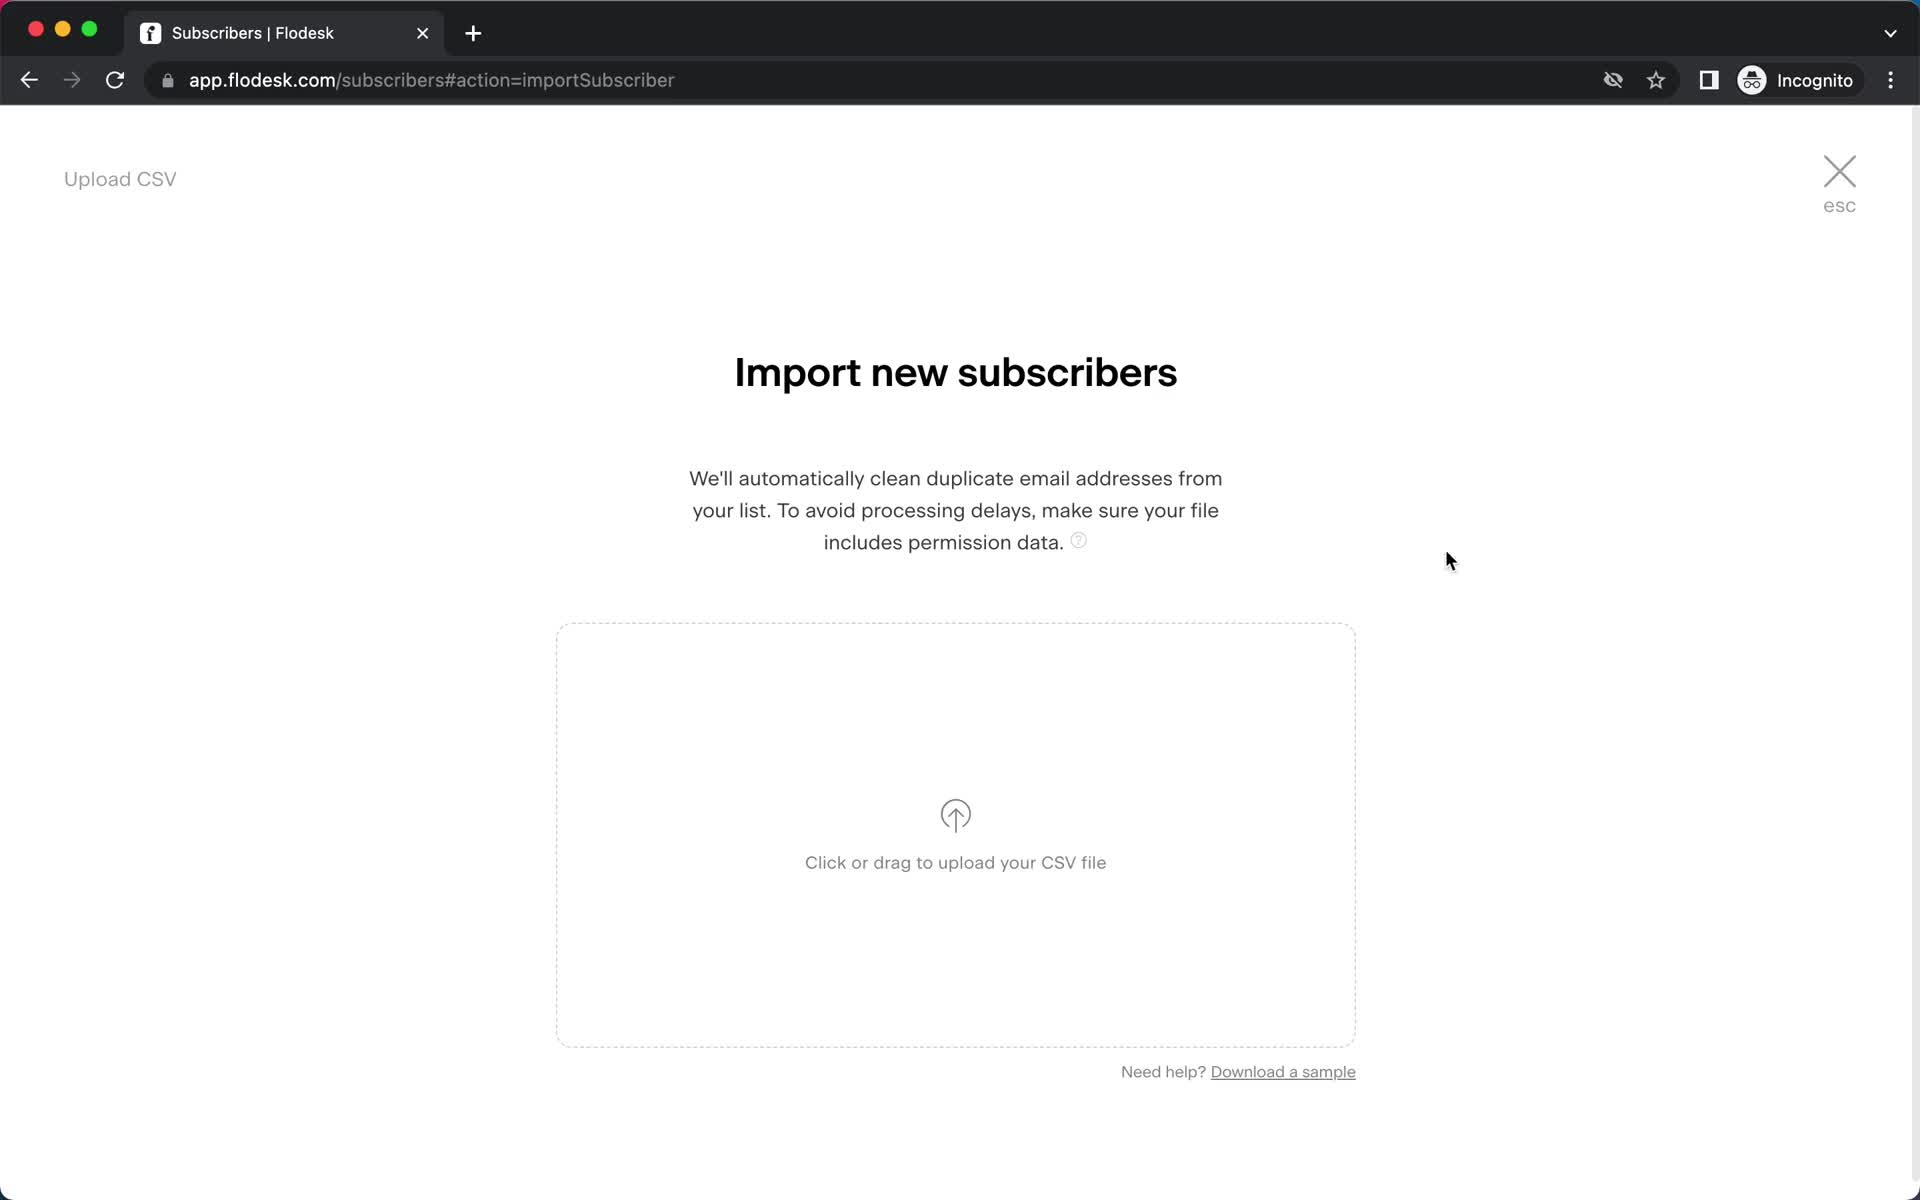
Import CSV
this is title
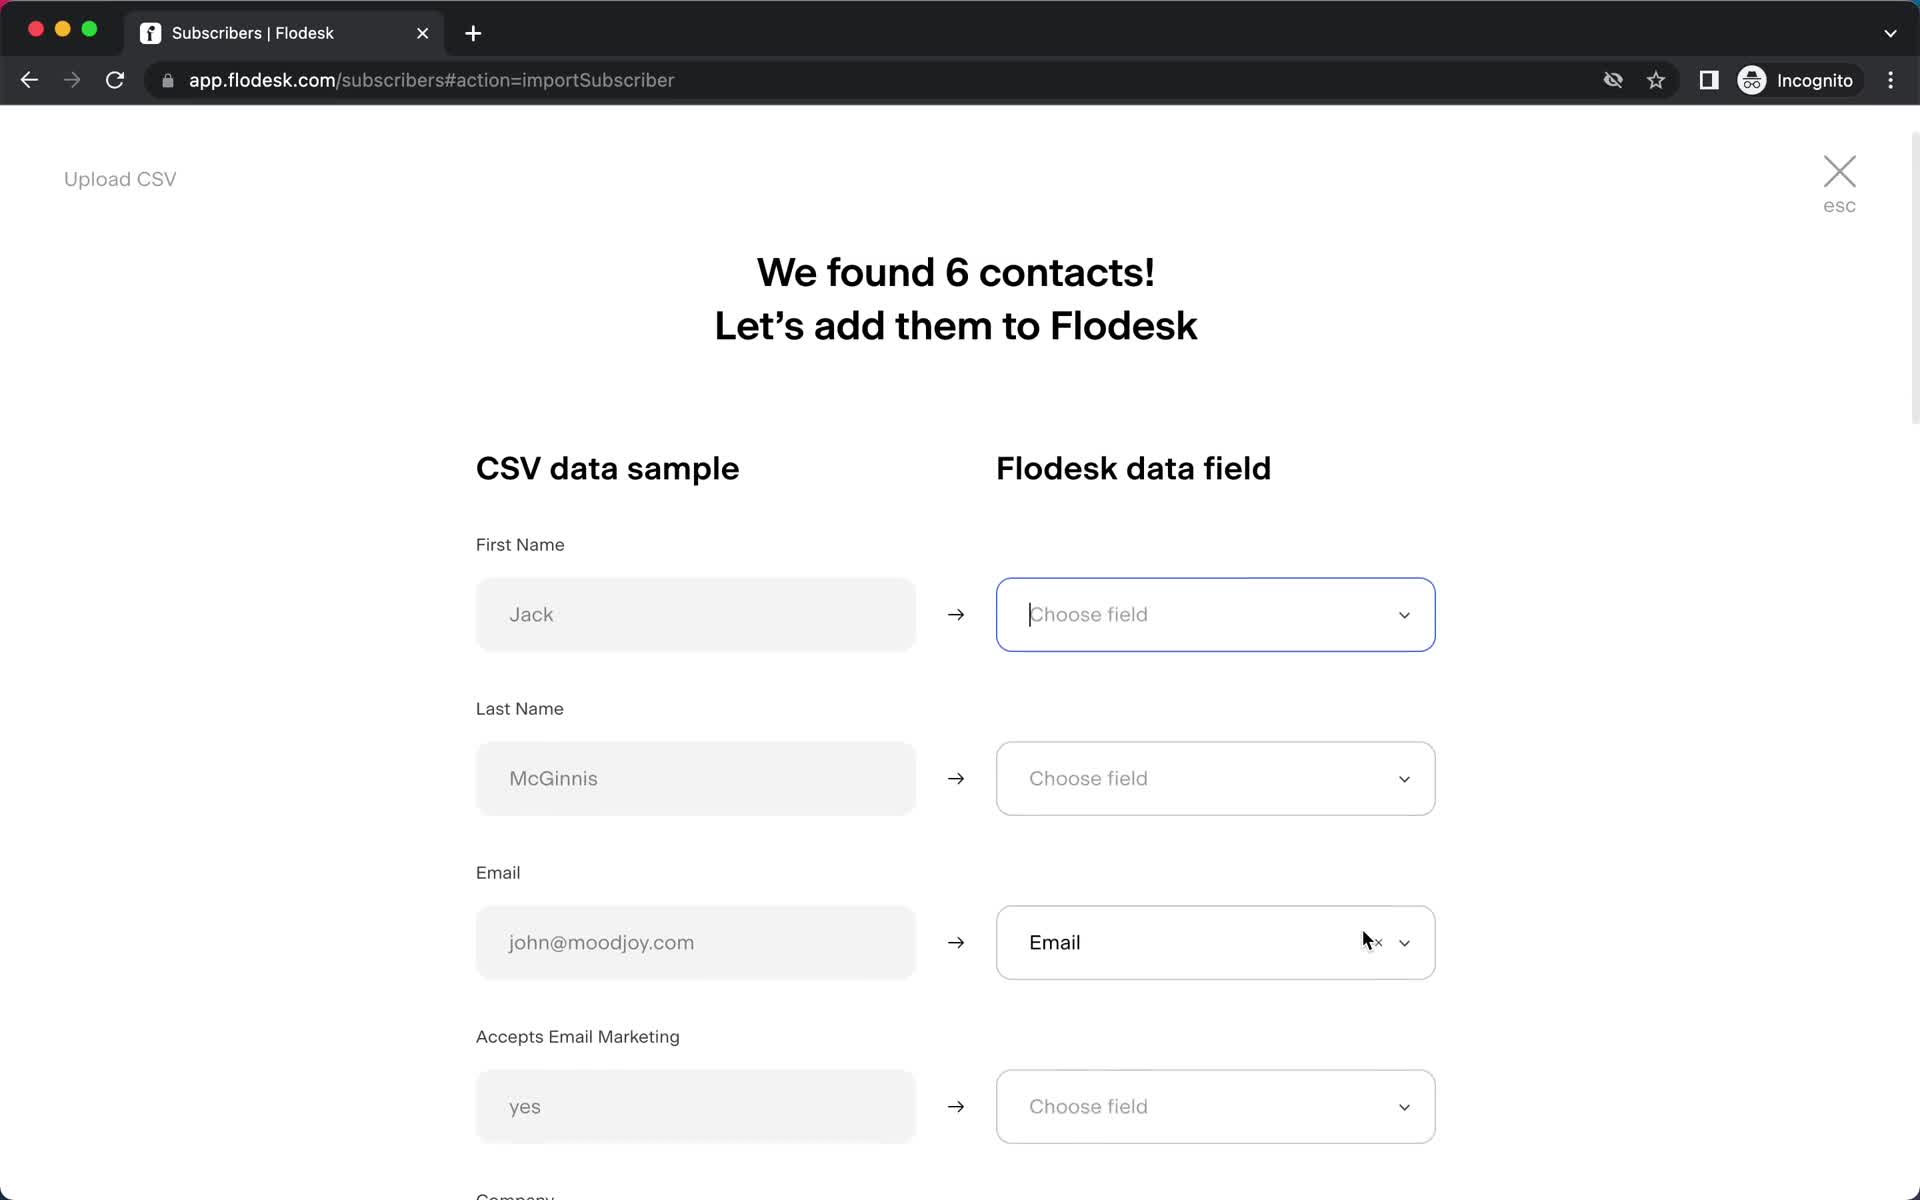
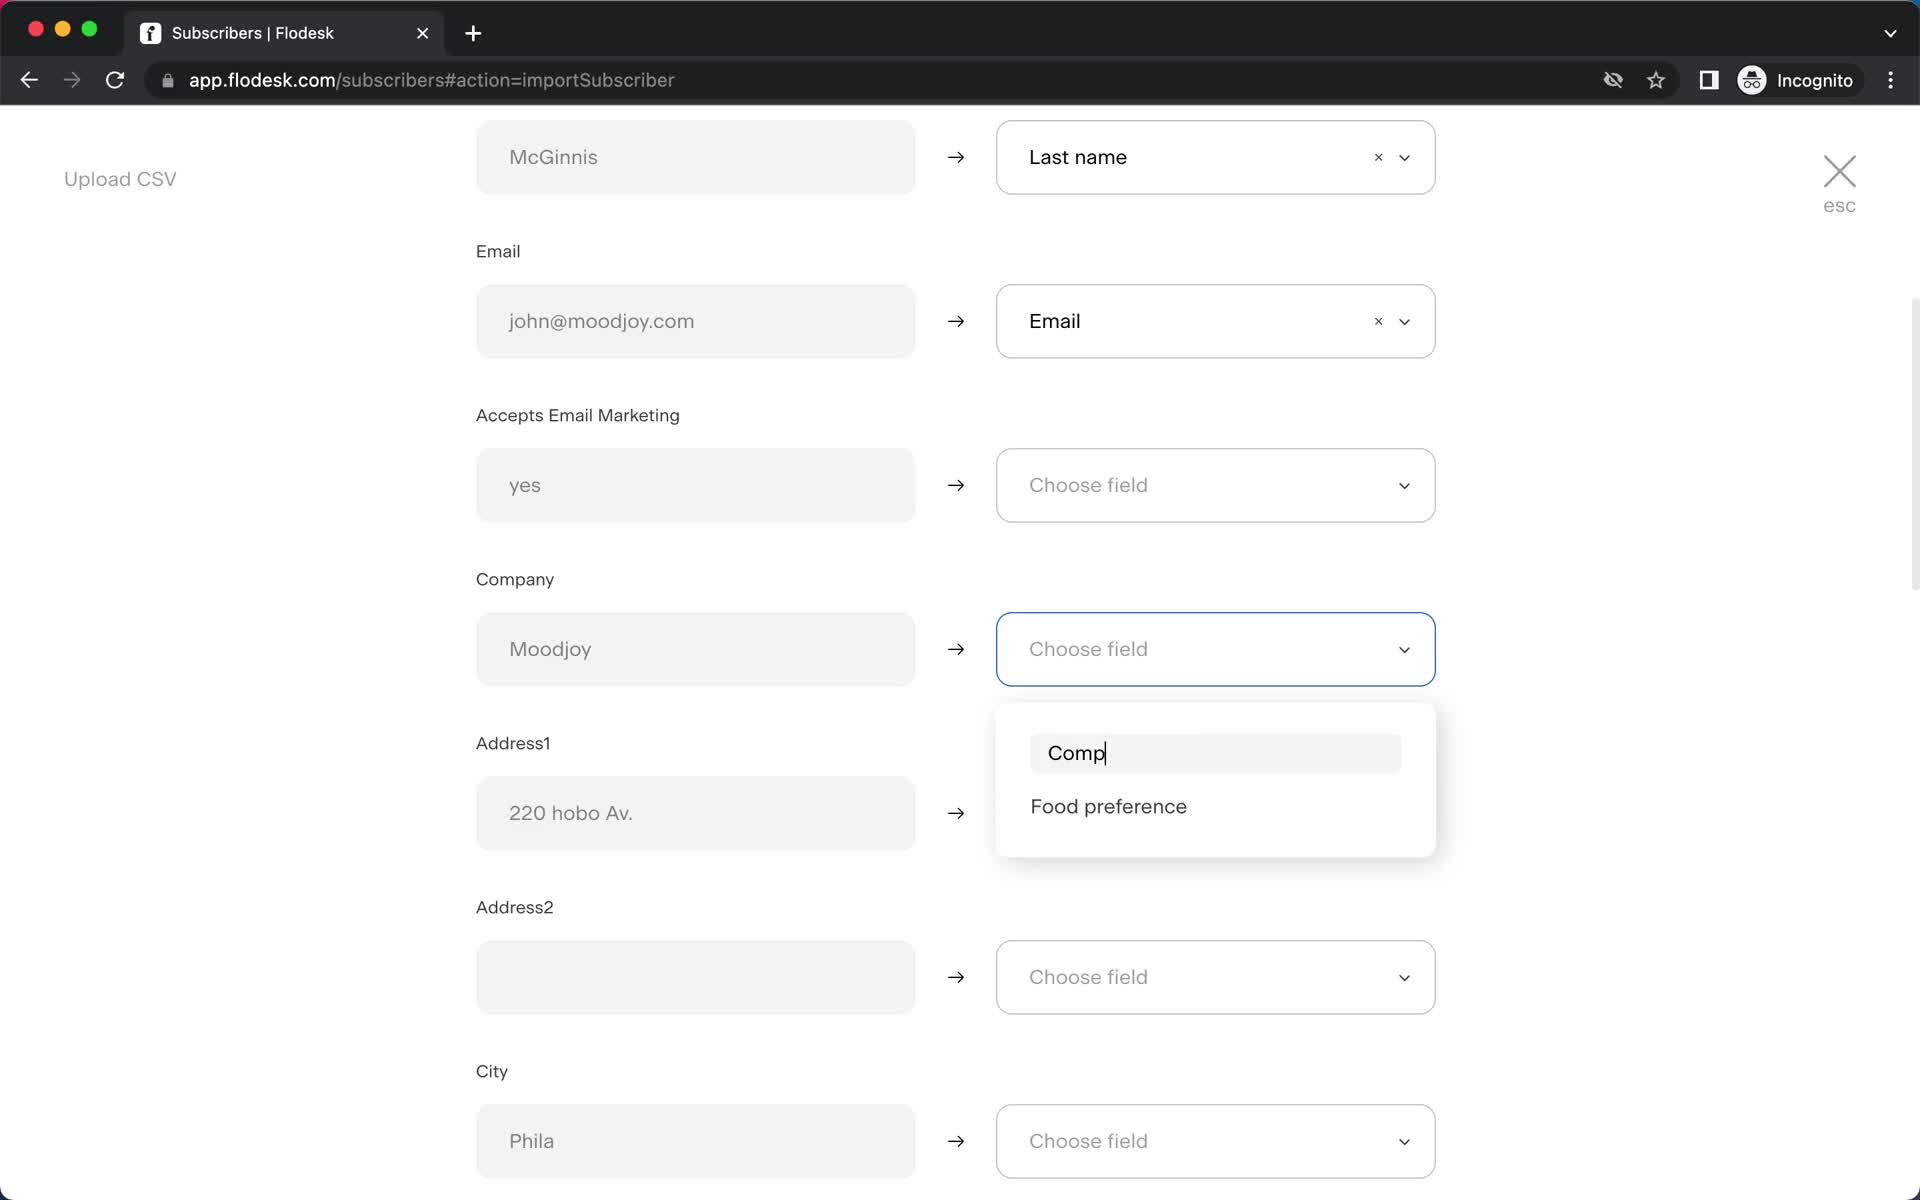
Map fields
this is title
Map fields
this is title
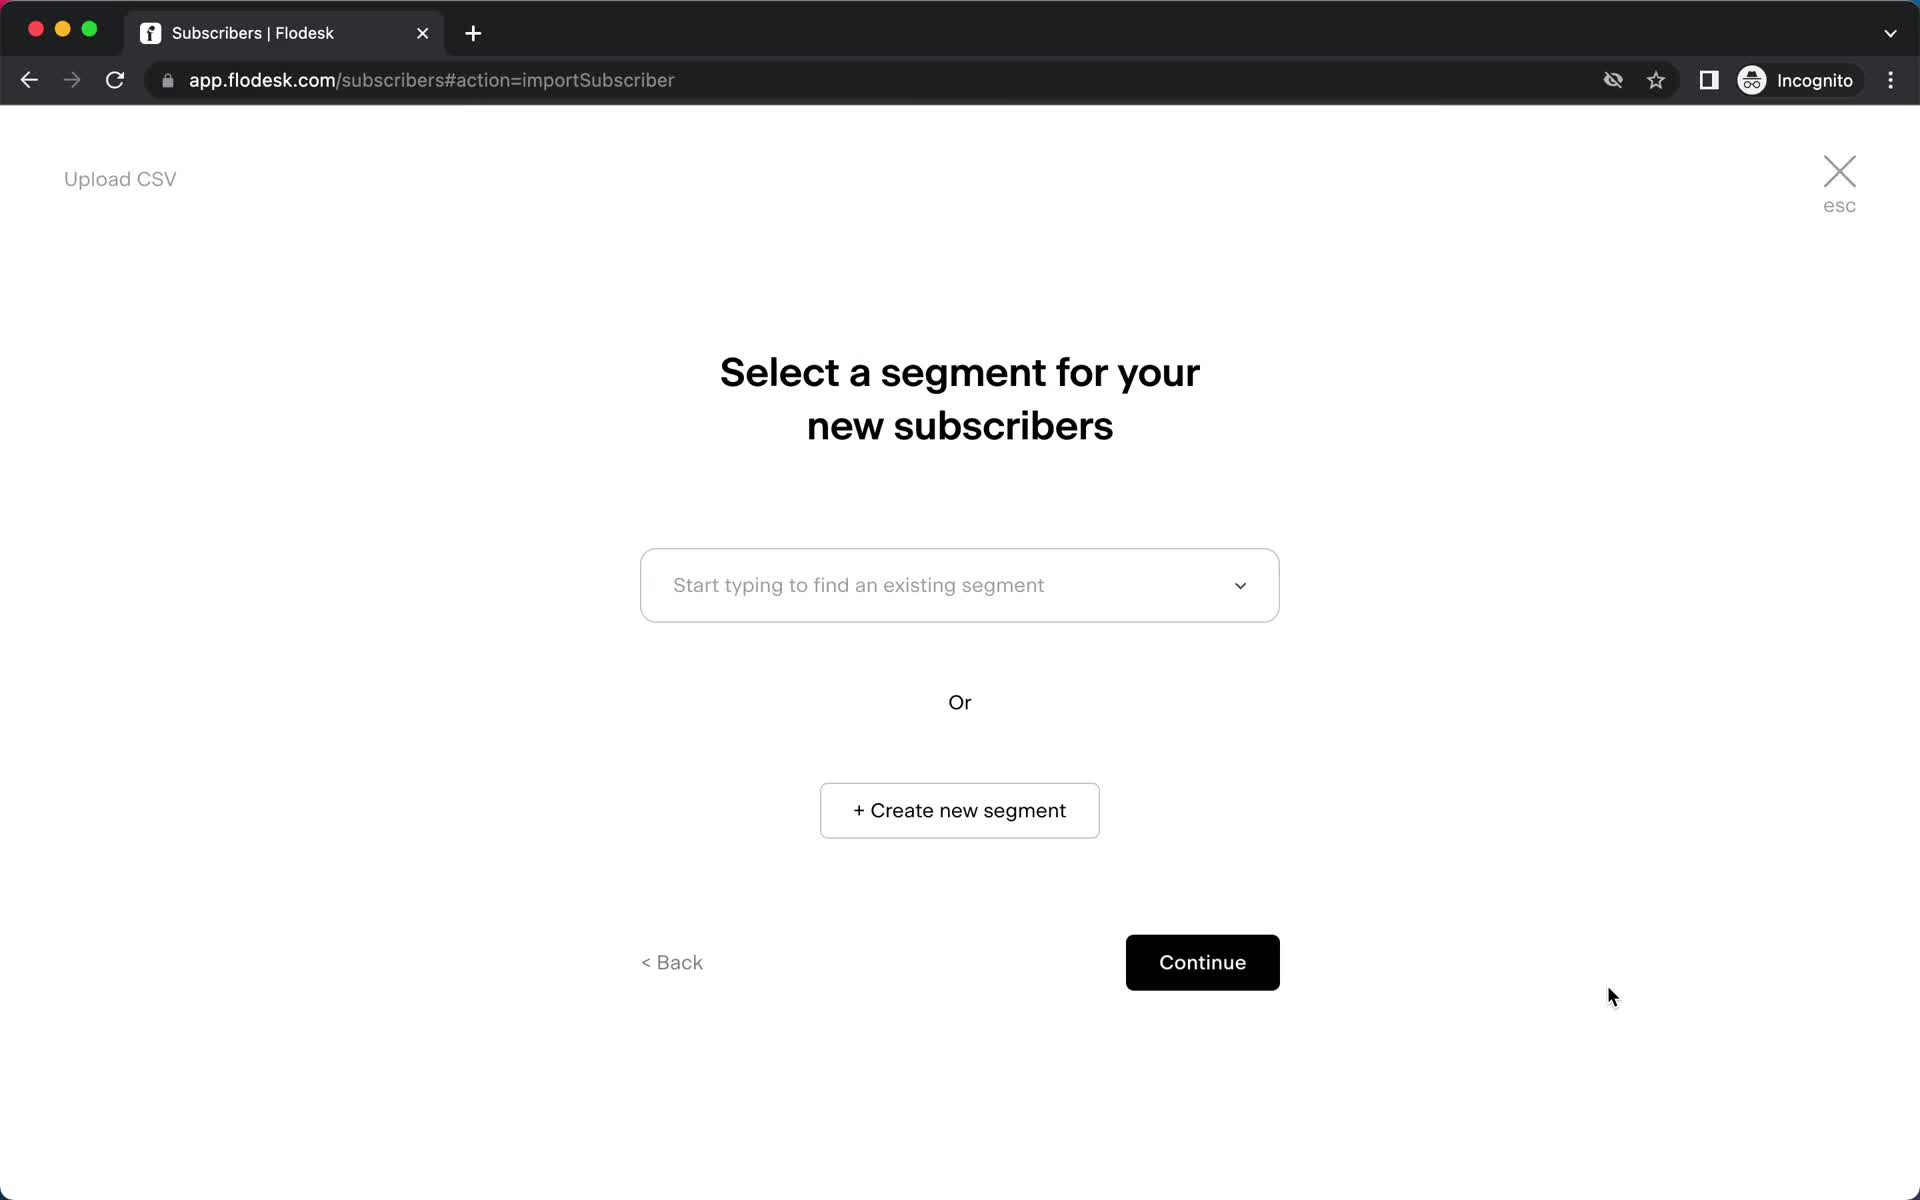
Add to segment
this is title
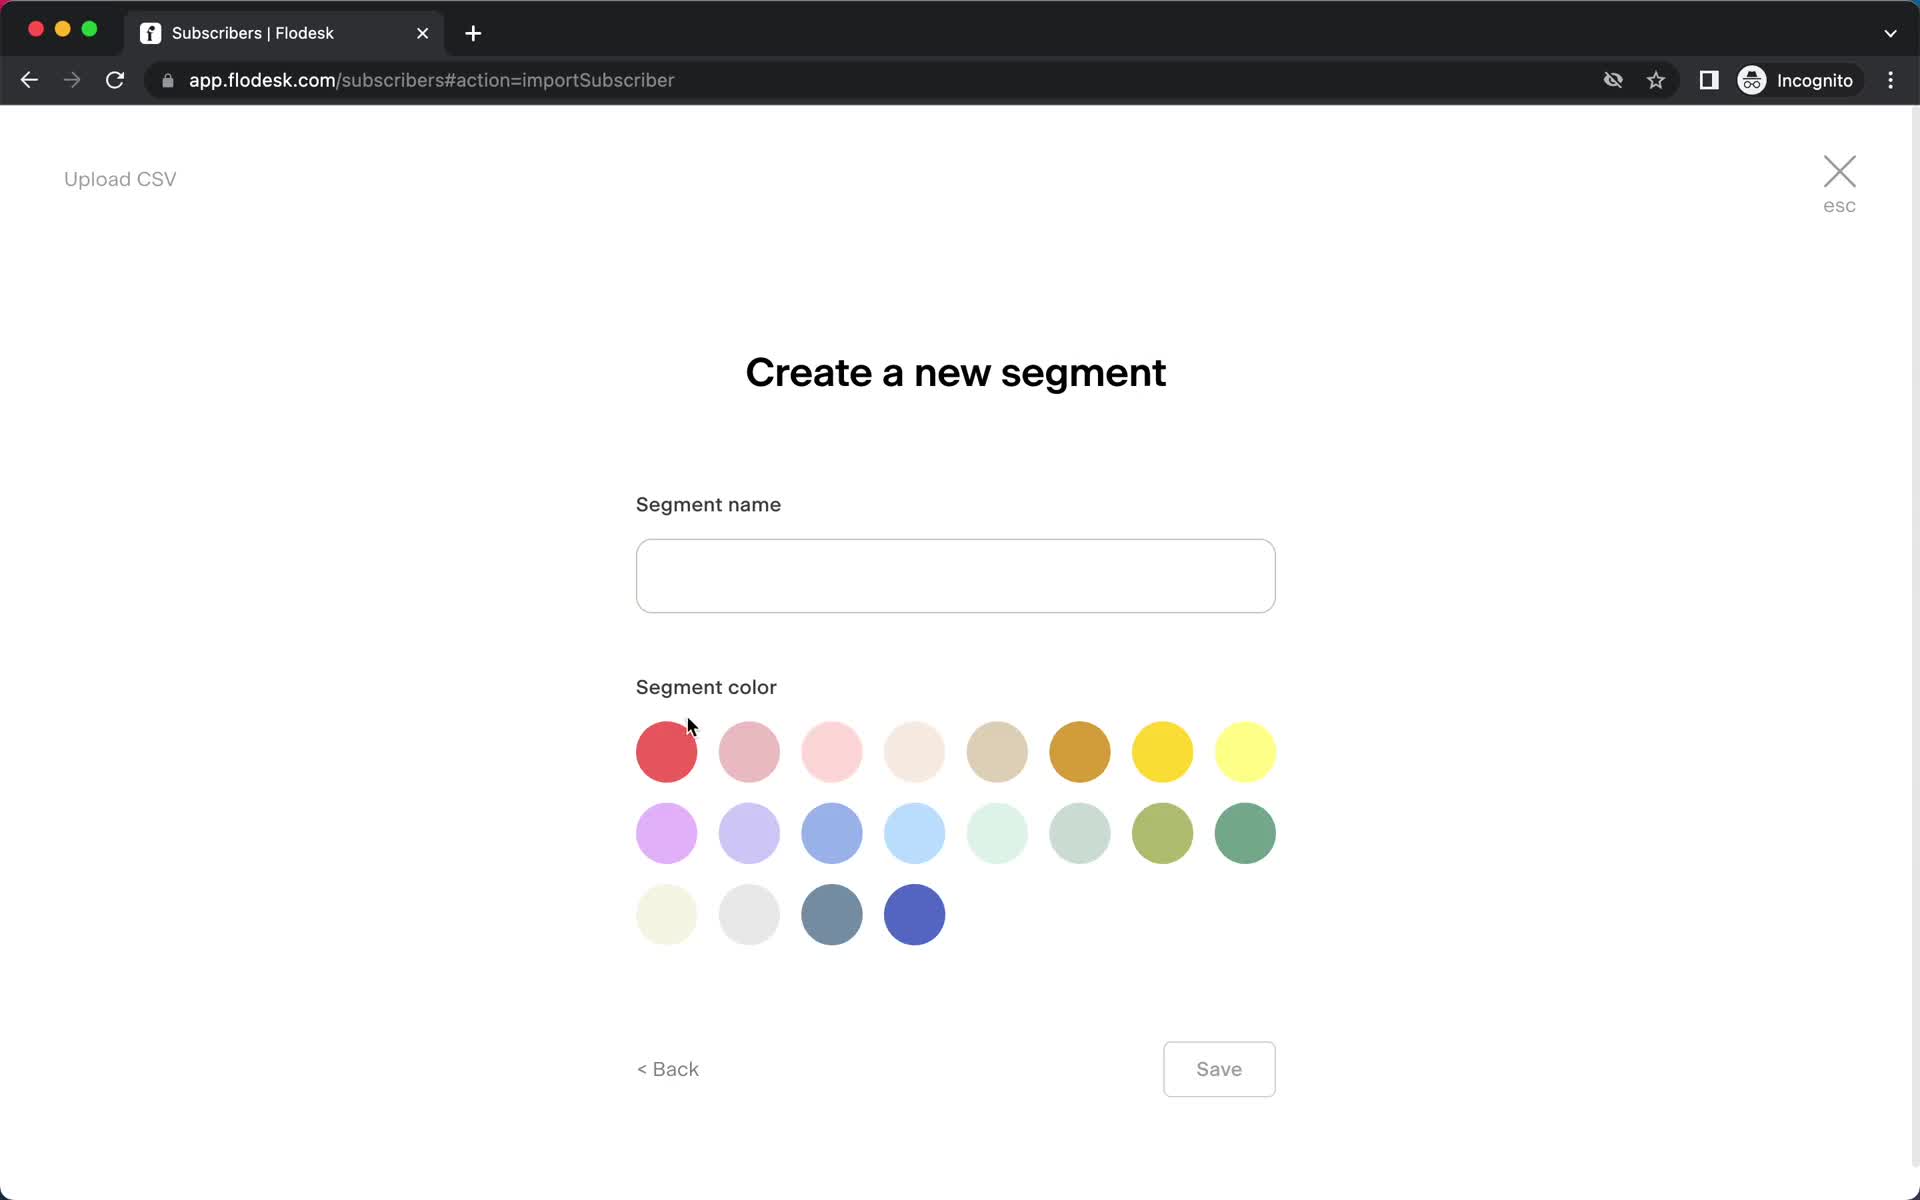
Create segment
this is title
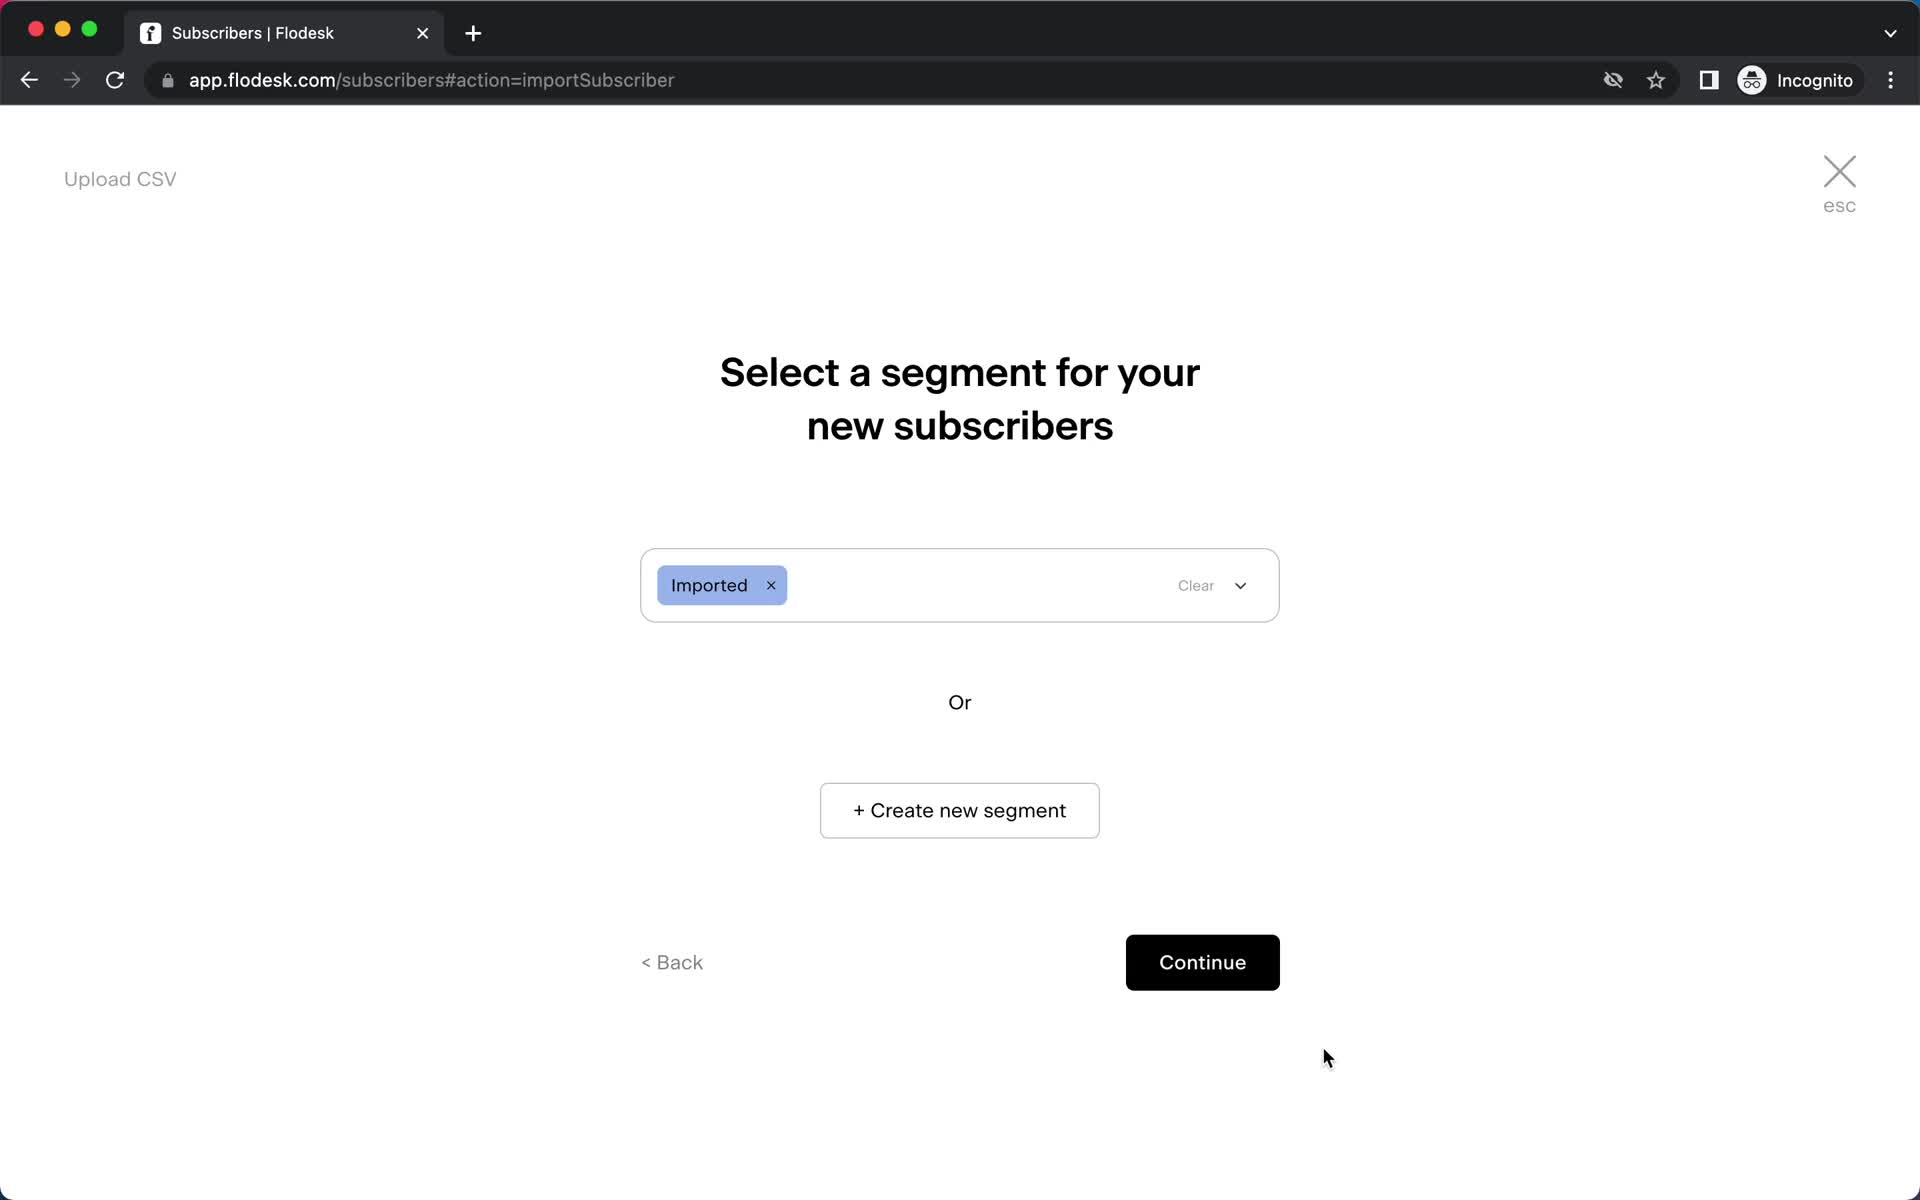
Add to segment
this is title
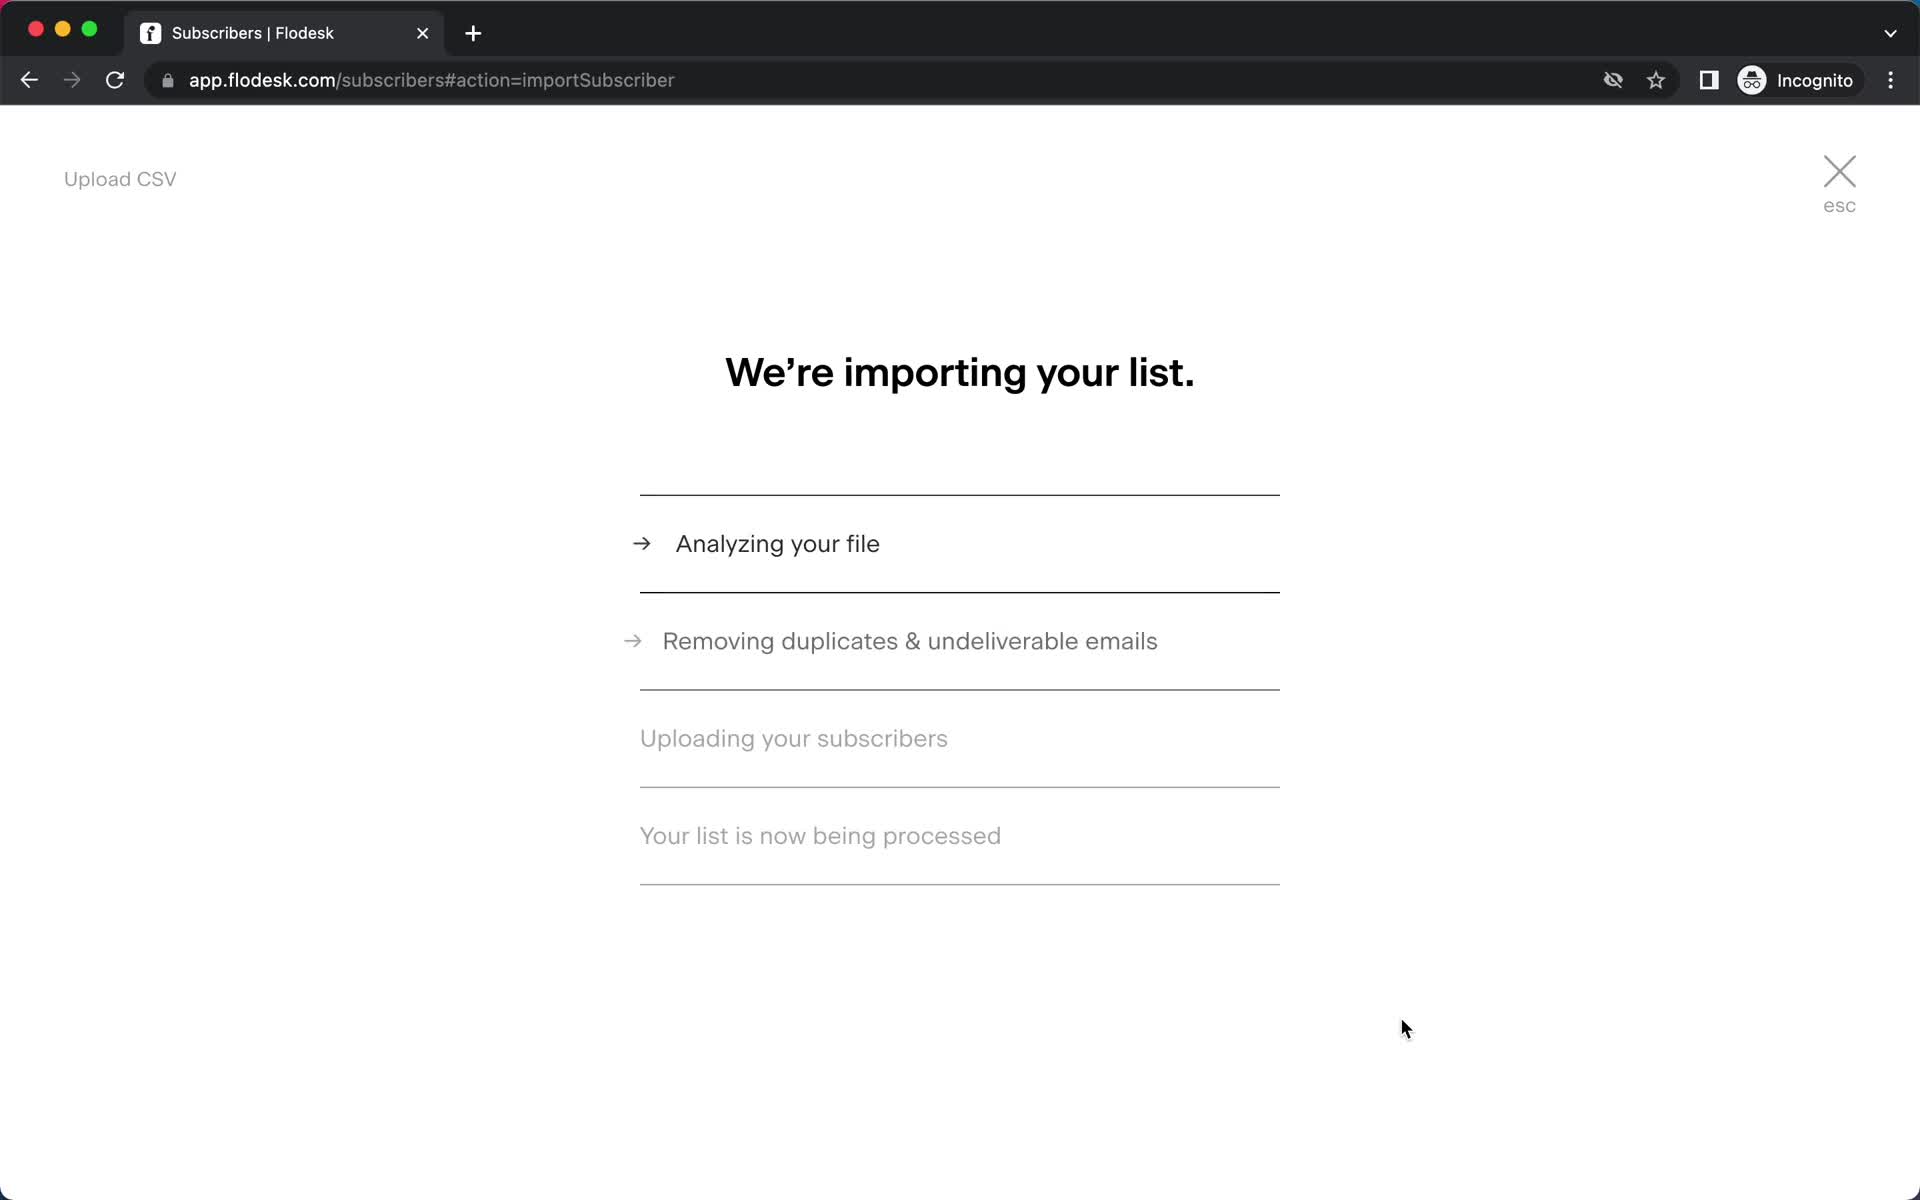
Import in progress
this is title
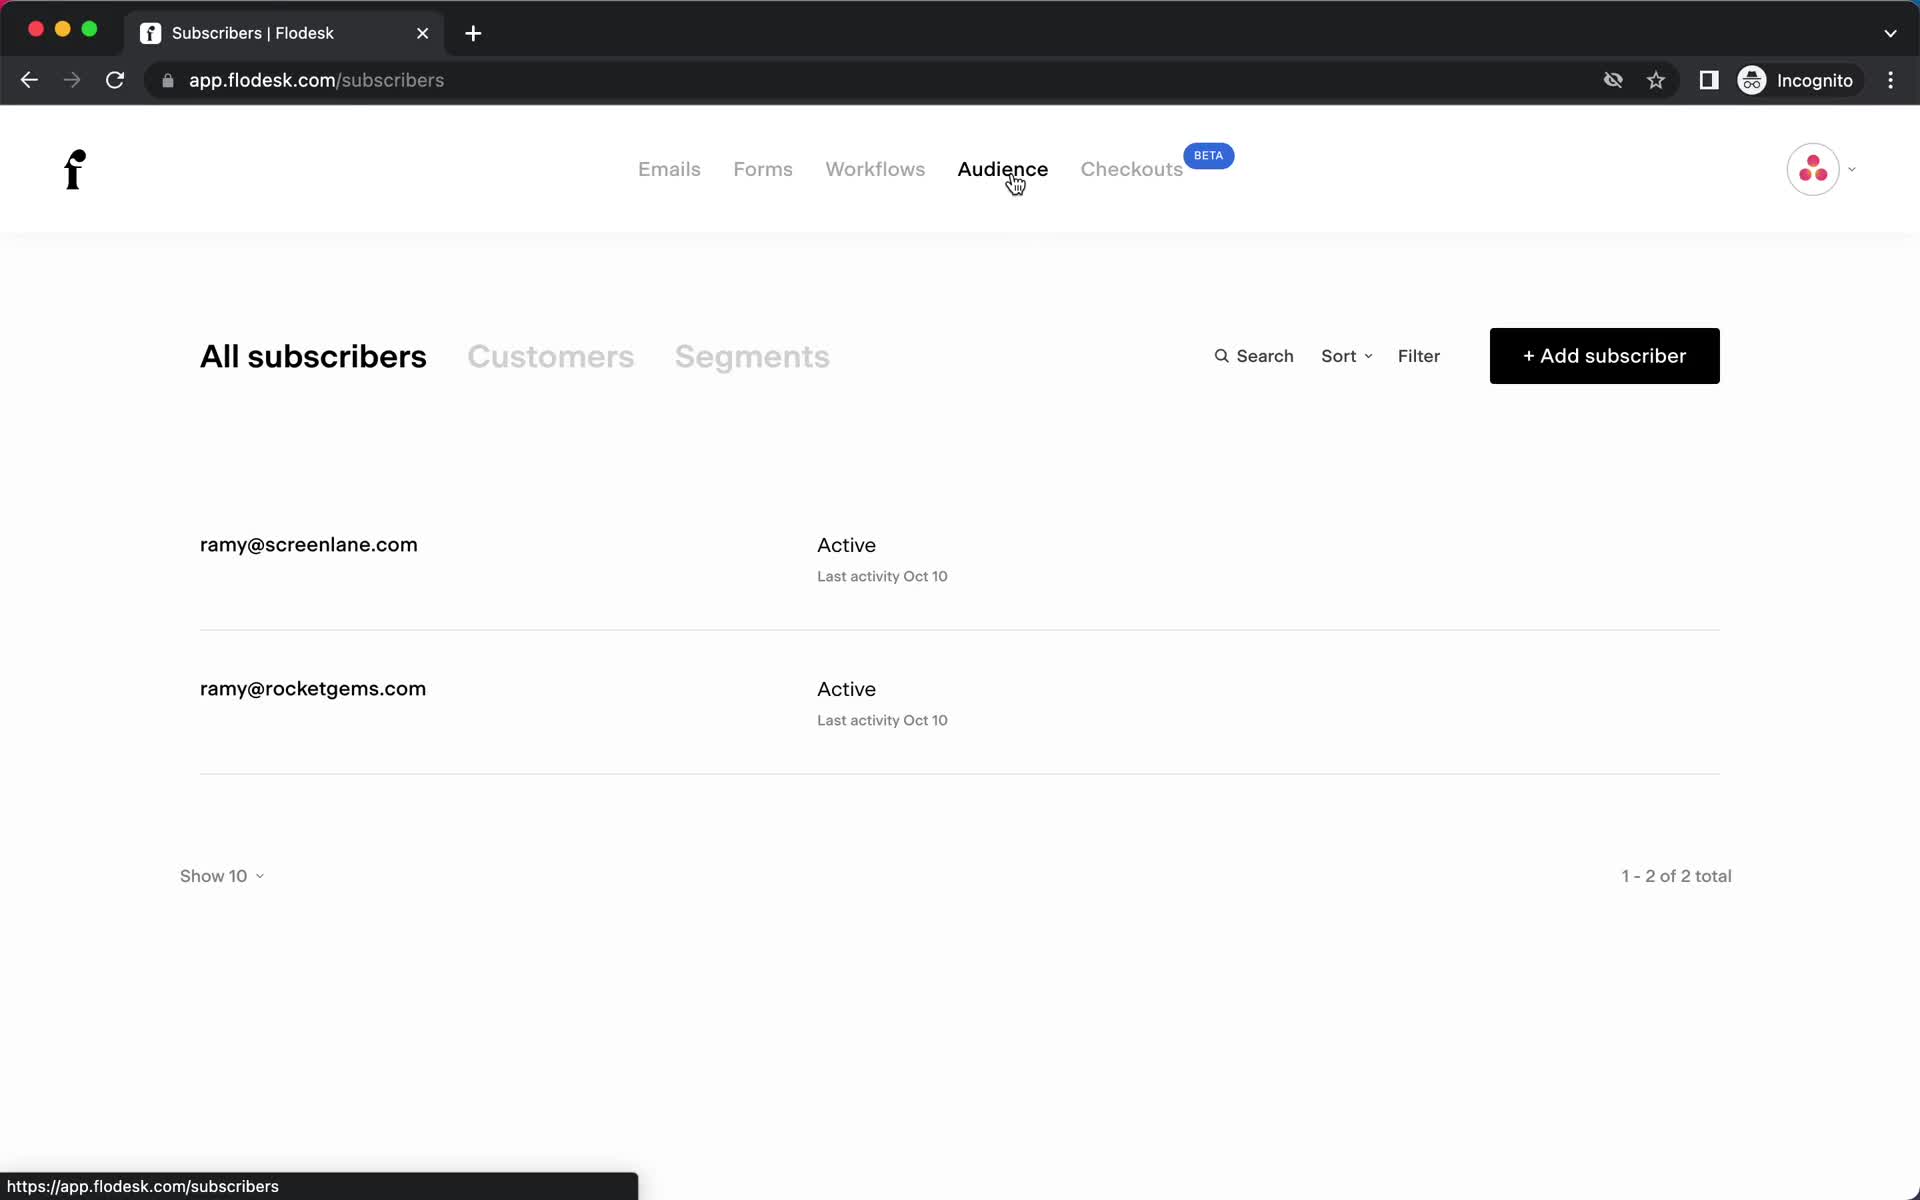
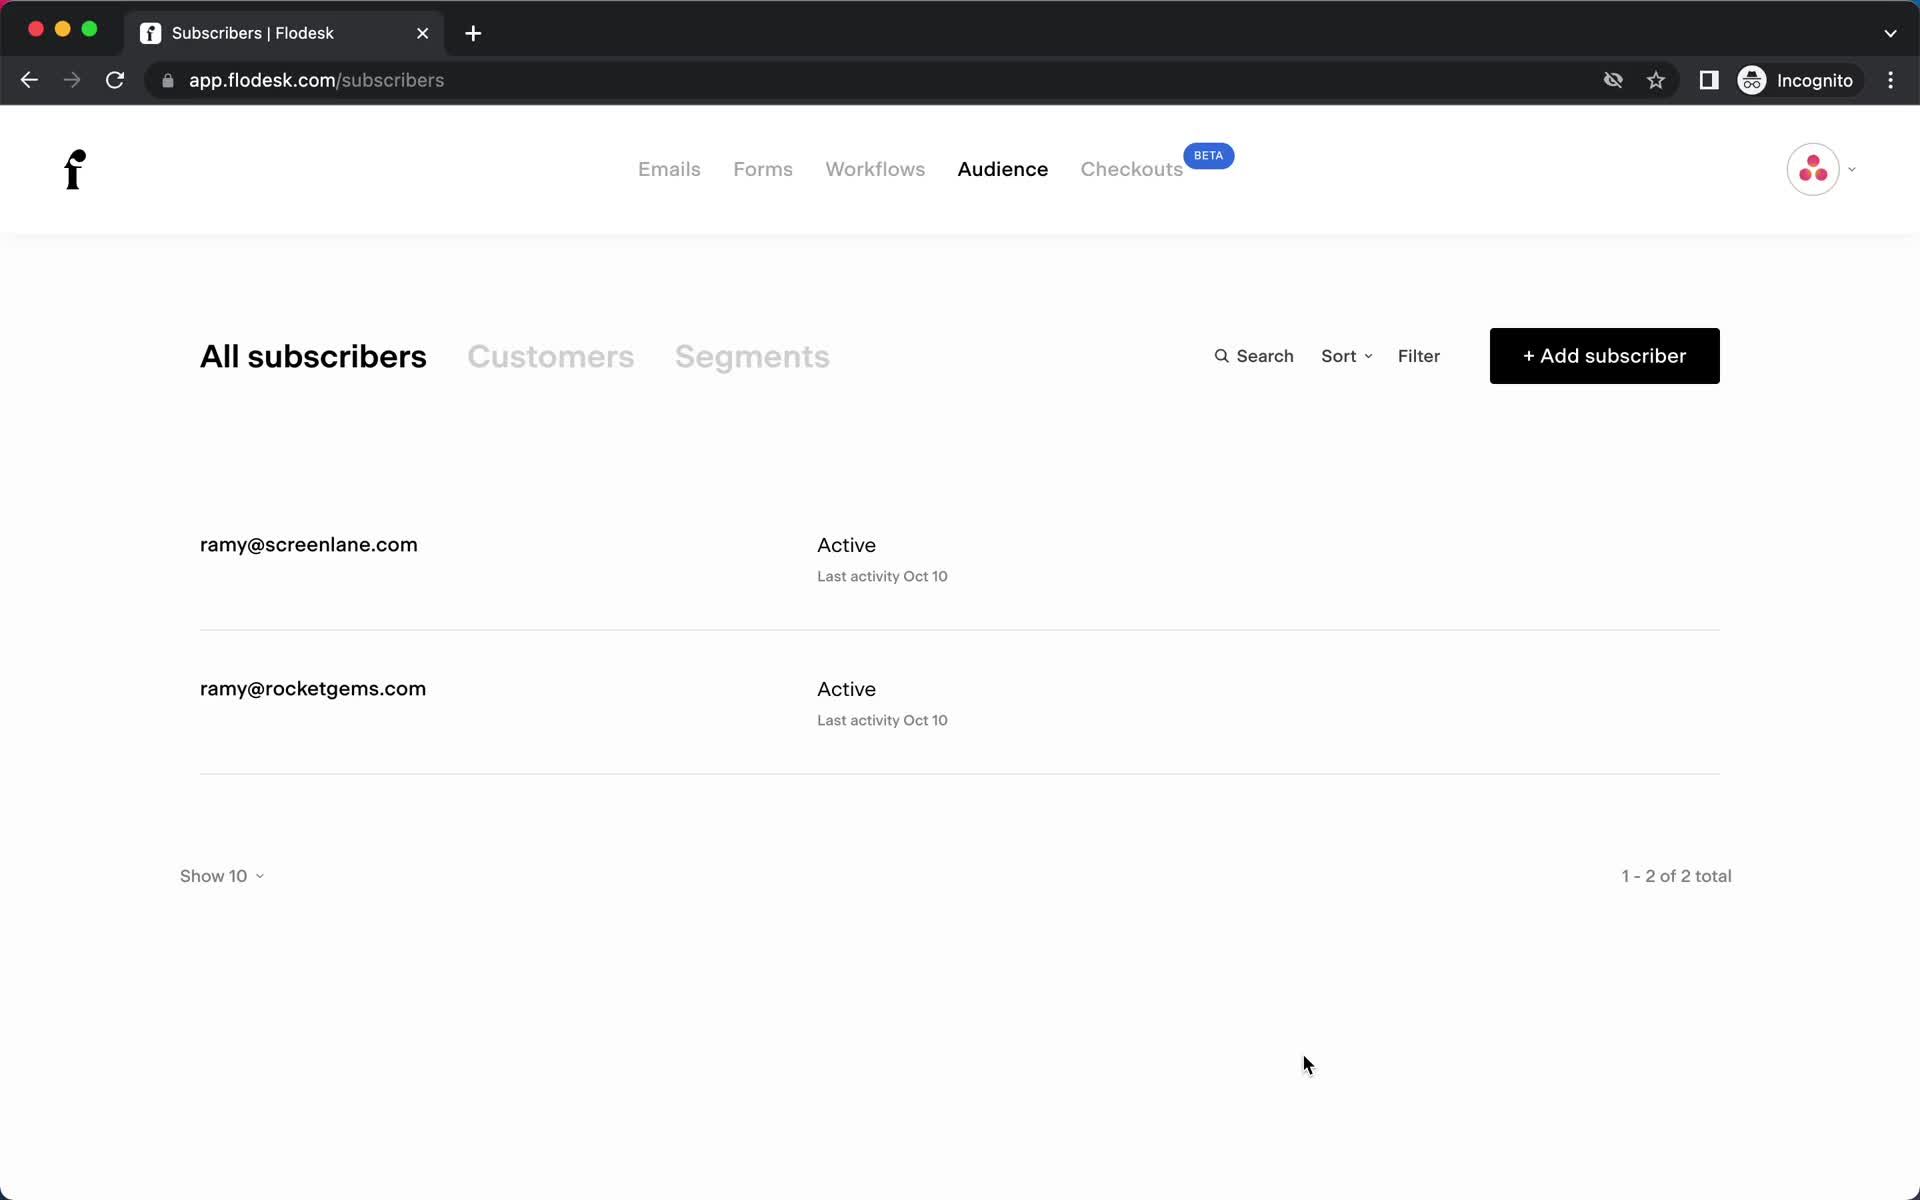
Subscribers
this is title
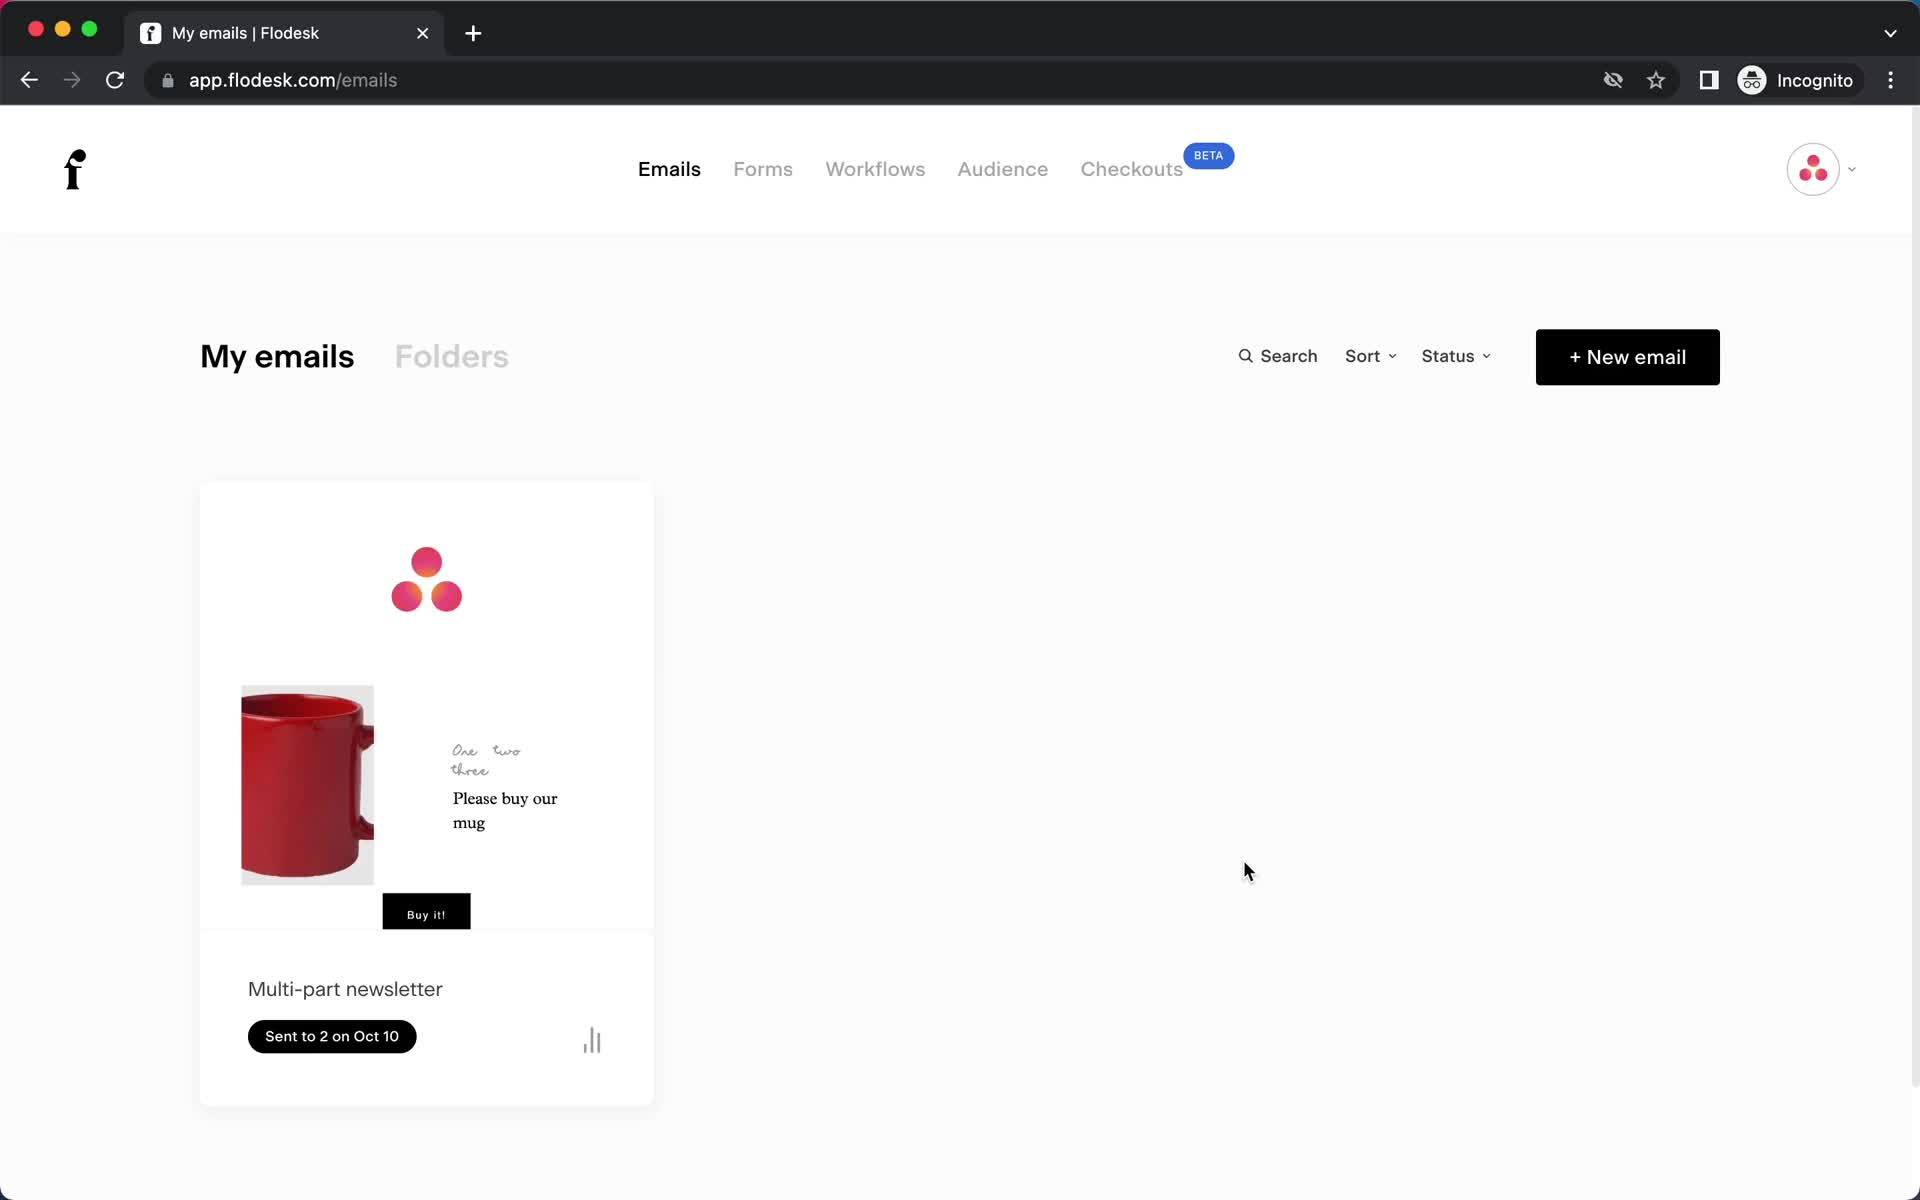
Email campaigns
this is title
Select template
this is title
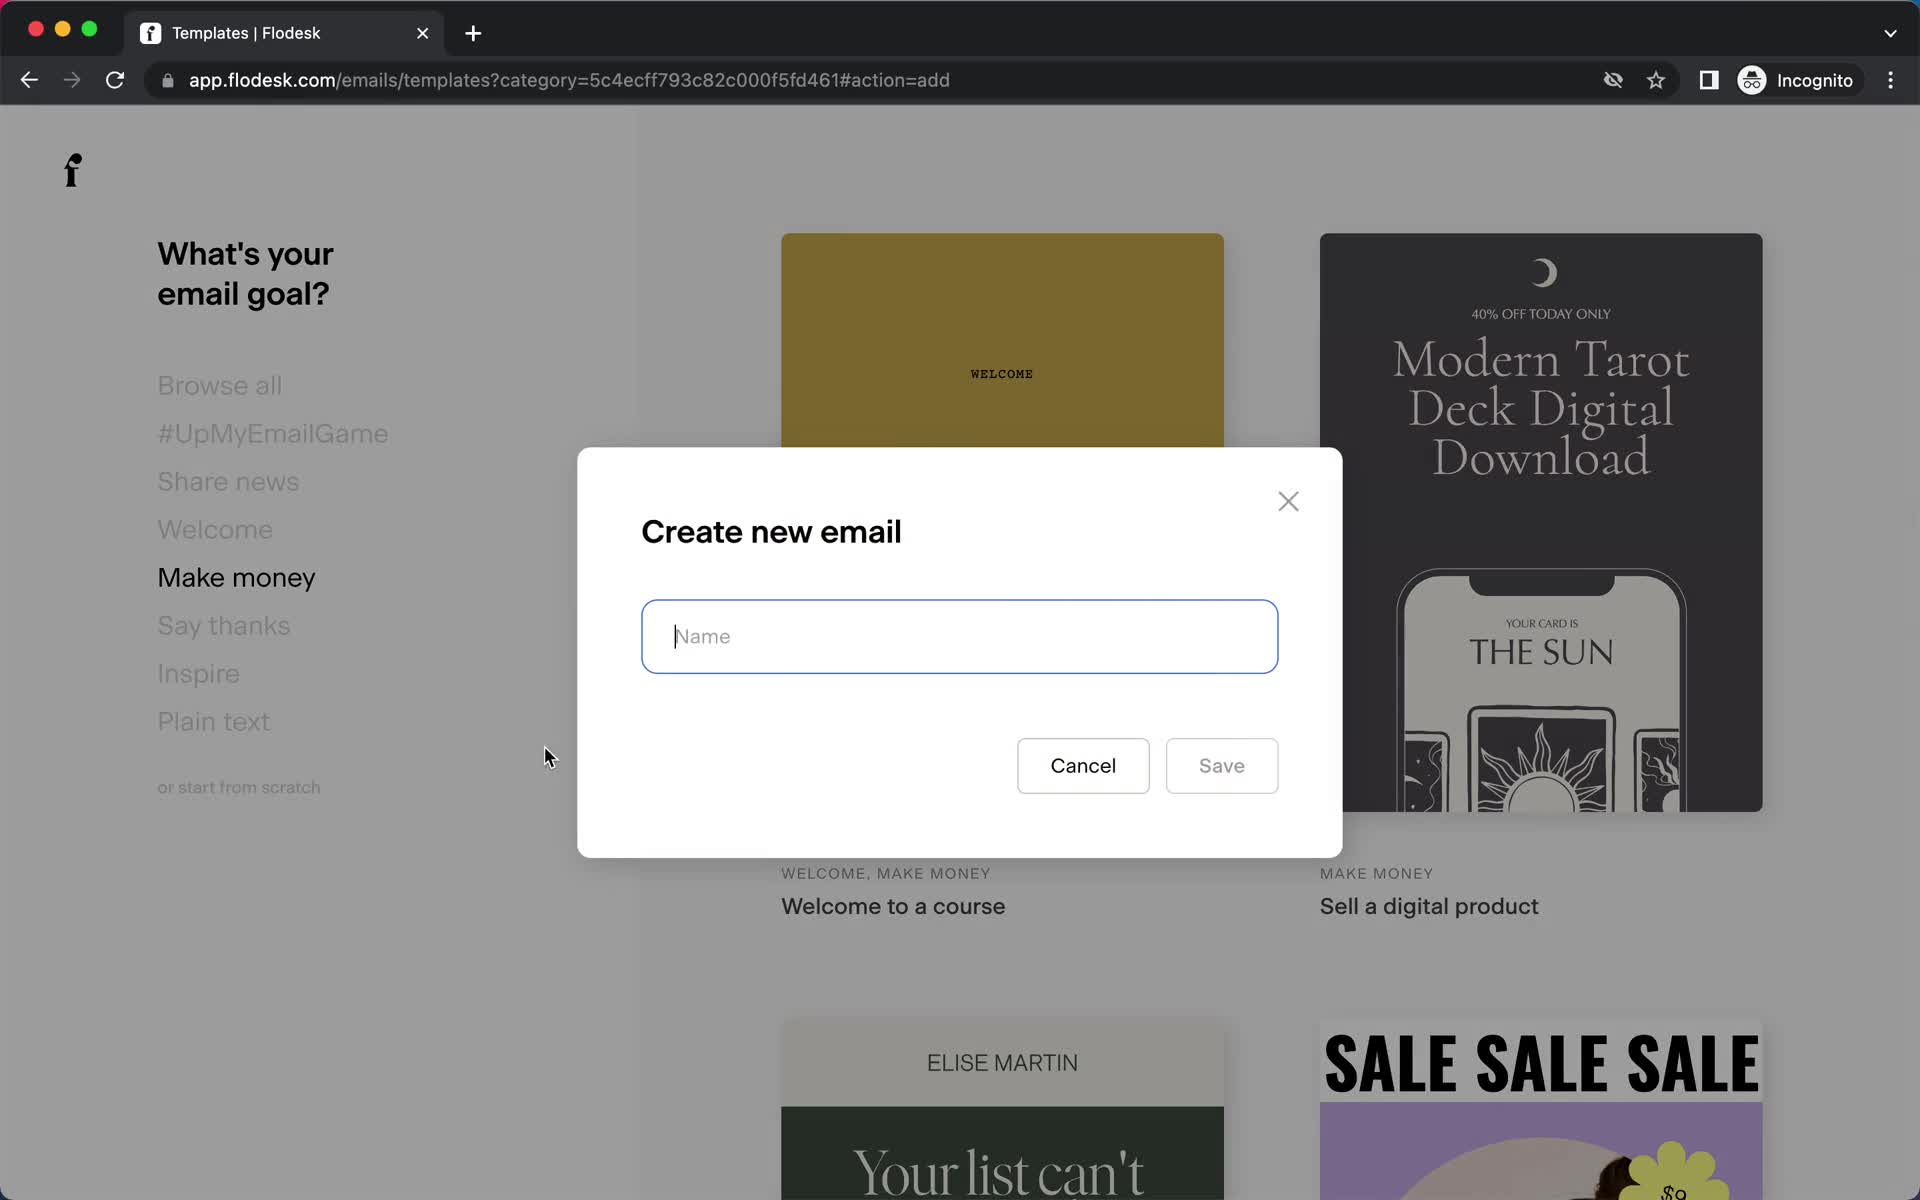
Create email campaign
this is title
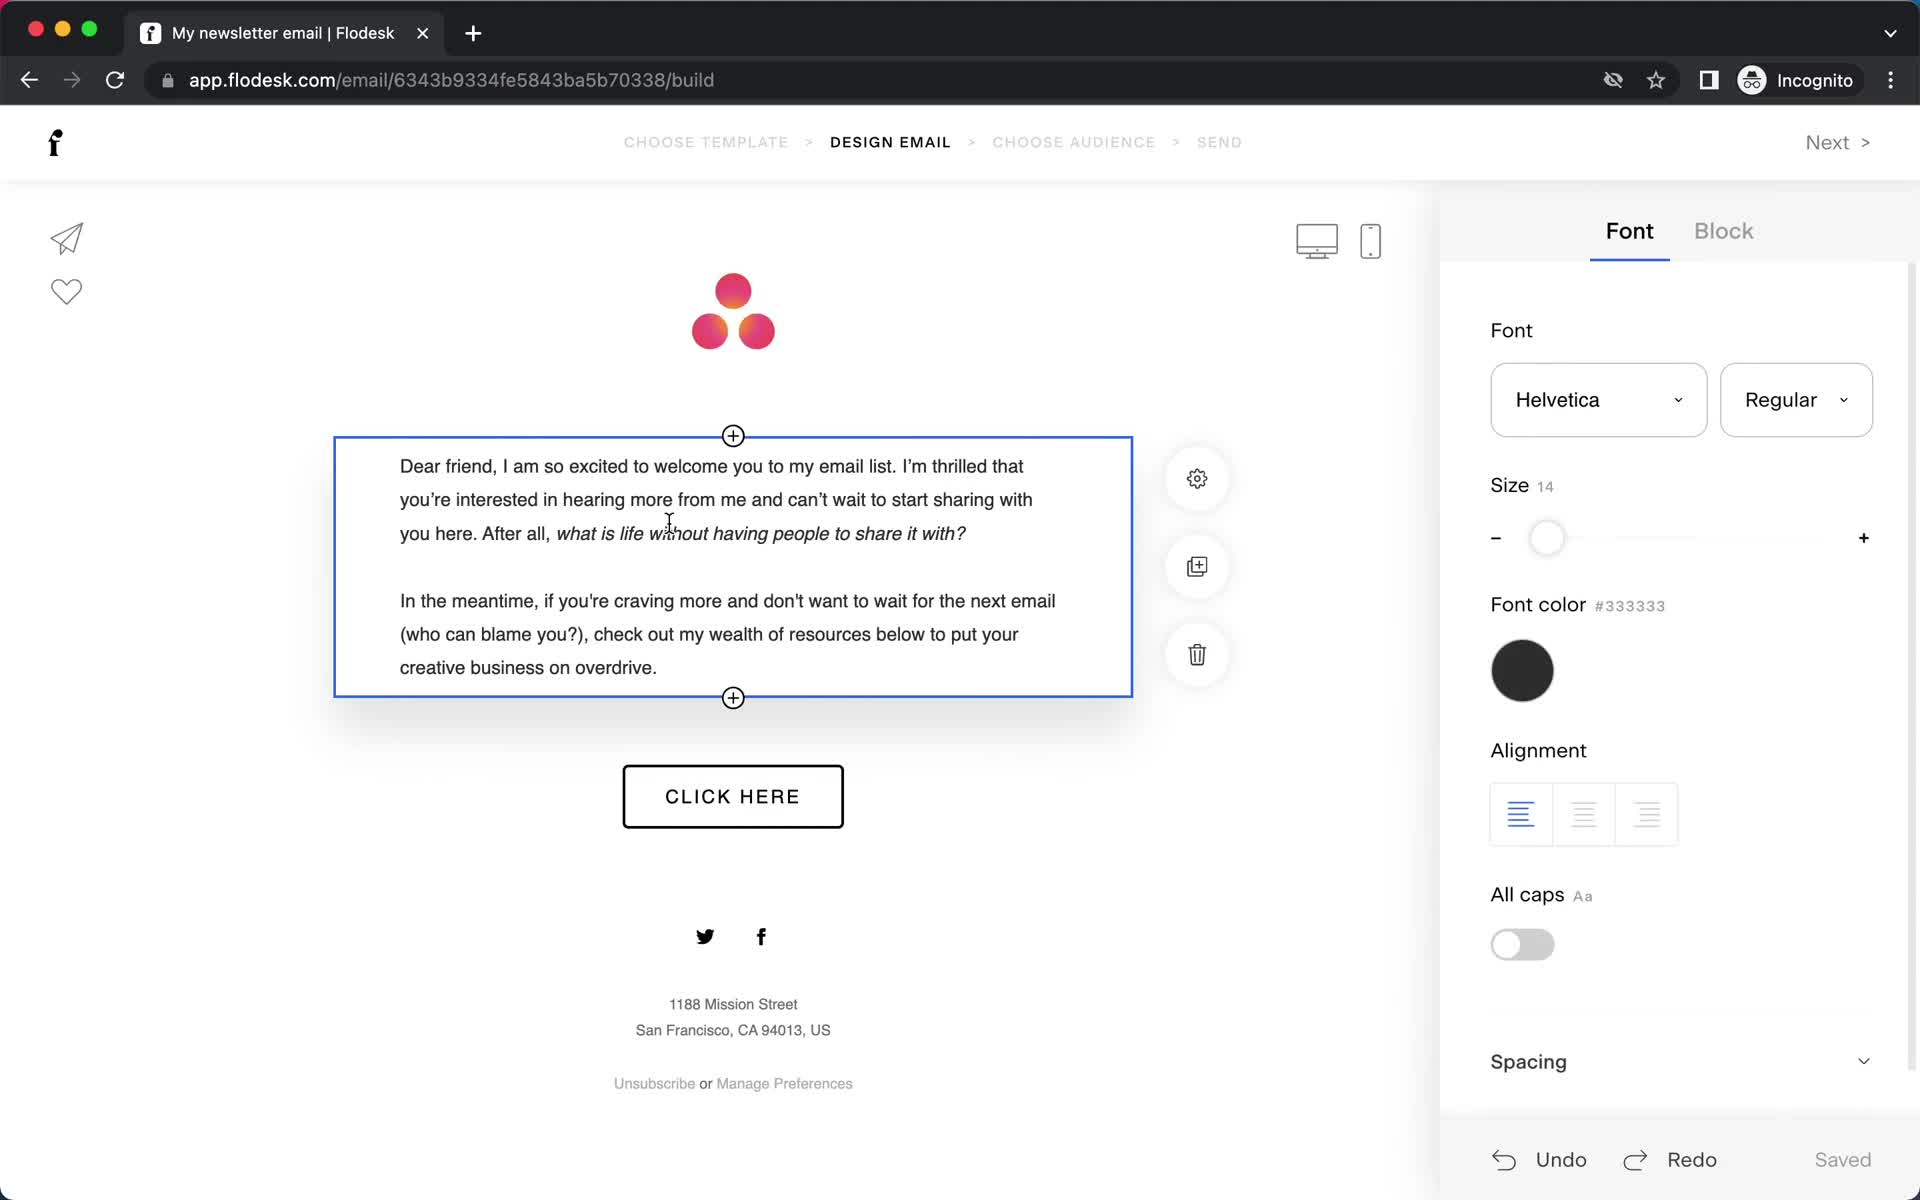
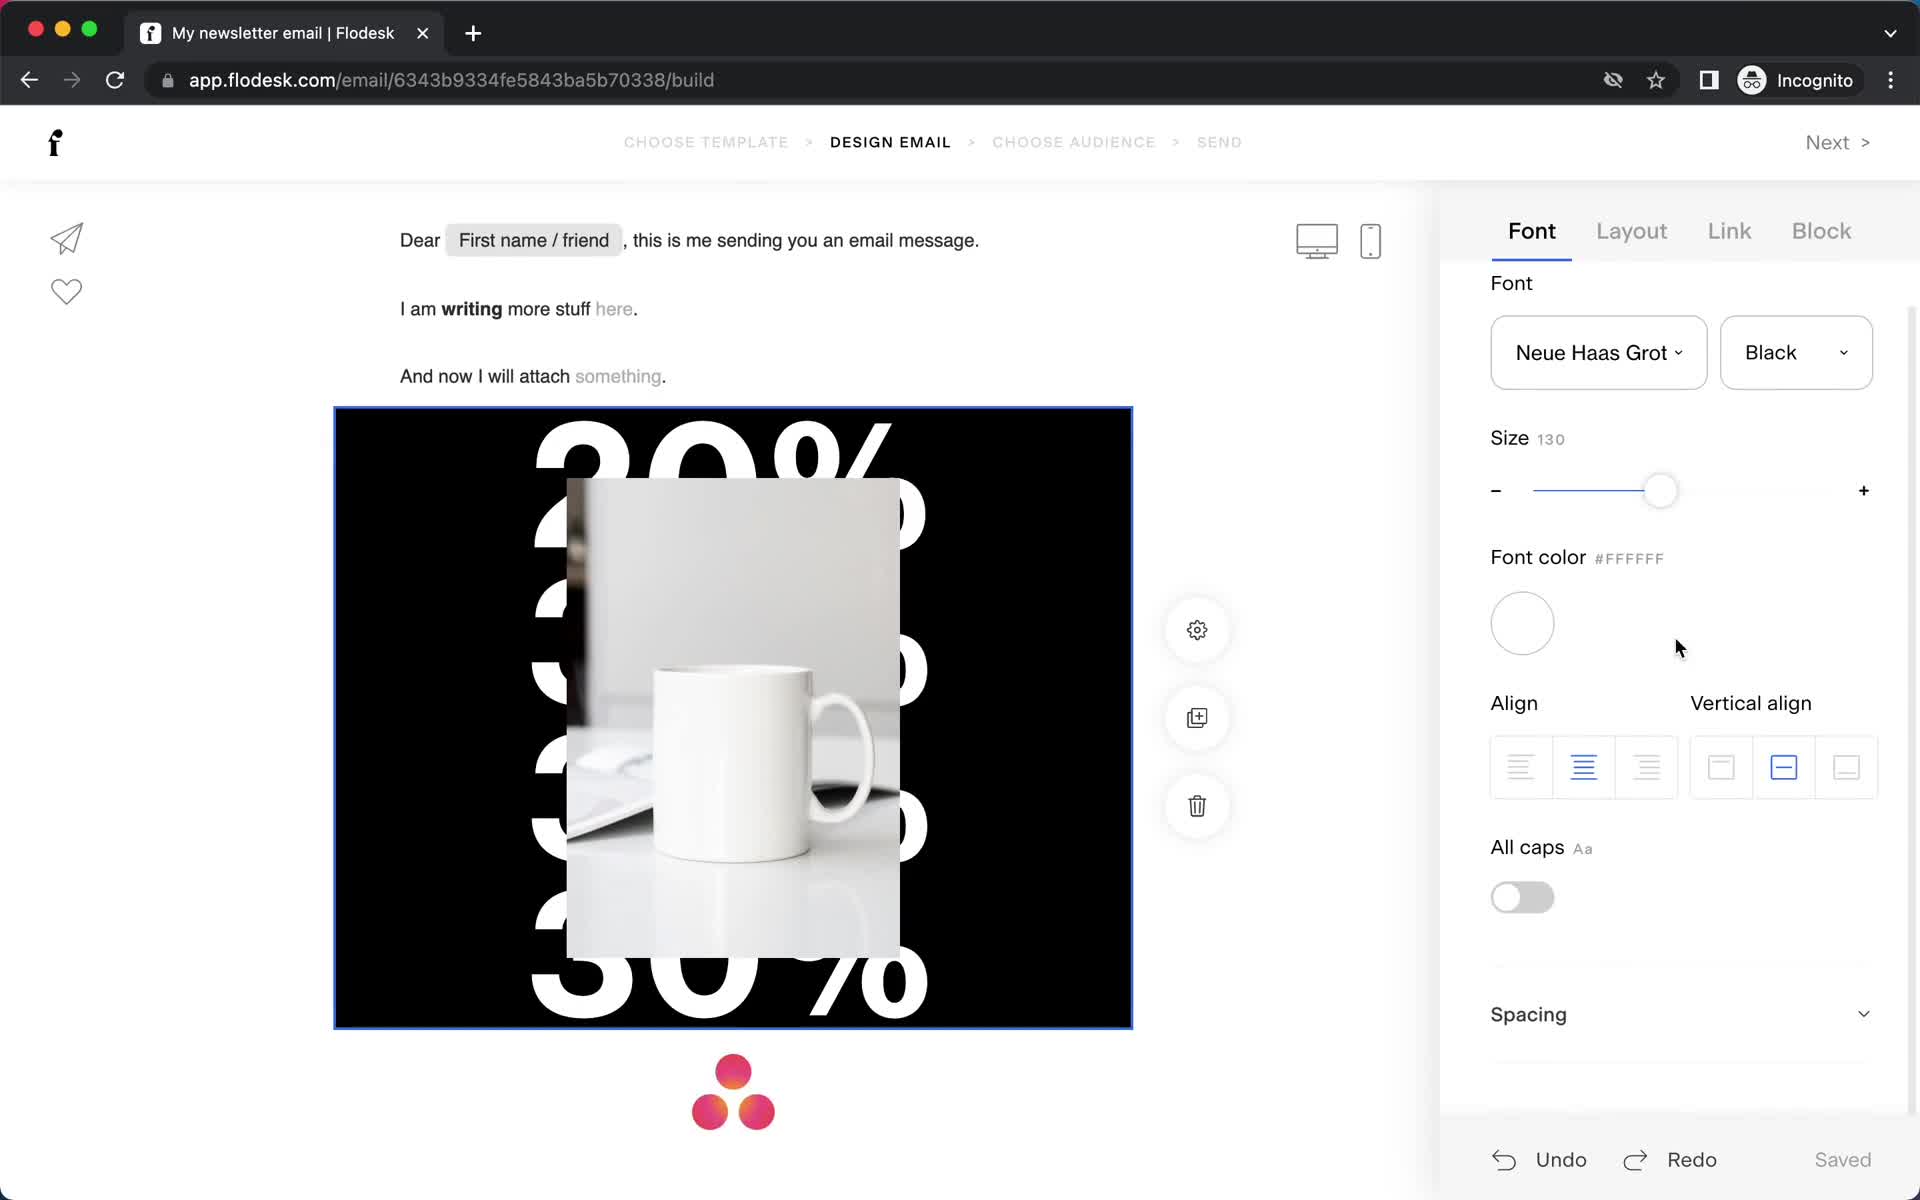
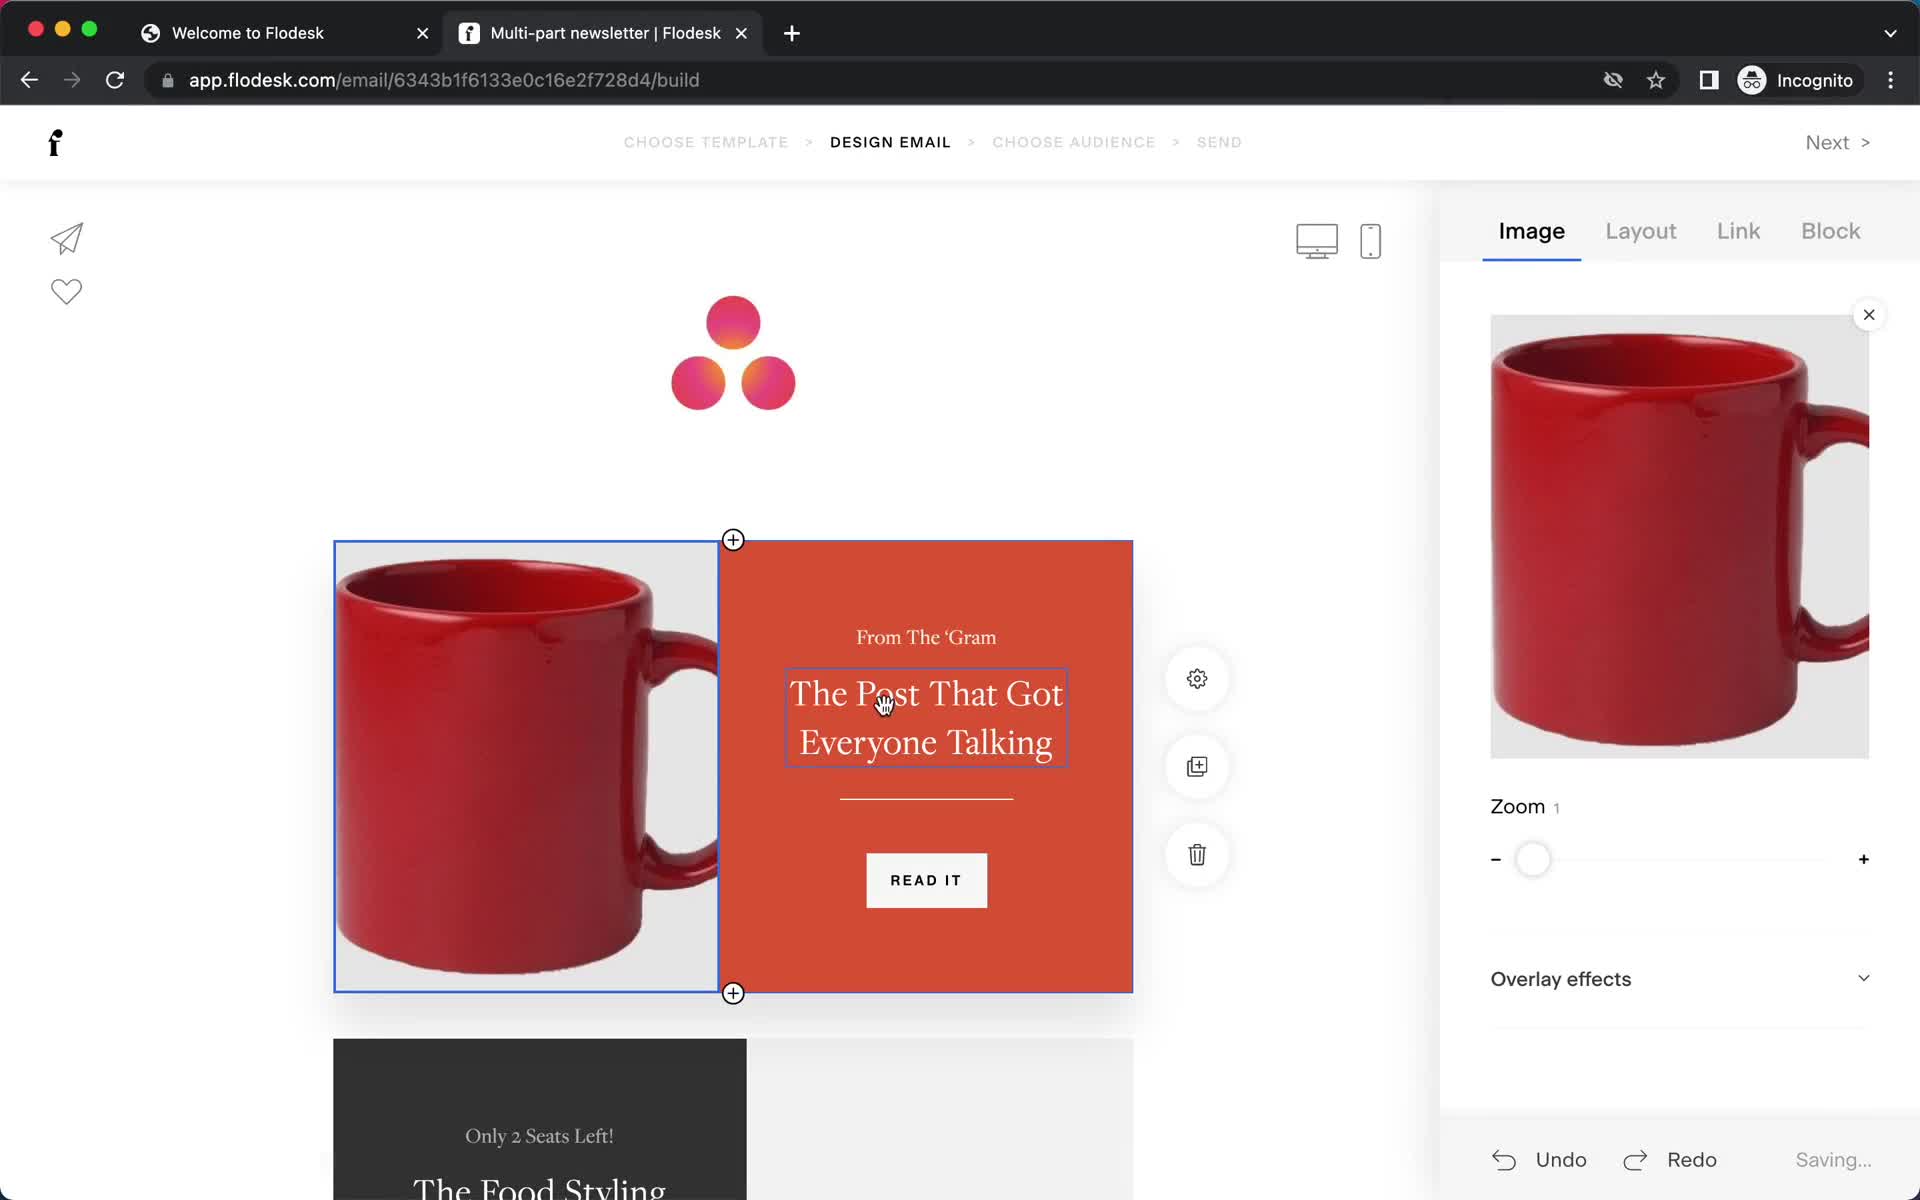
Editor
this is title
Editor
this is title
Editor
this is title
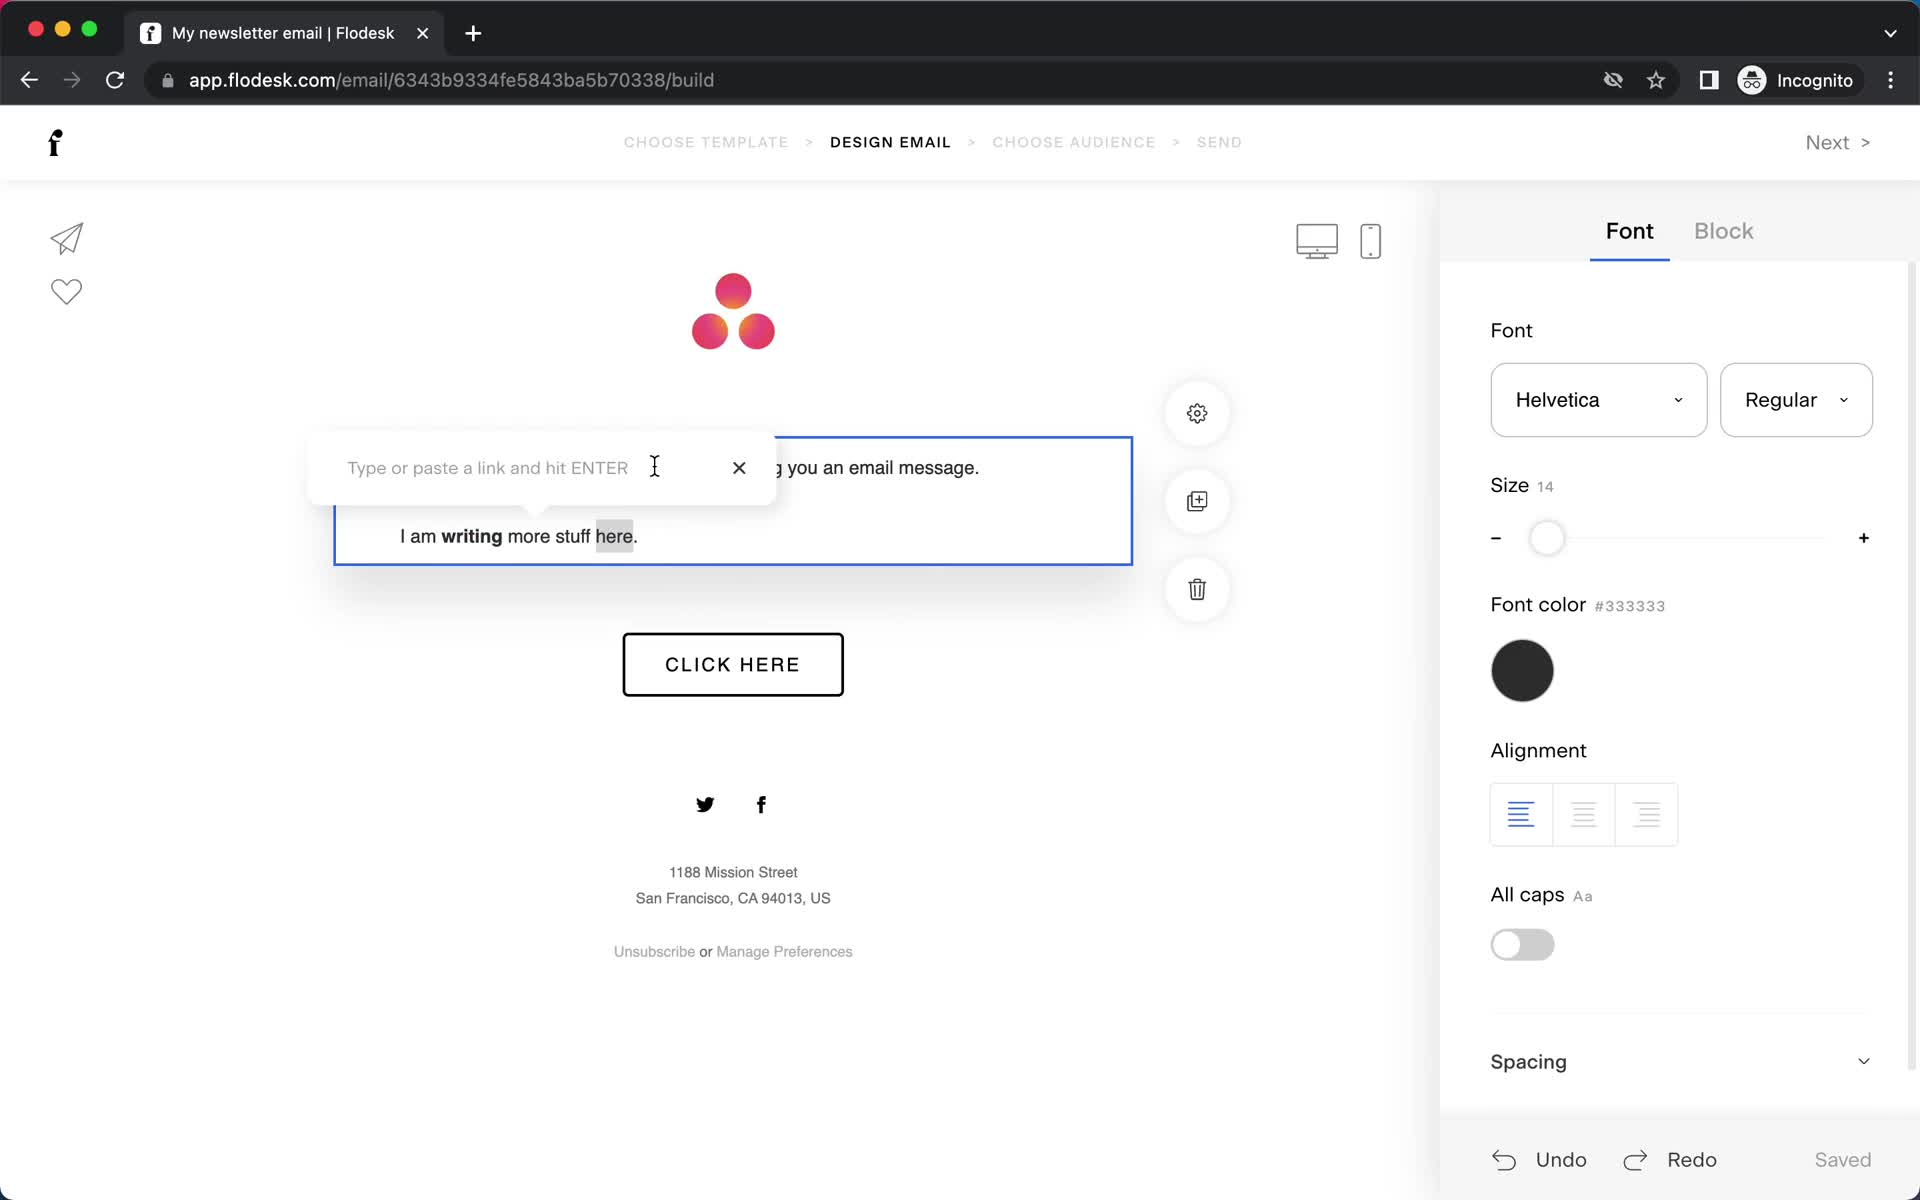
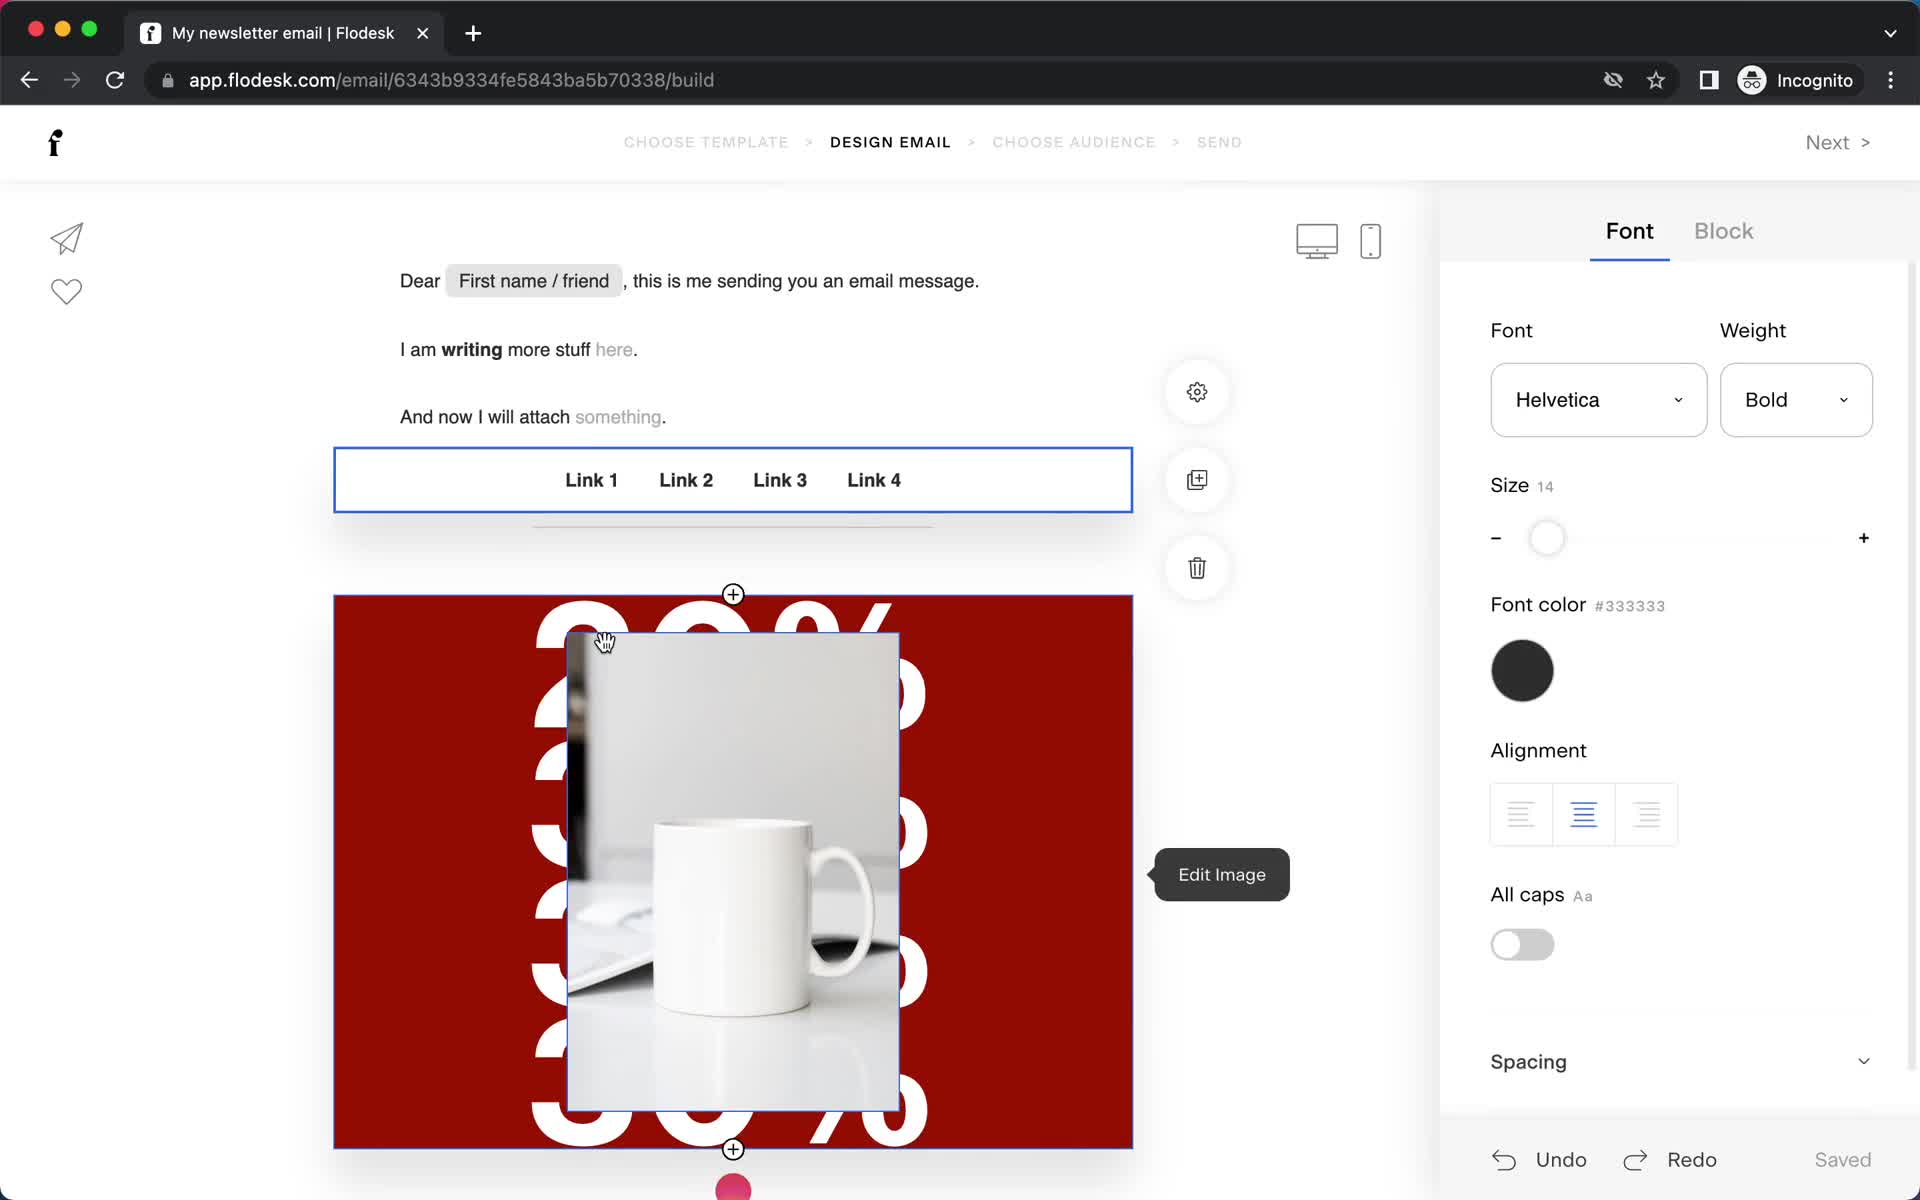
Add link
this is title
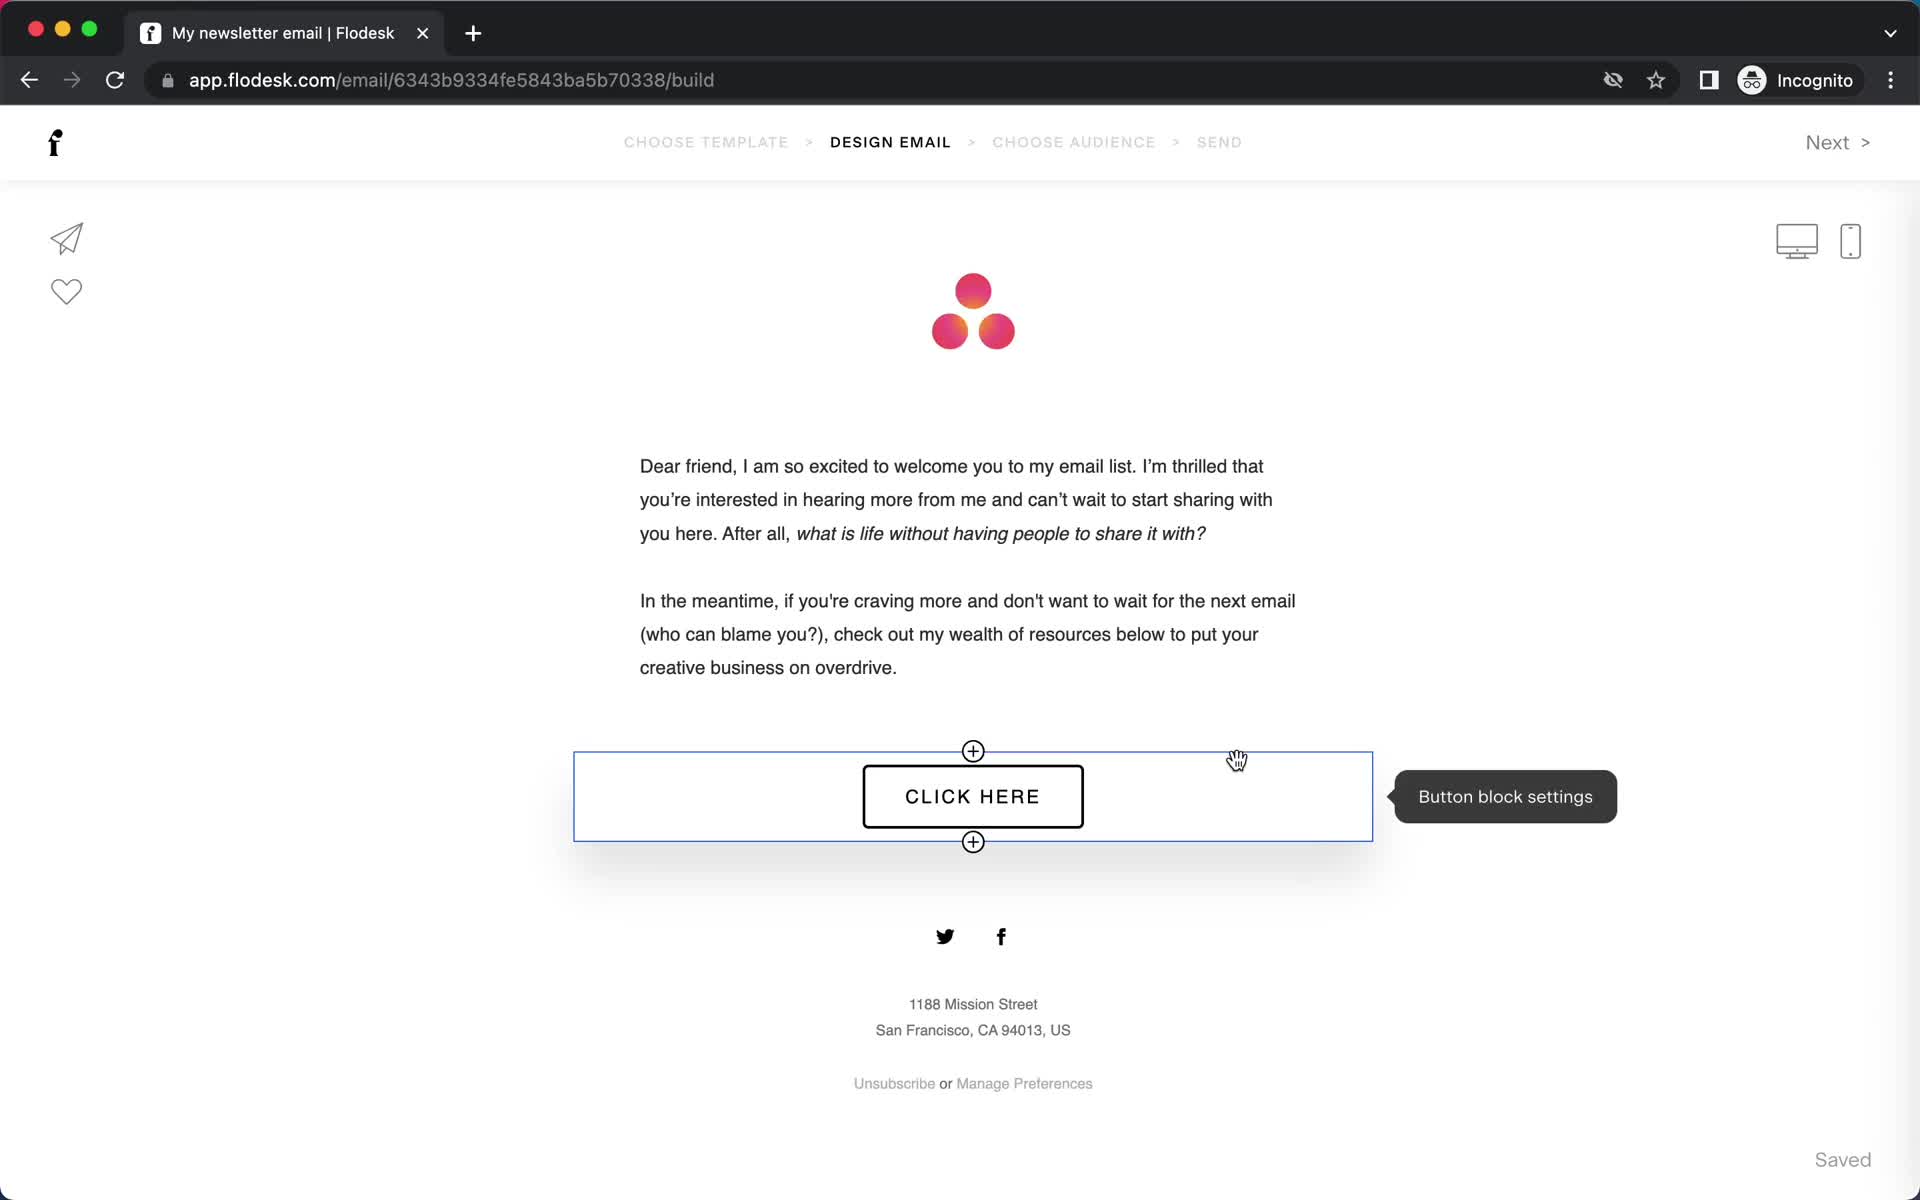
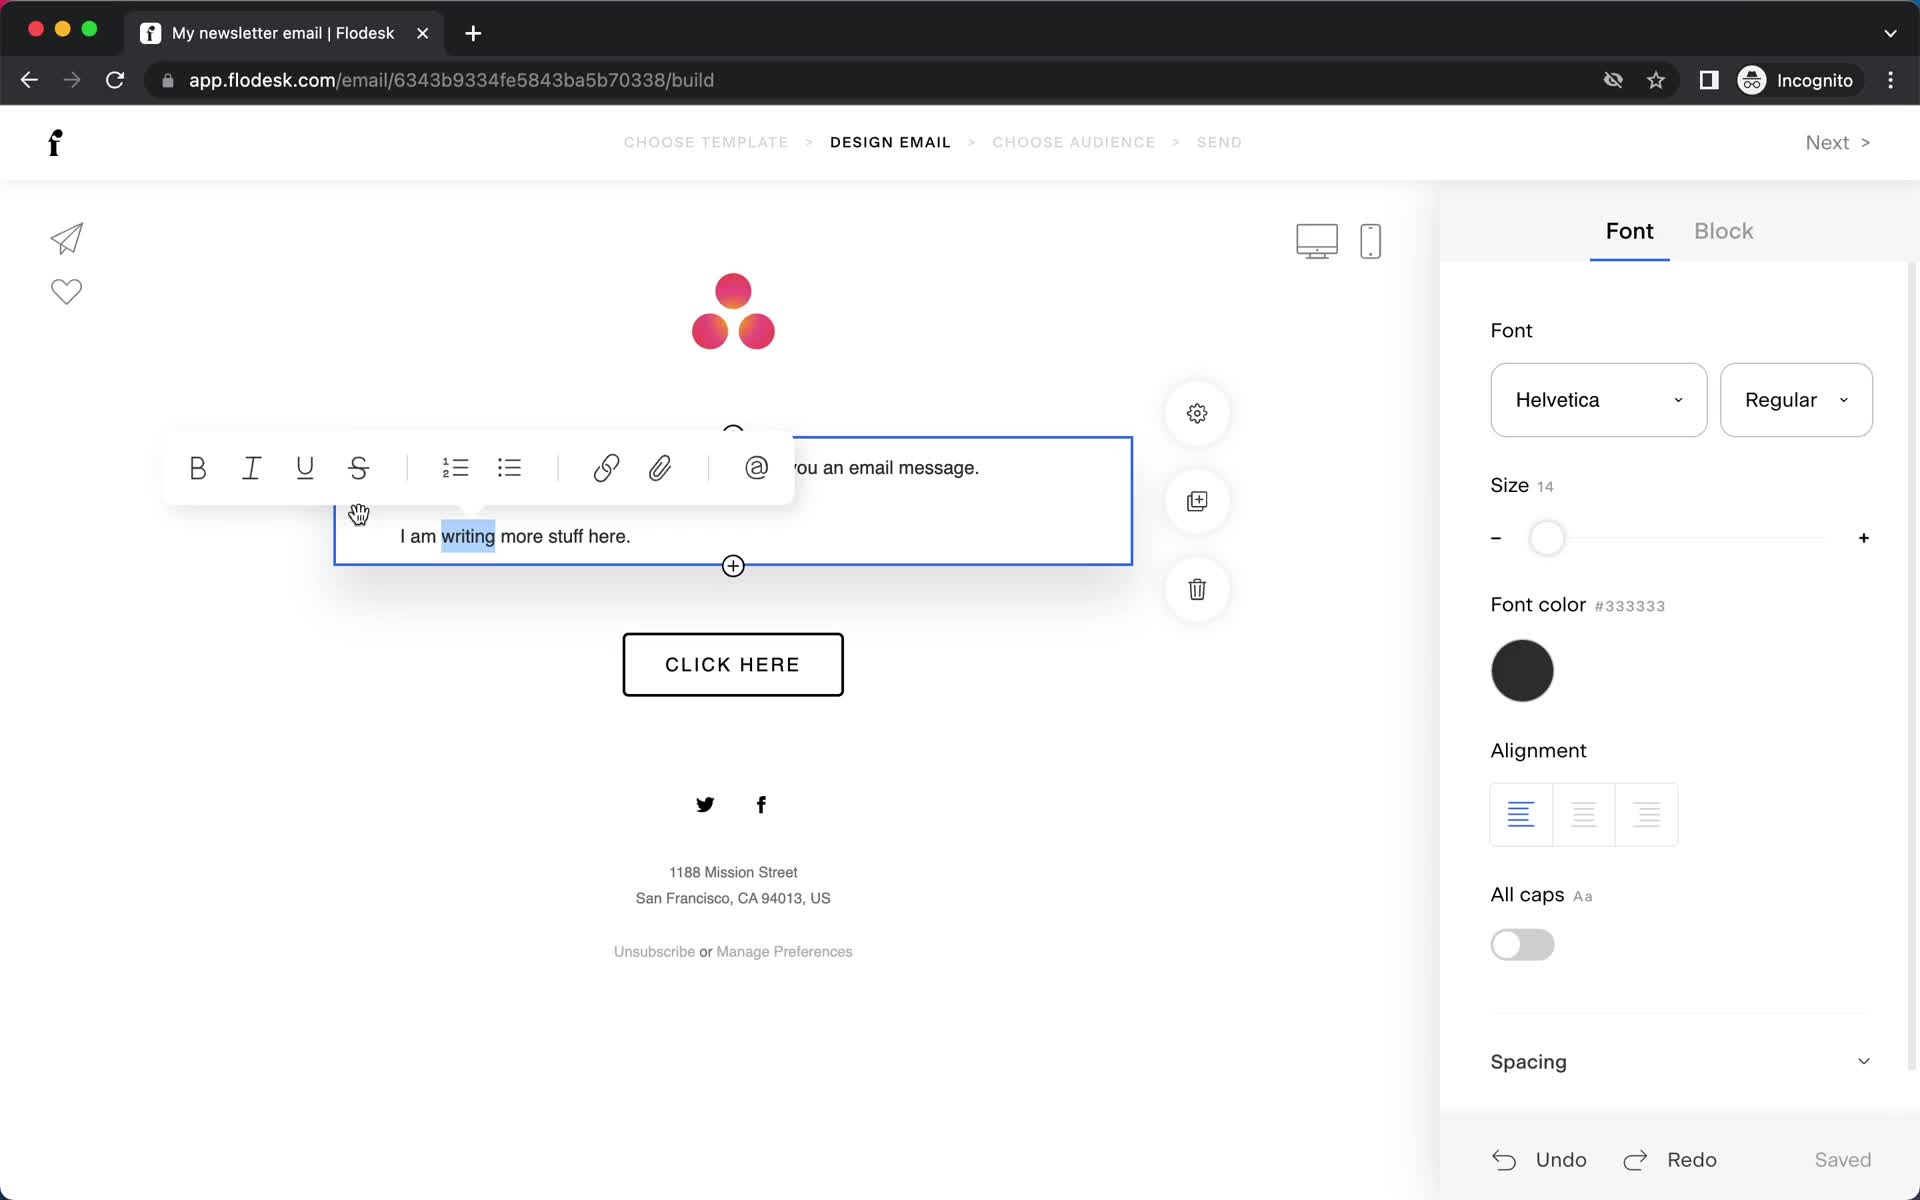
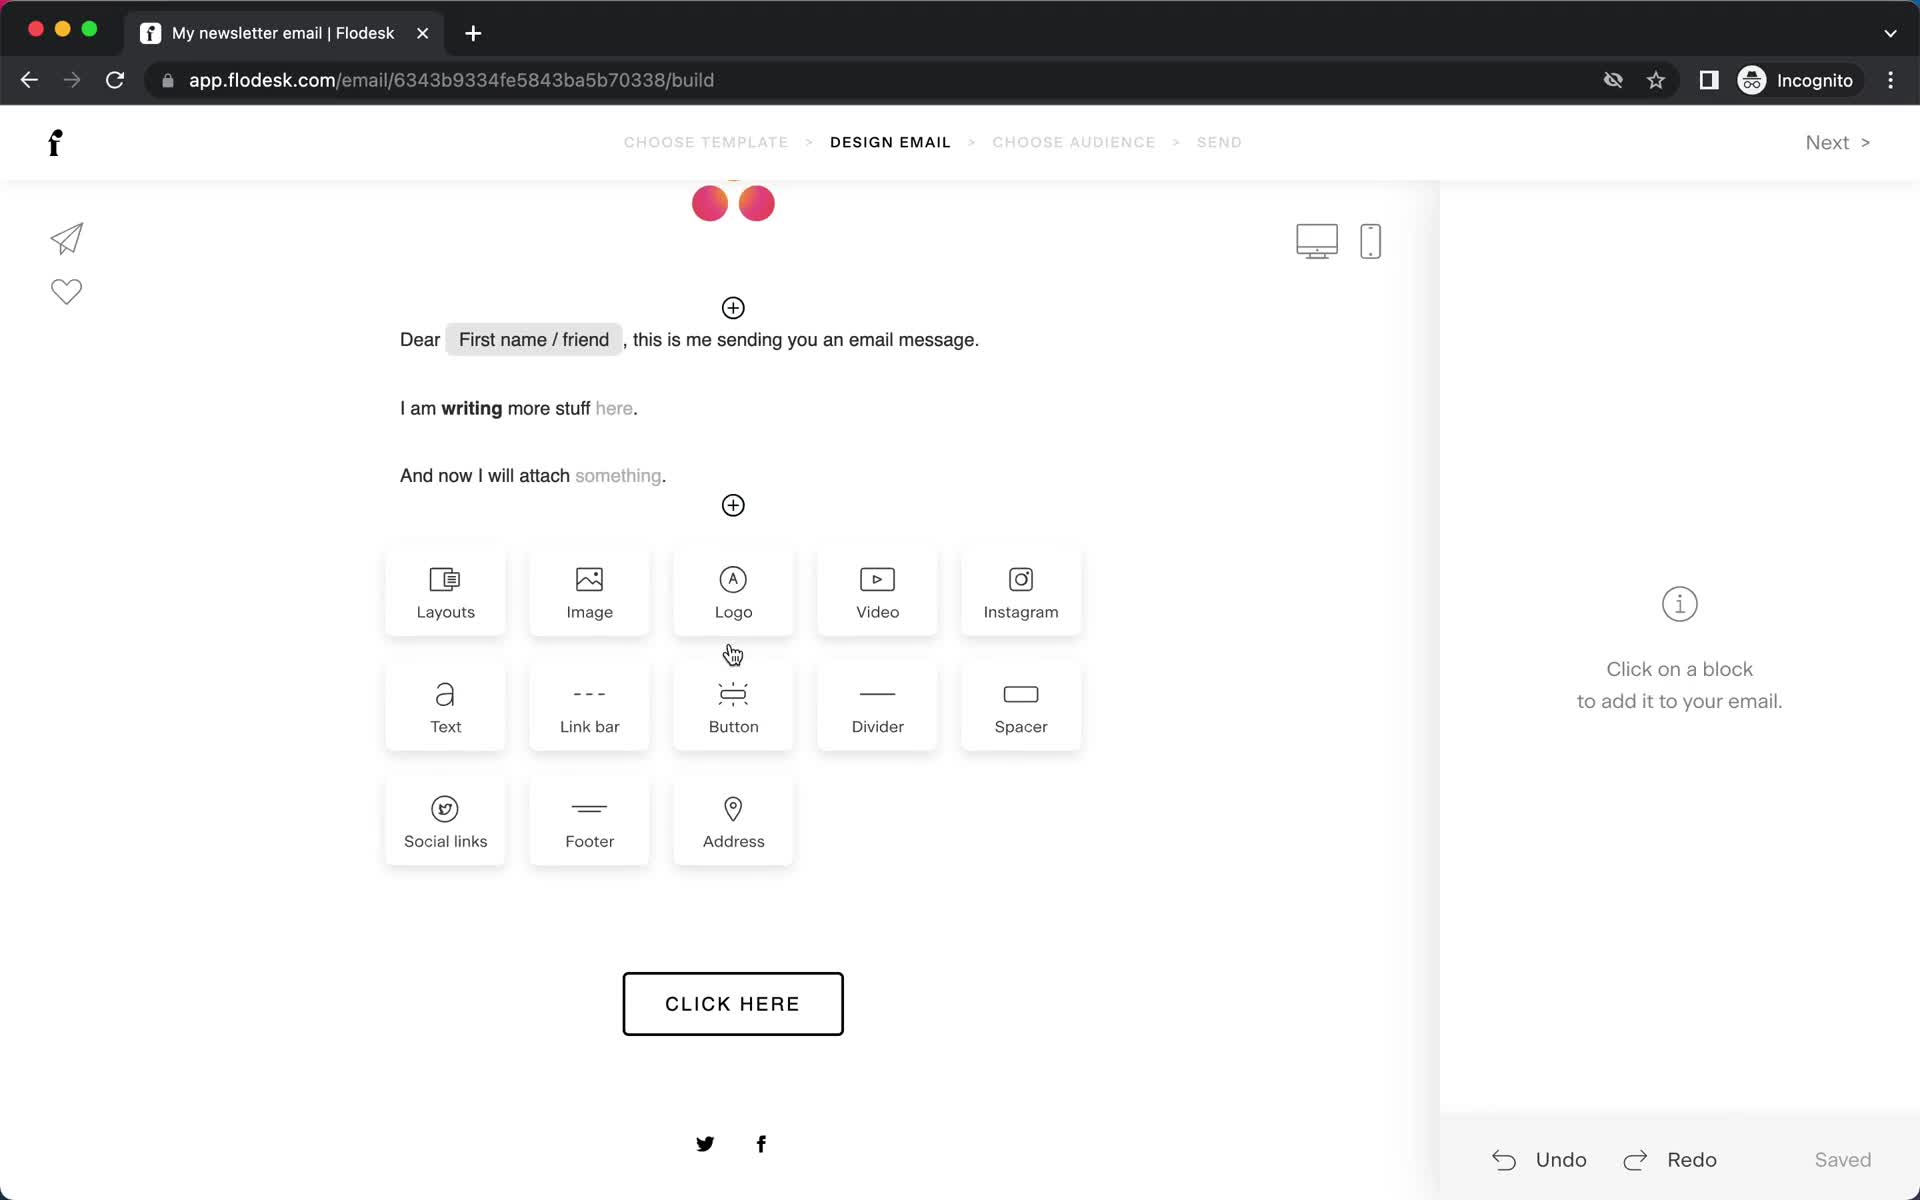
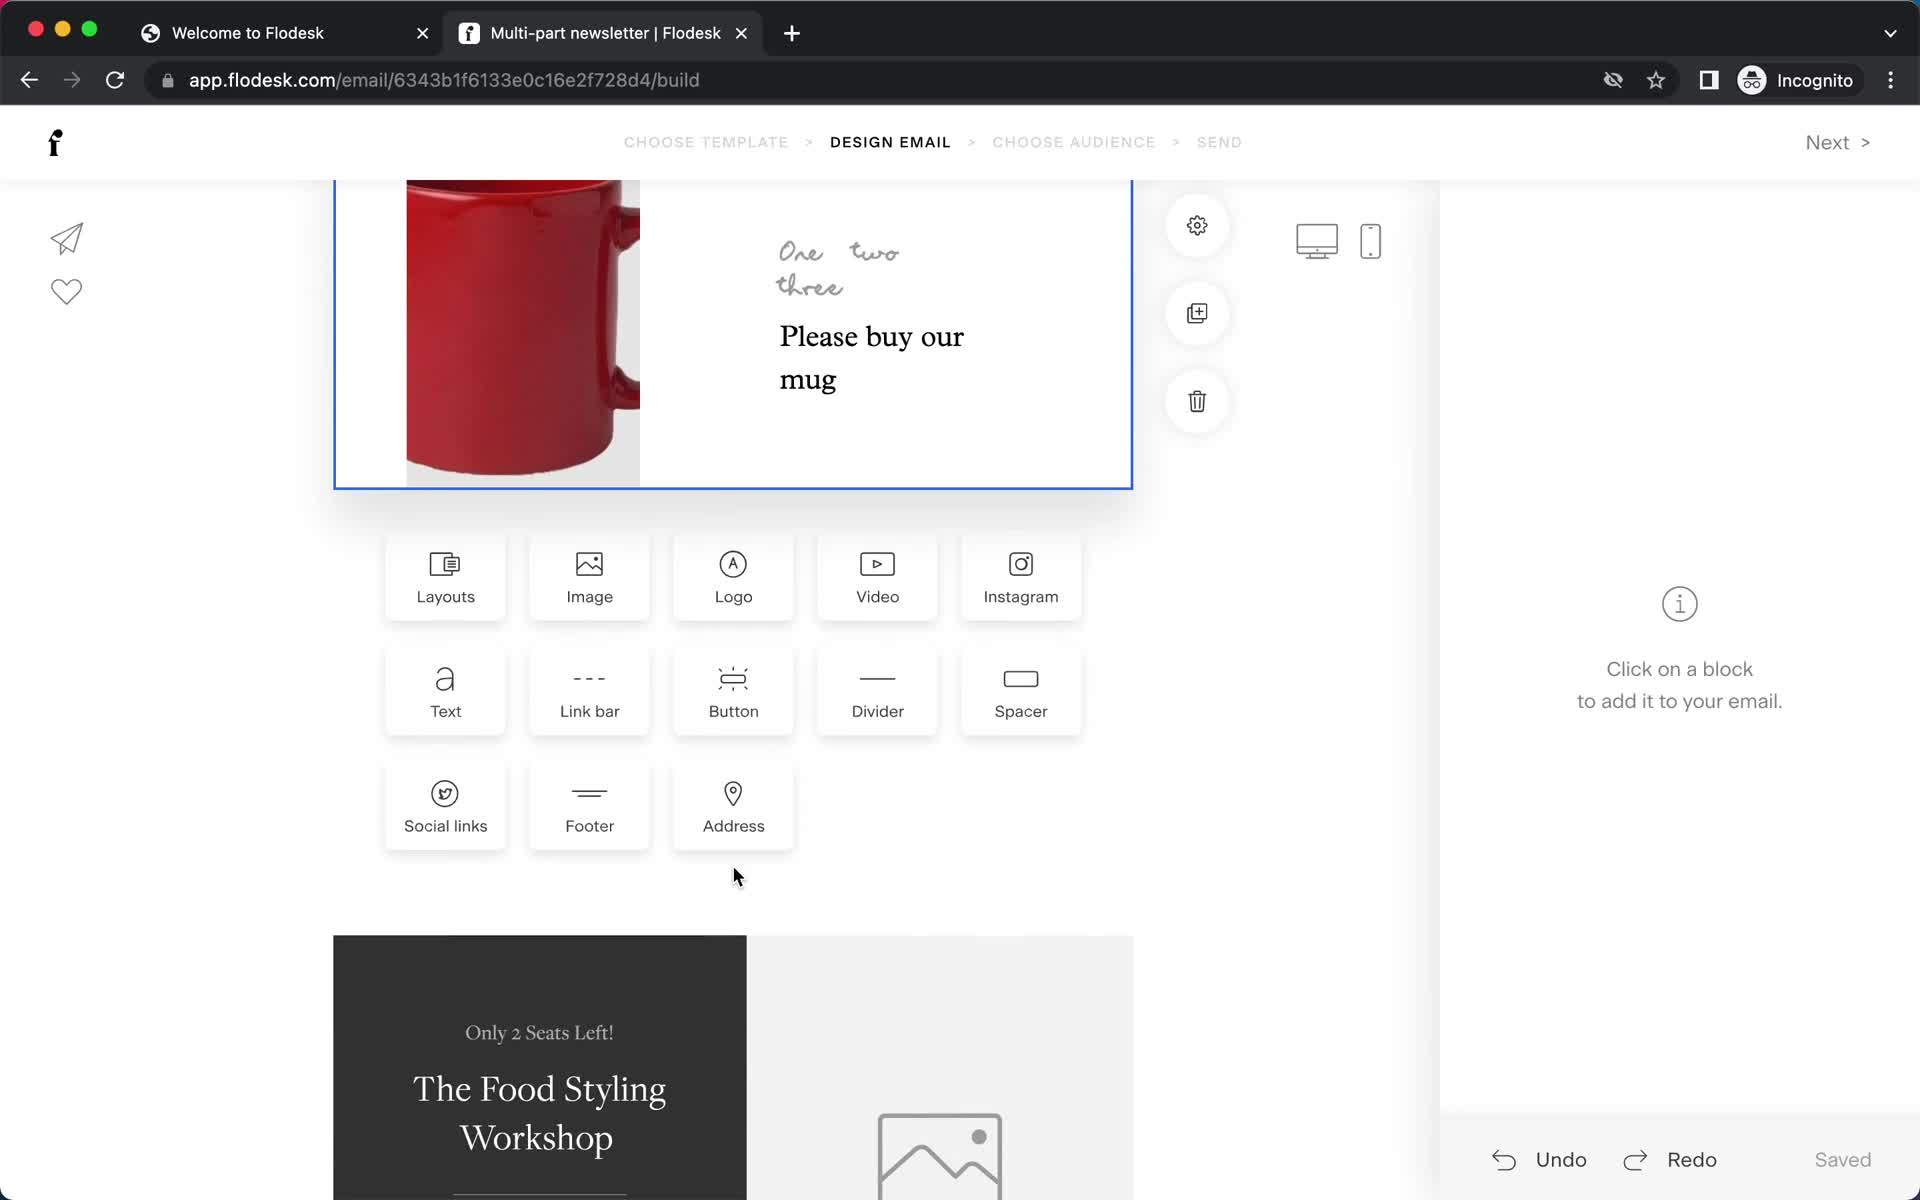
Add element
this is title
Editor
this is title
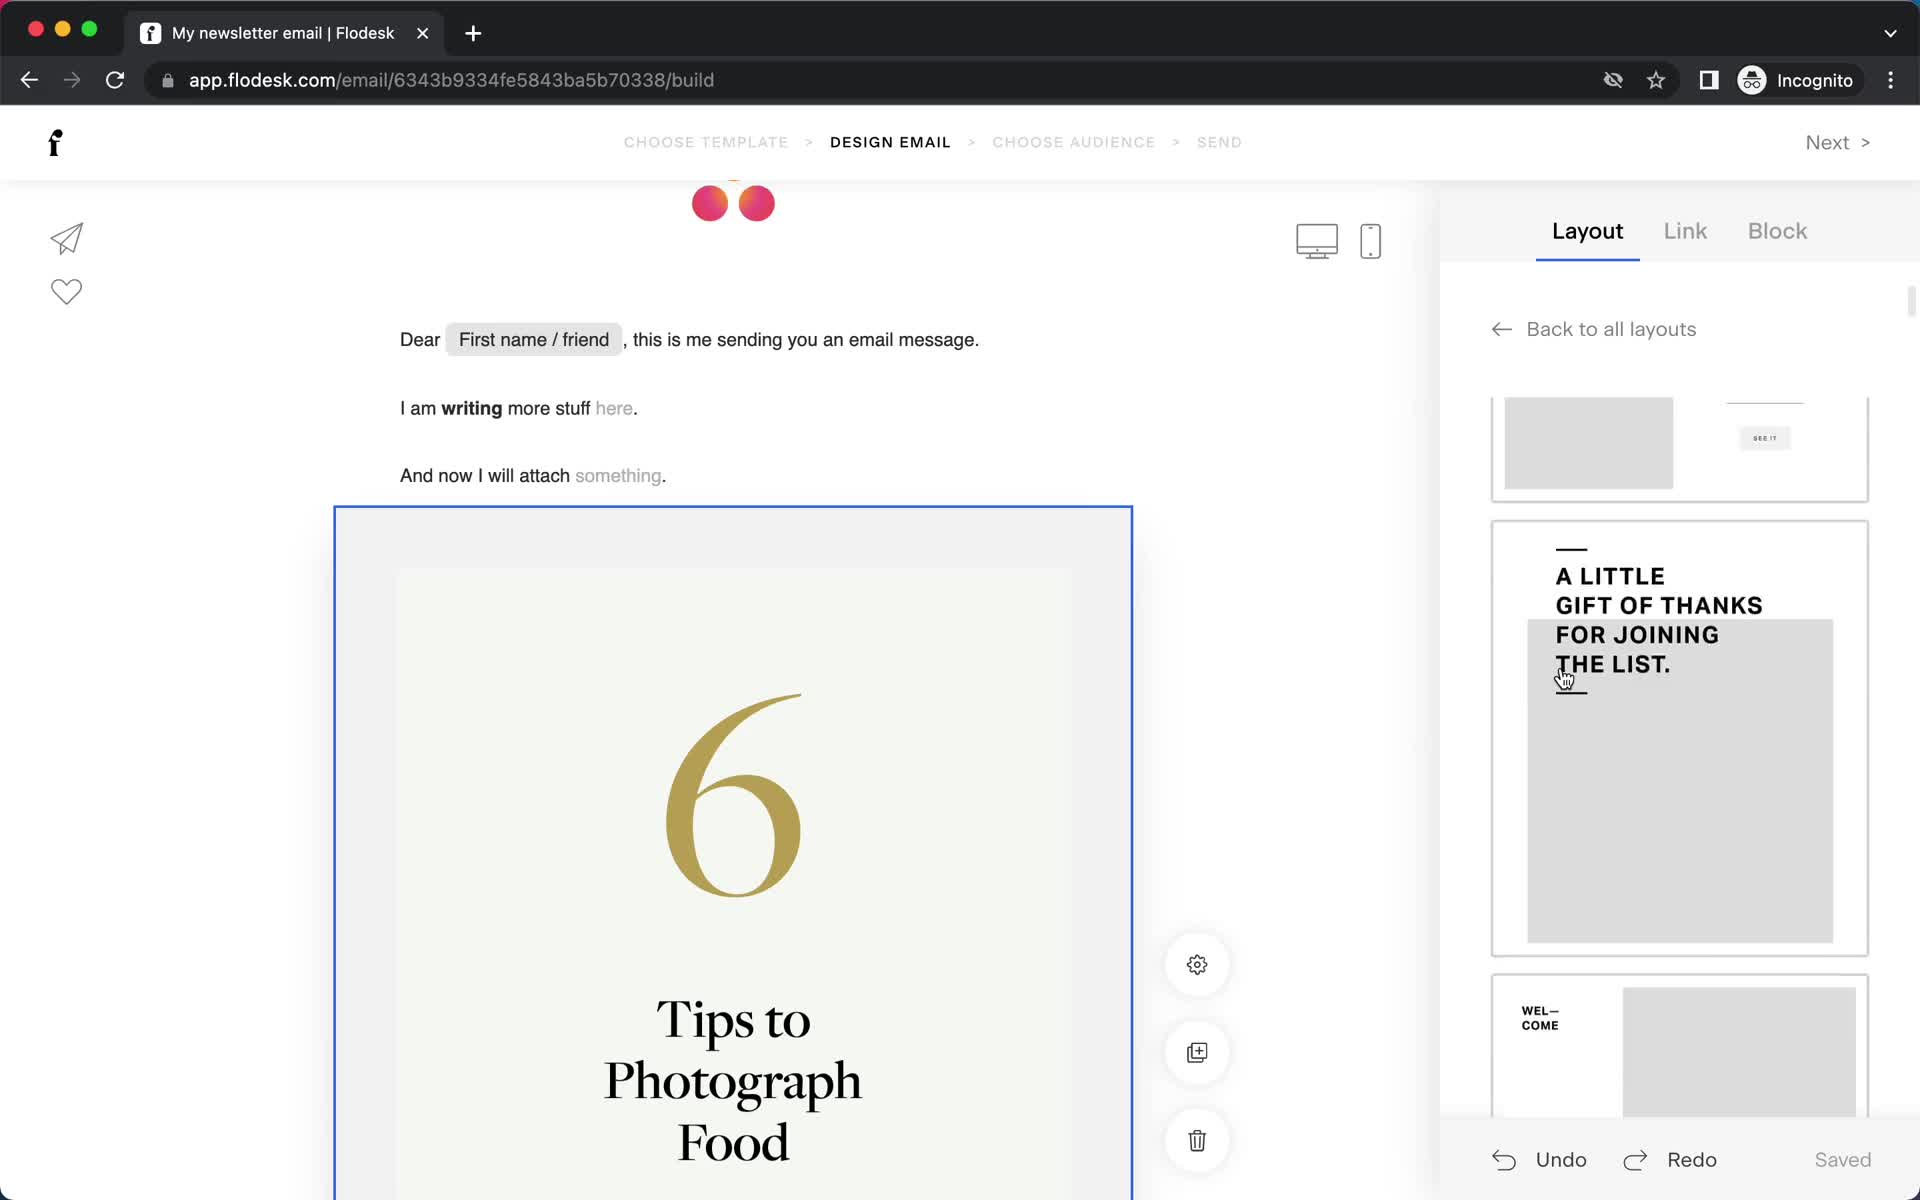
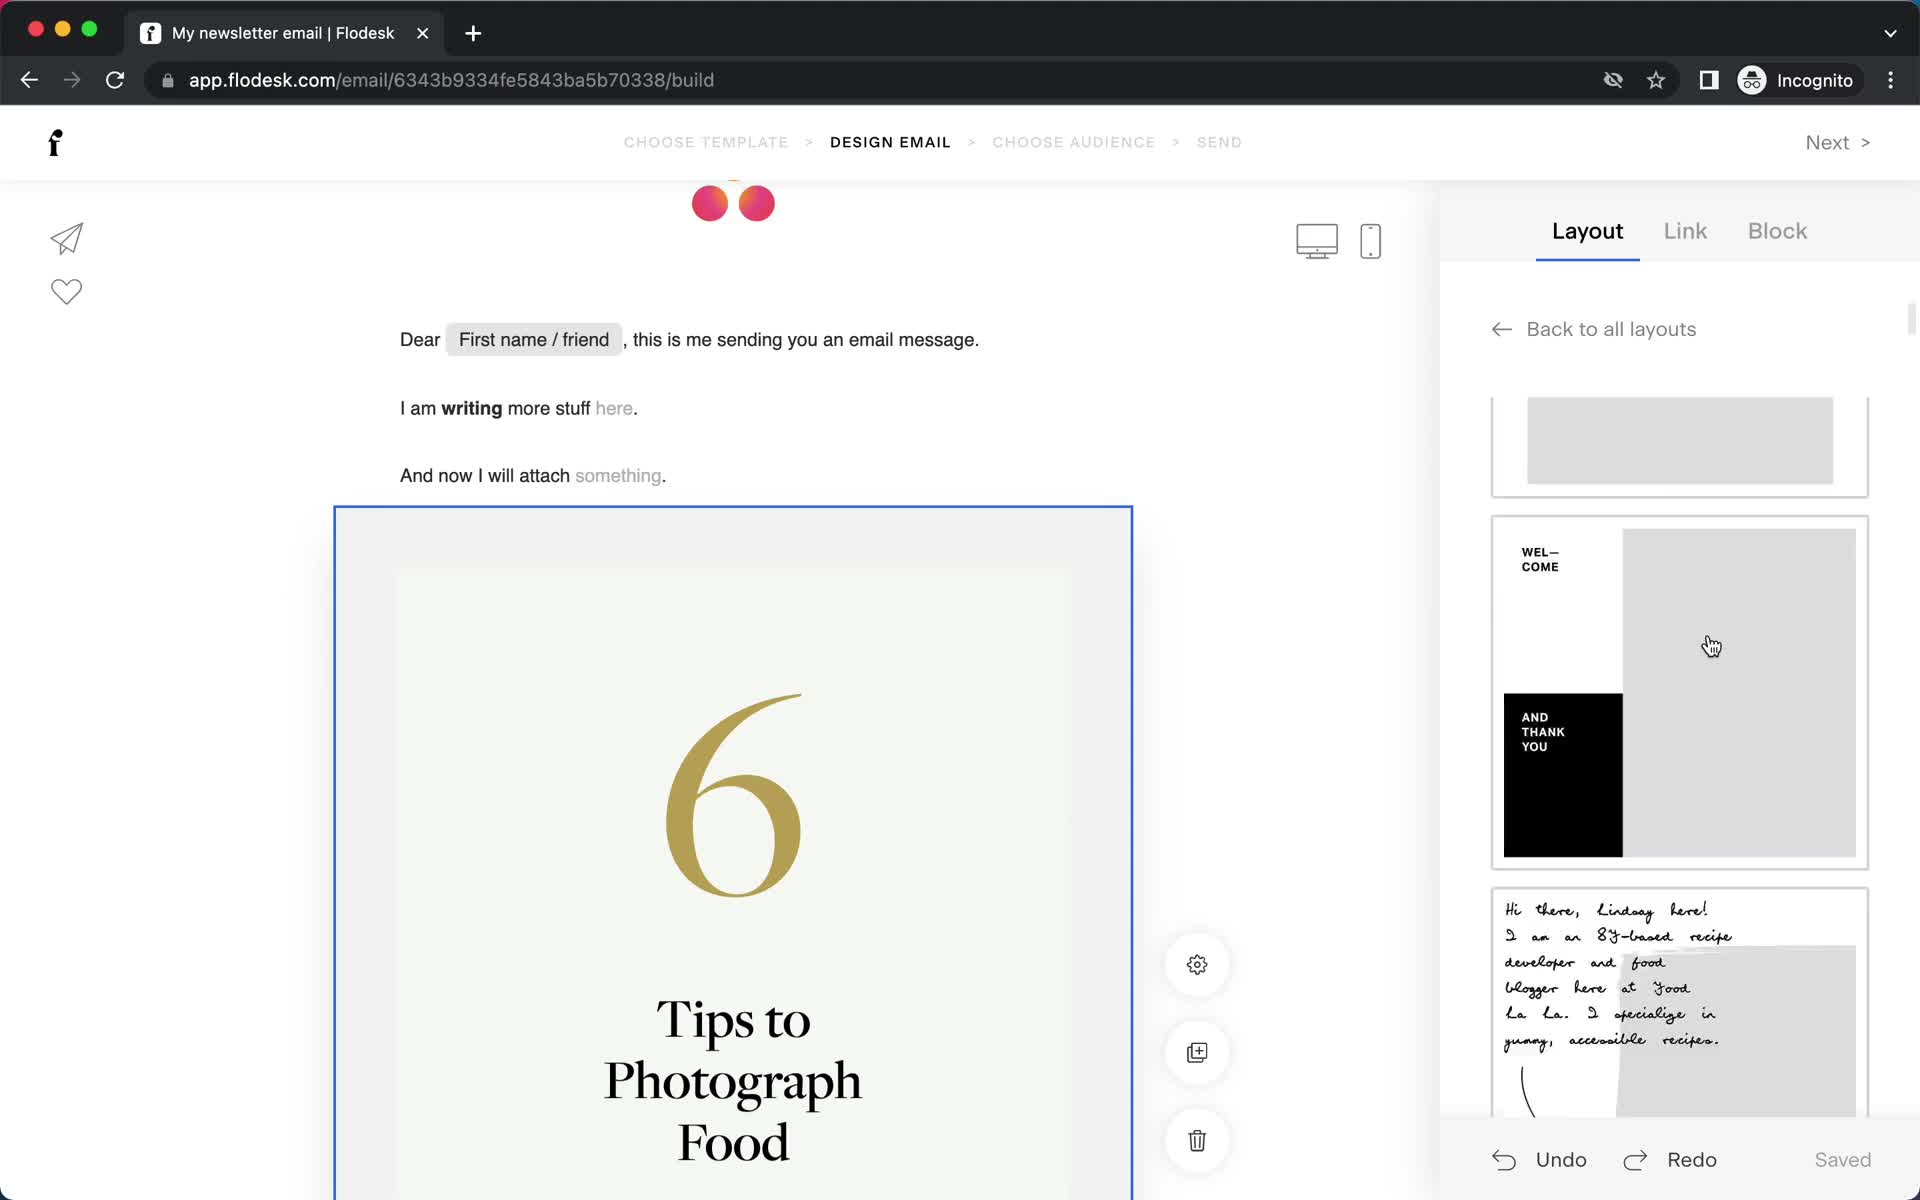
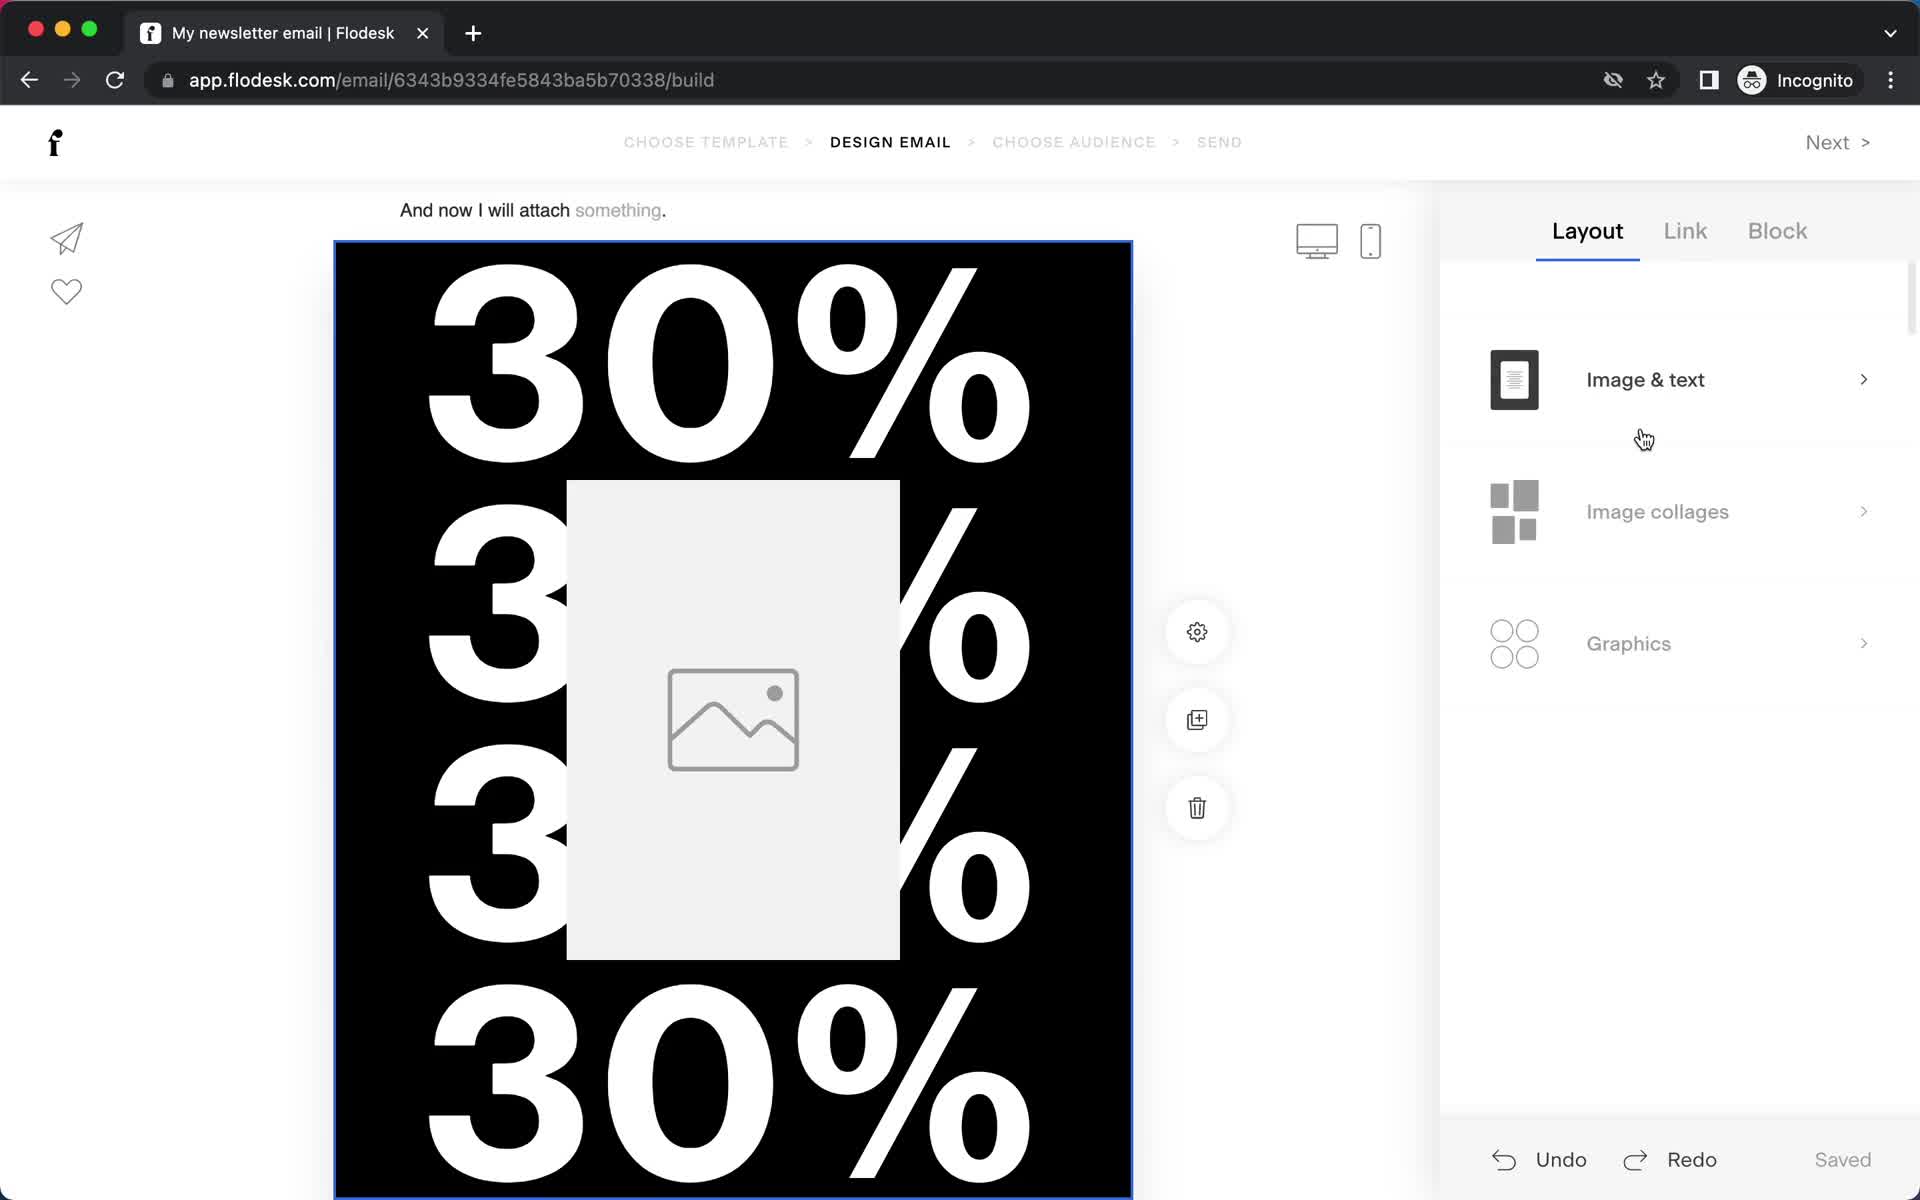
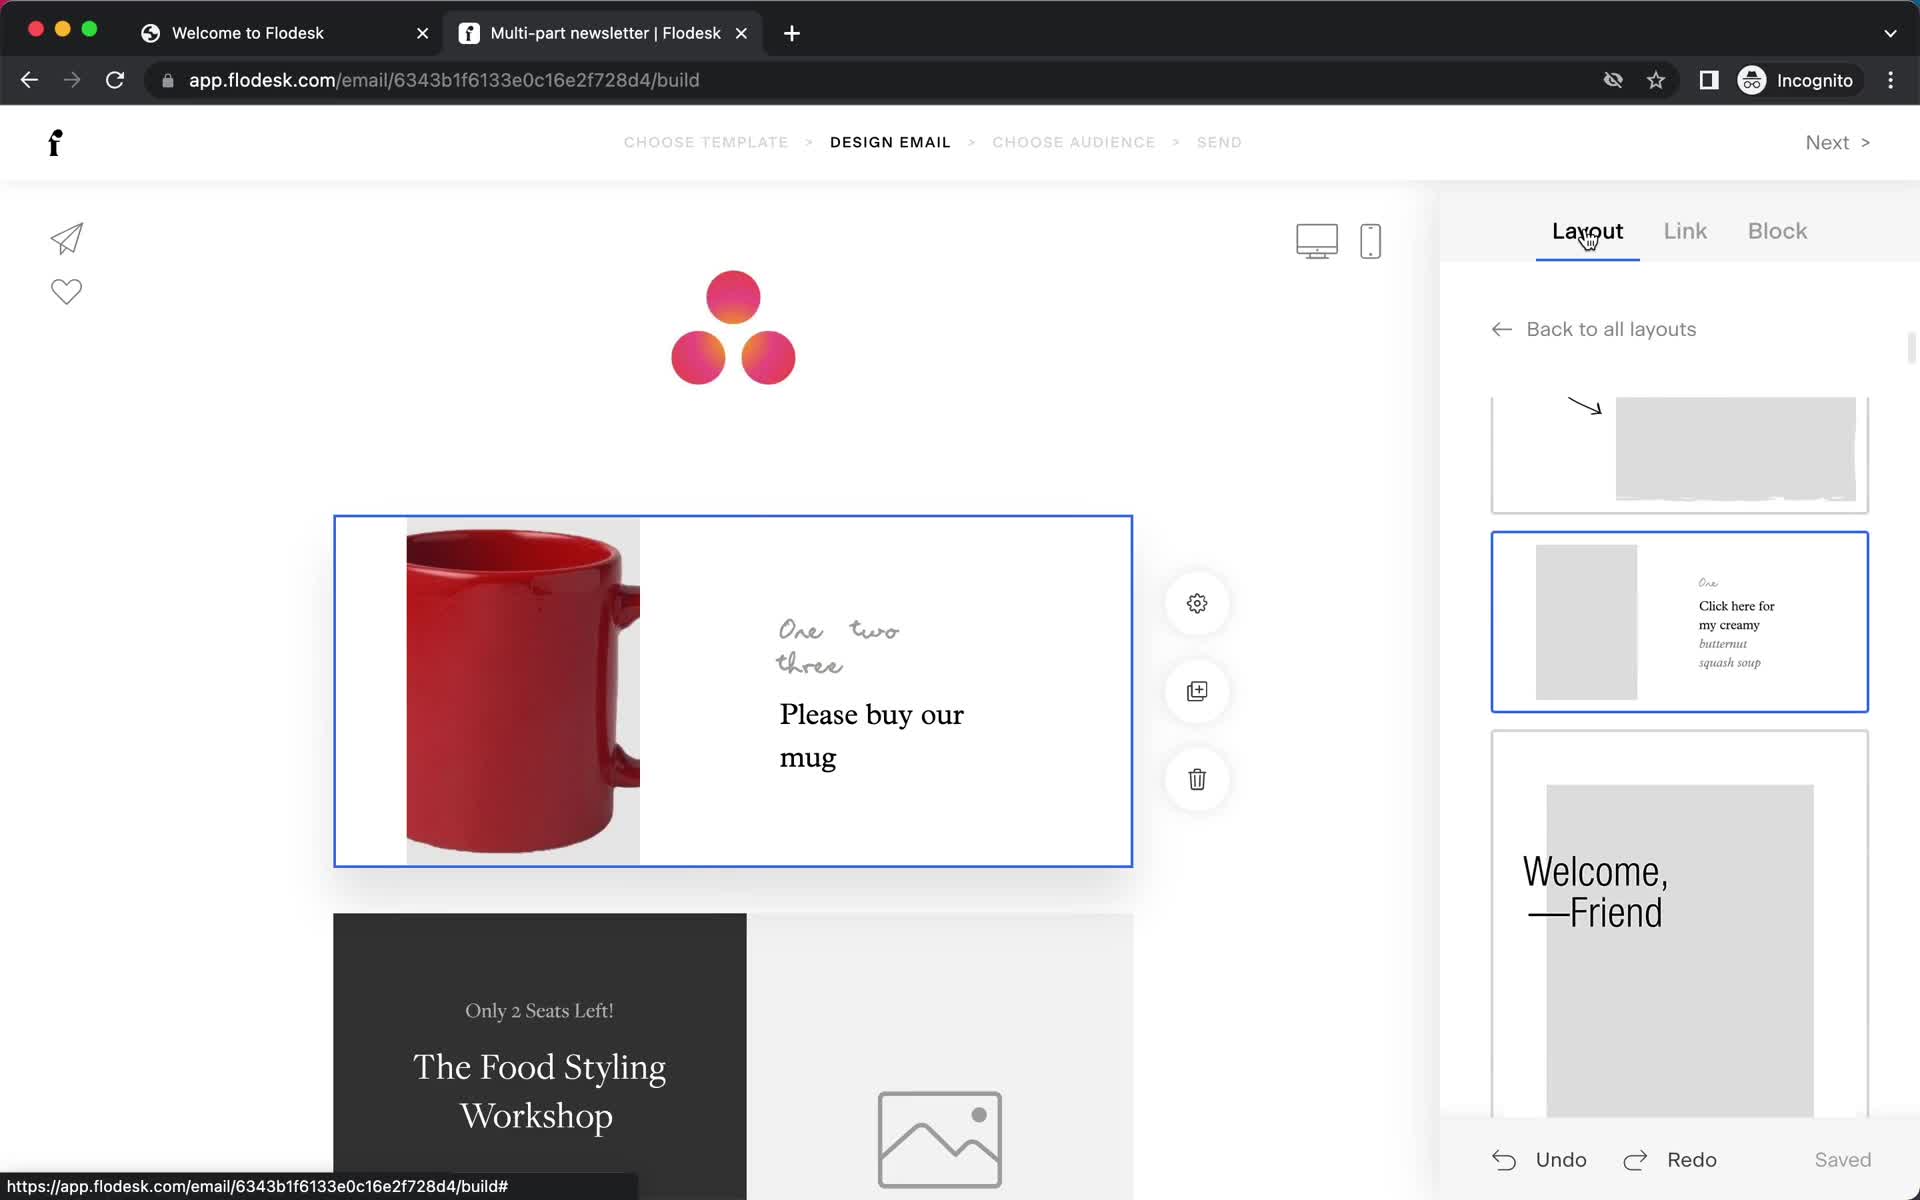
Select layout
this is title
Editor
this is title
Customize appearance
this is title
Editor
this is title
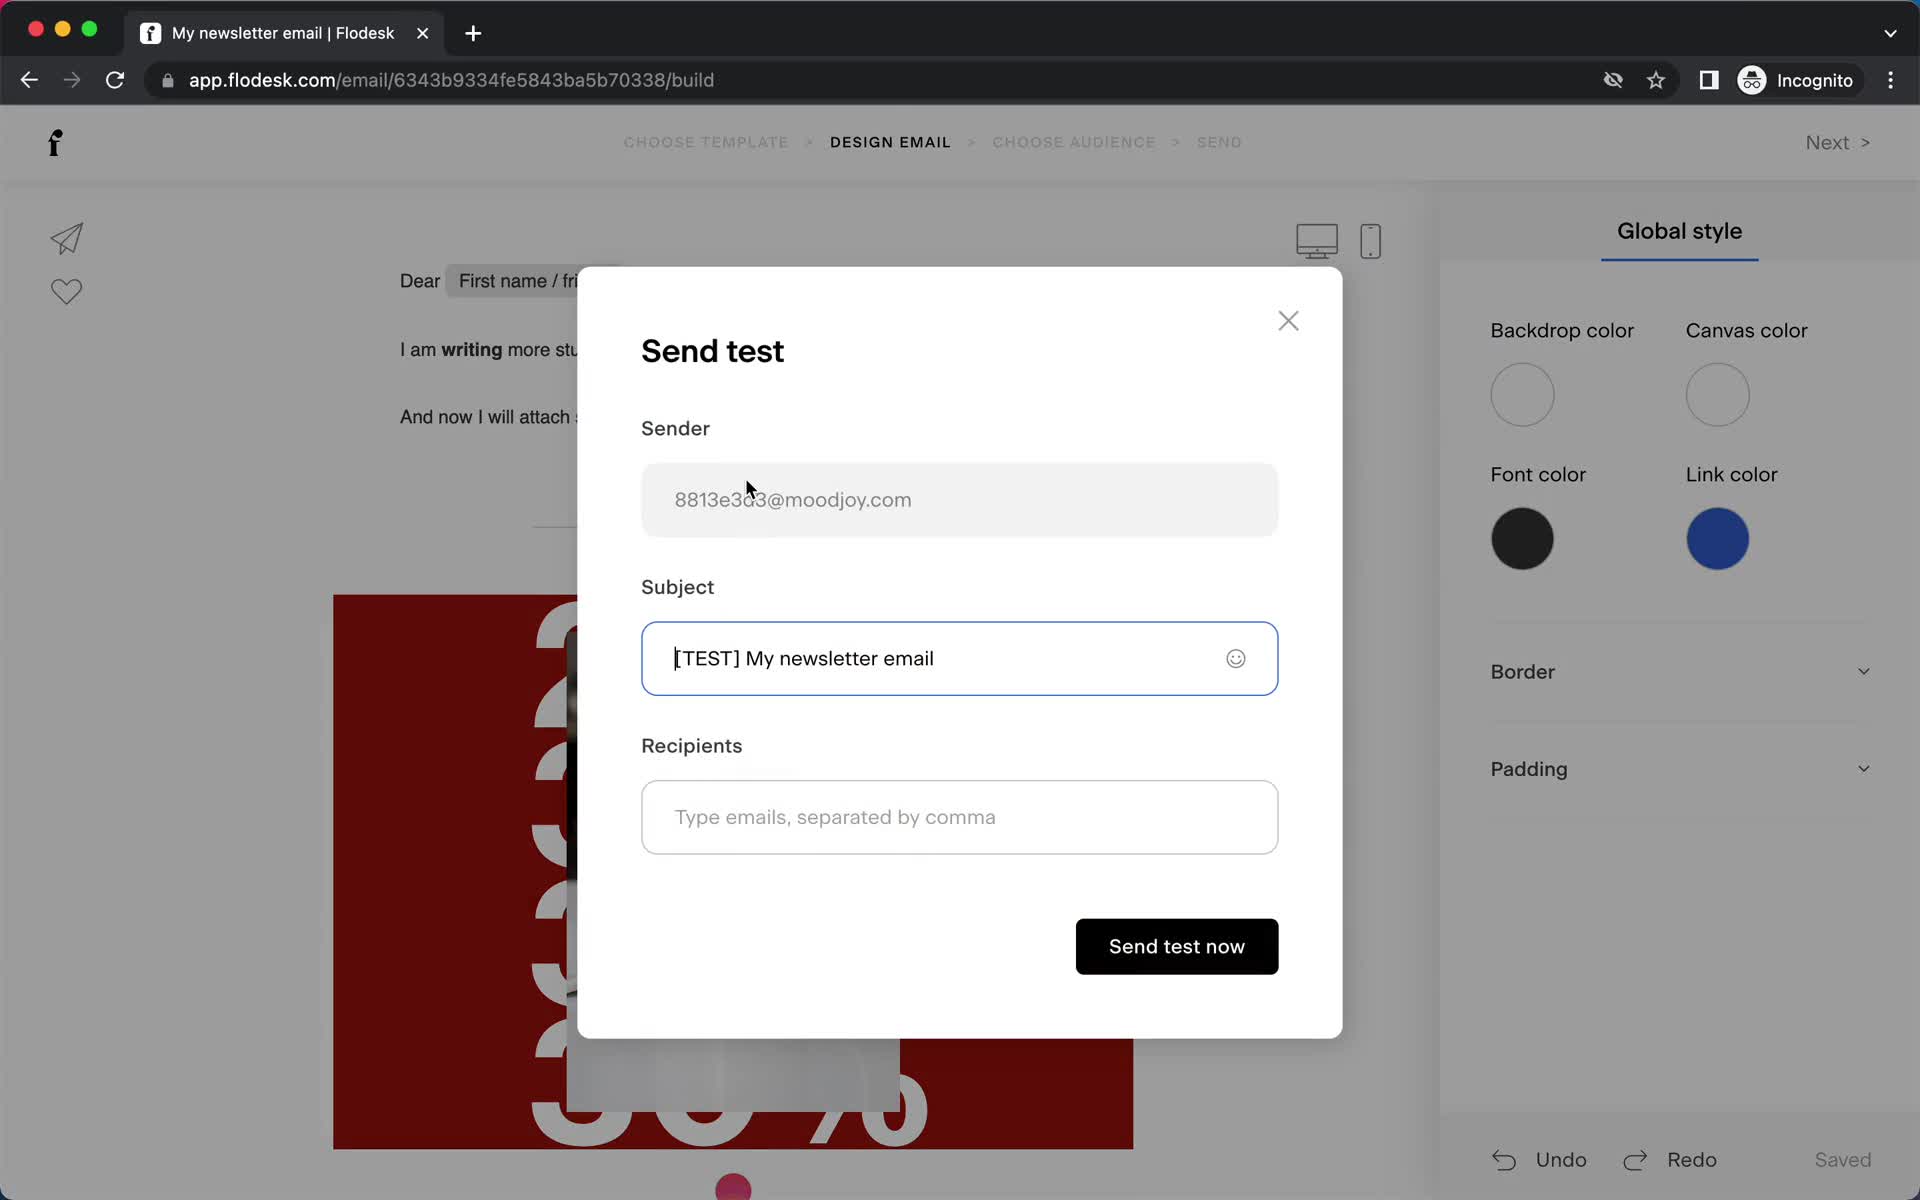
Send test email
this is title
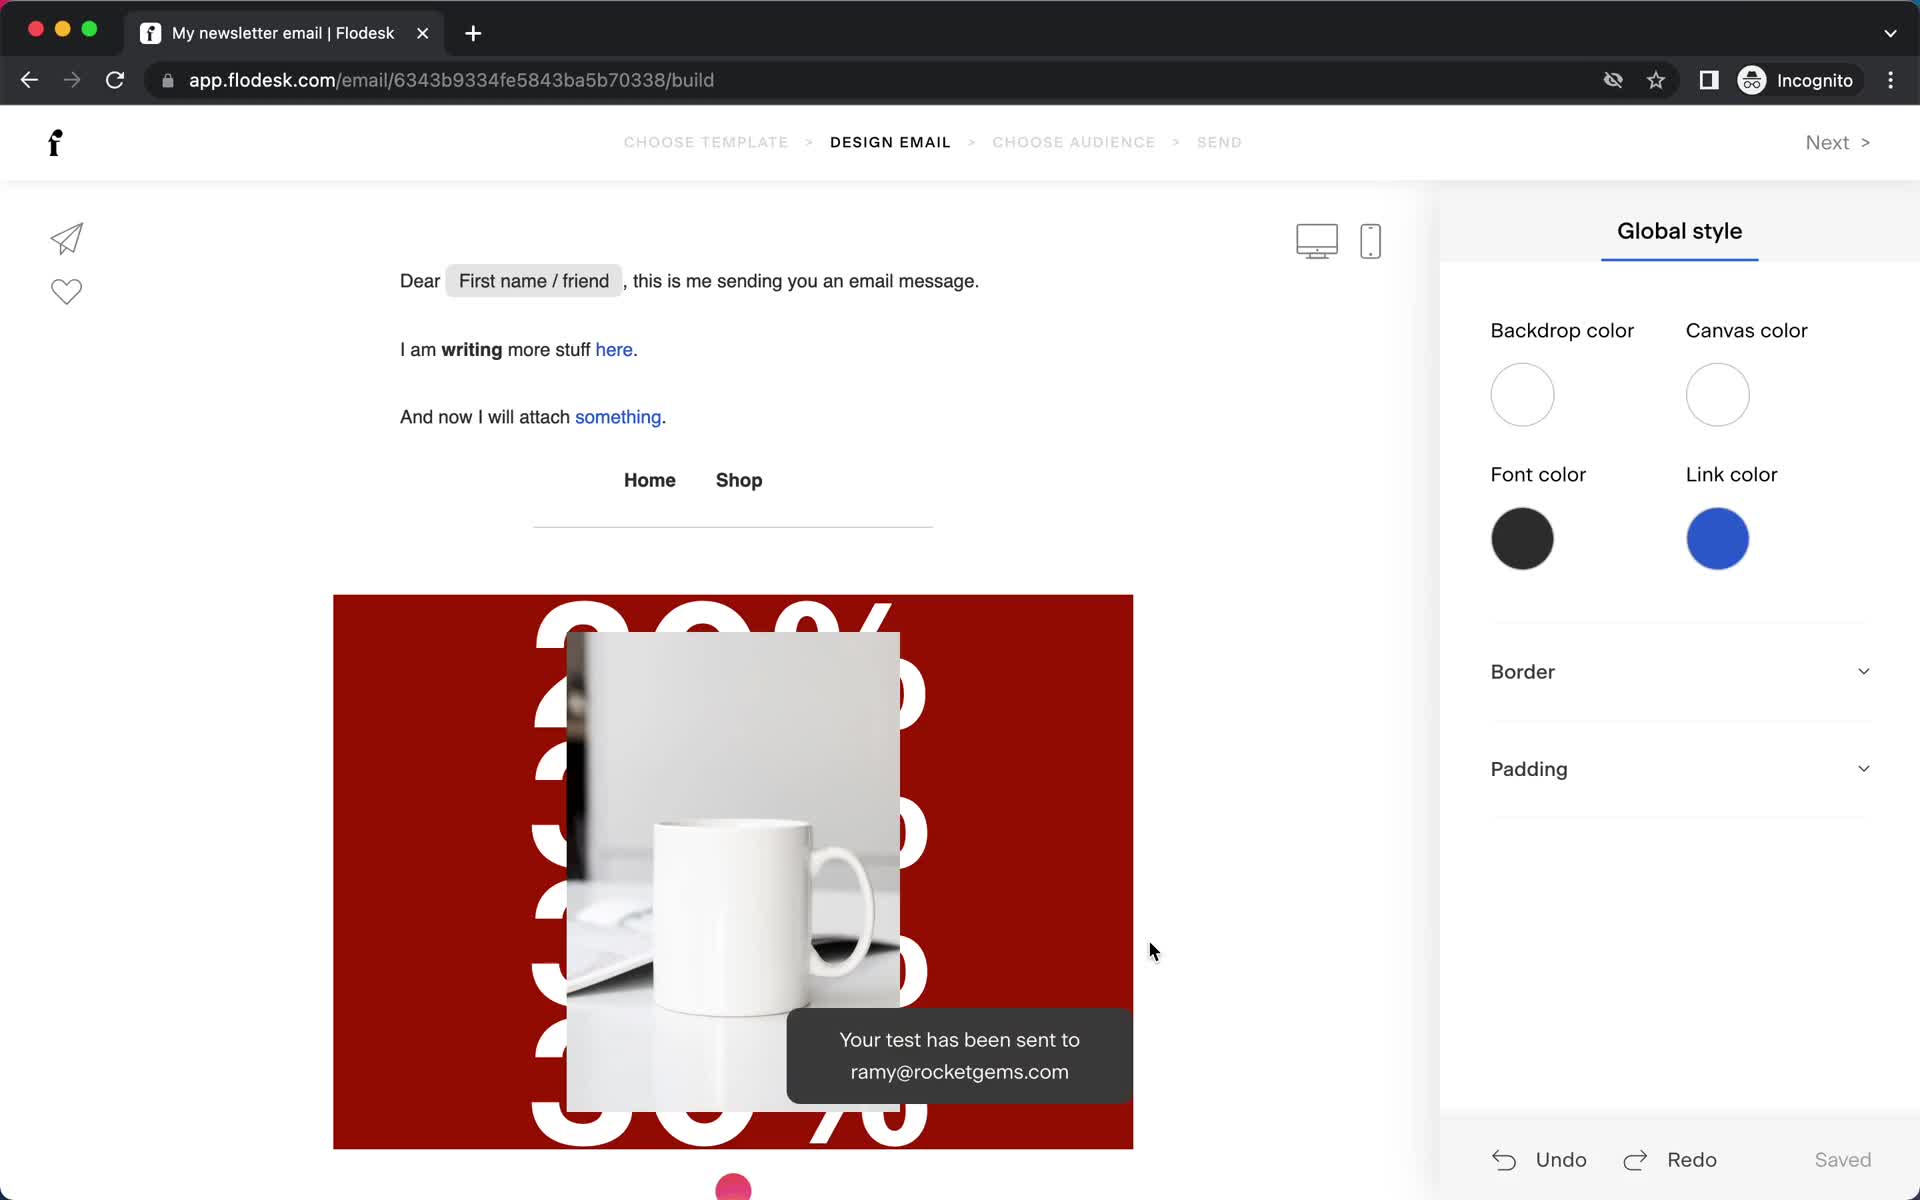
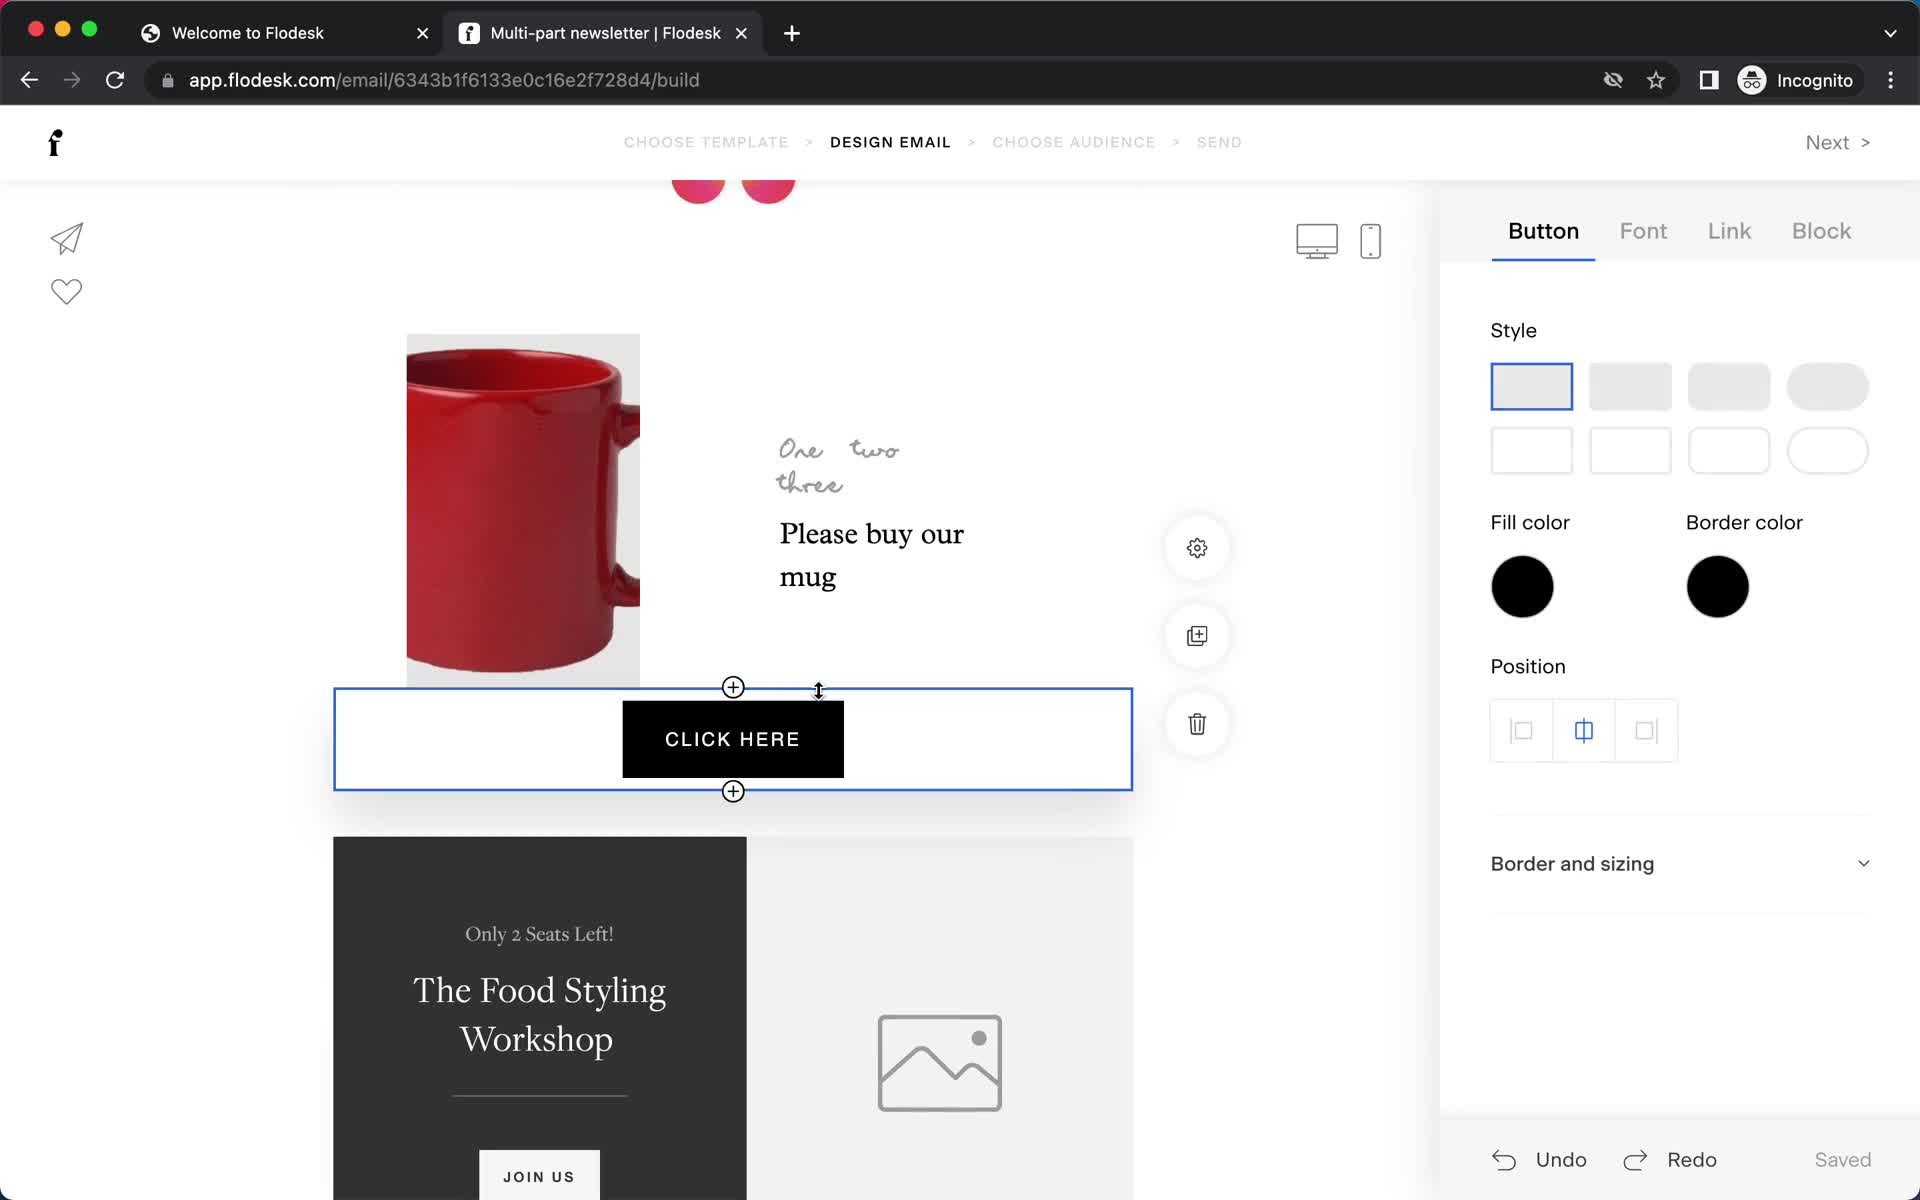
Edit style
this is title
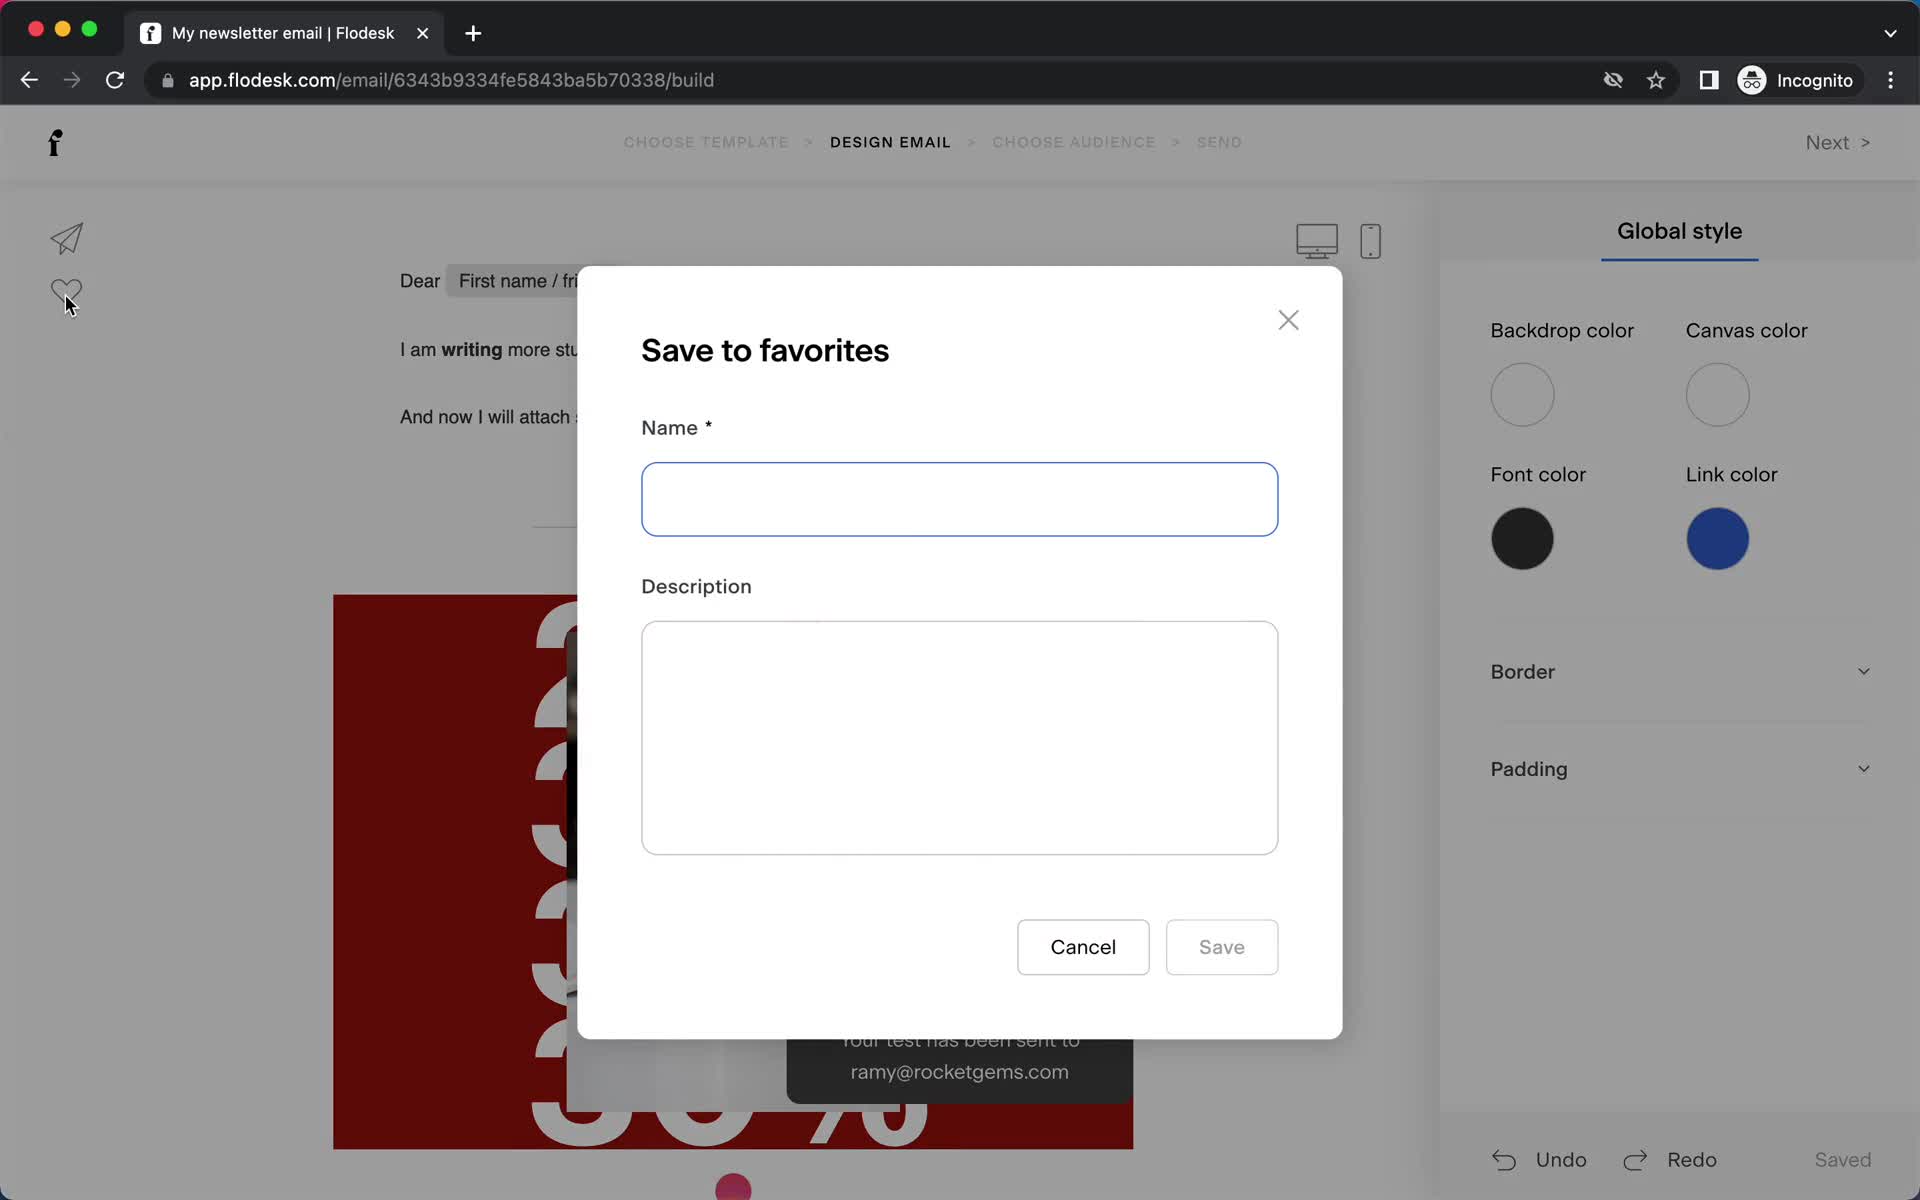
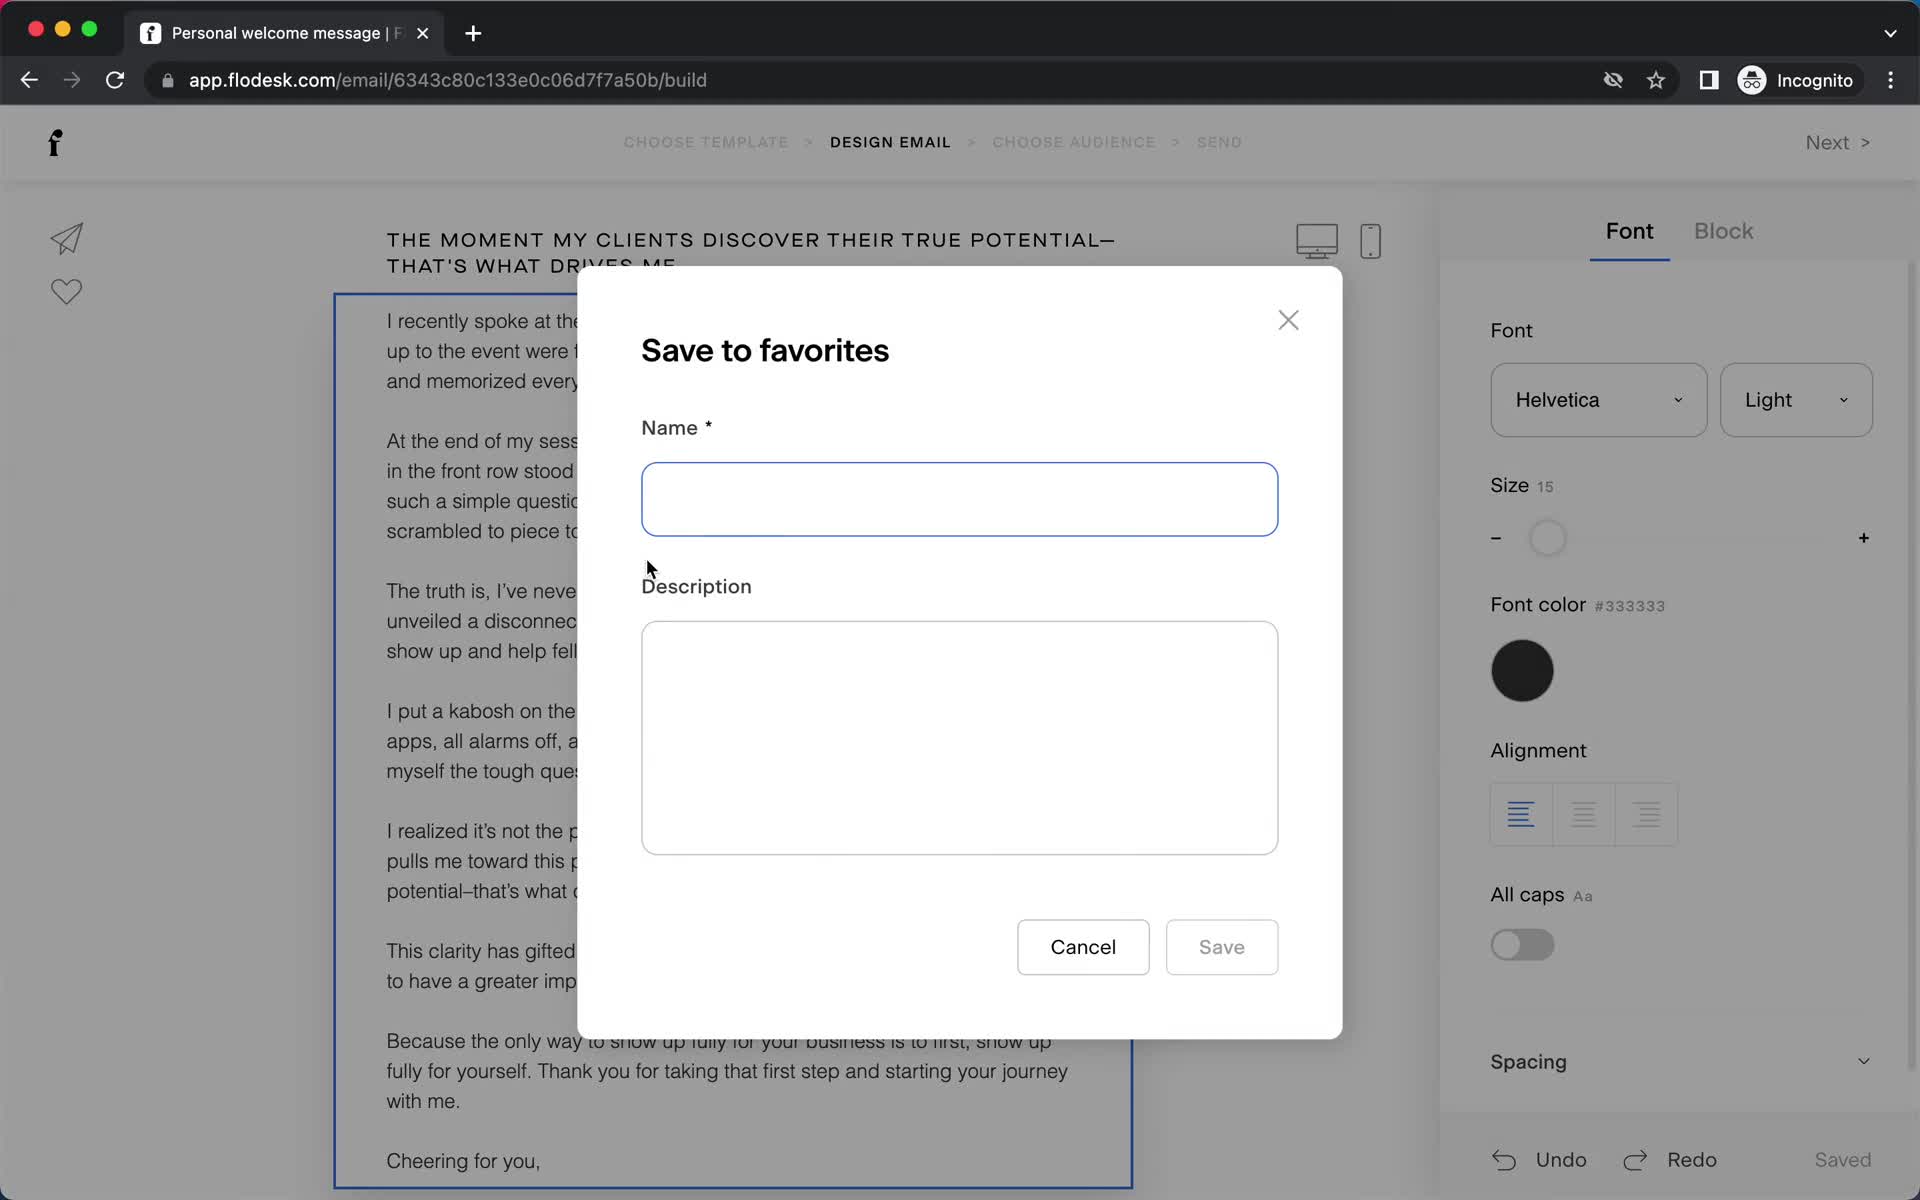
Save
this is title
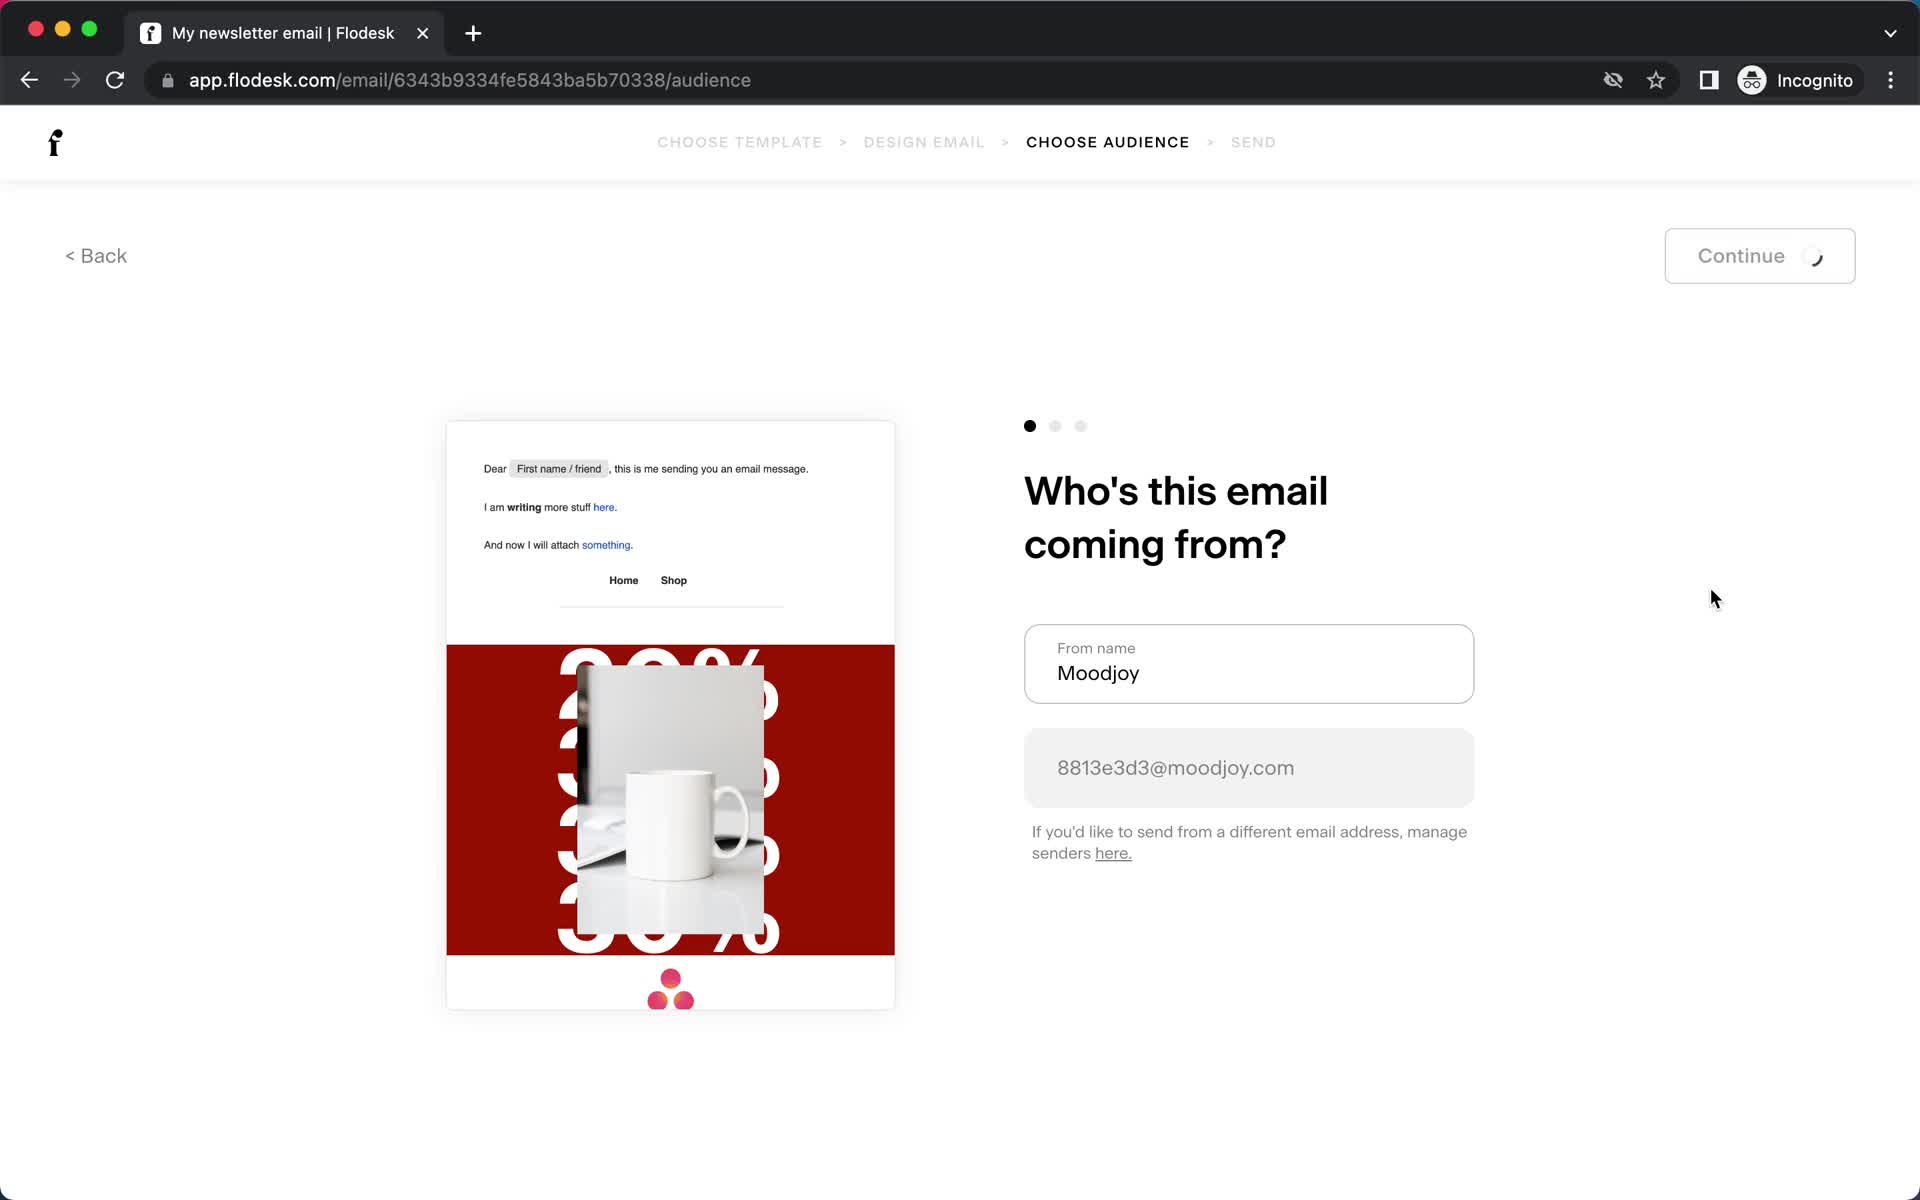
Set from email
this is title
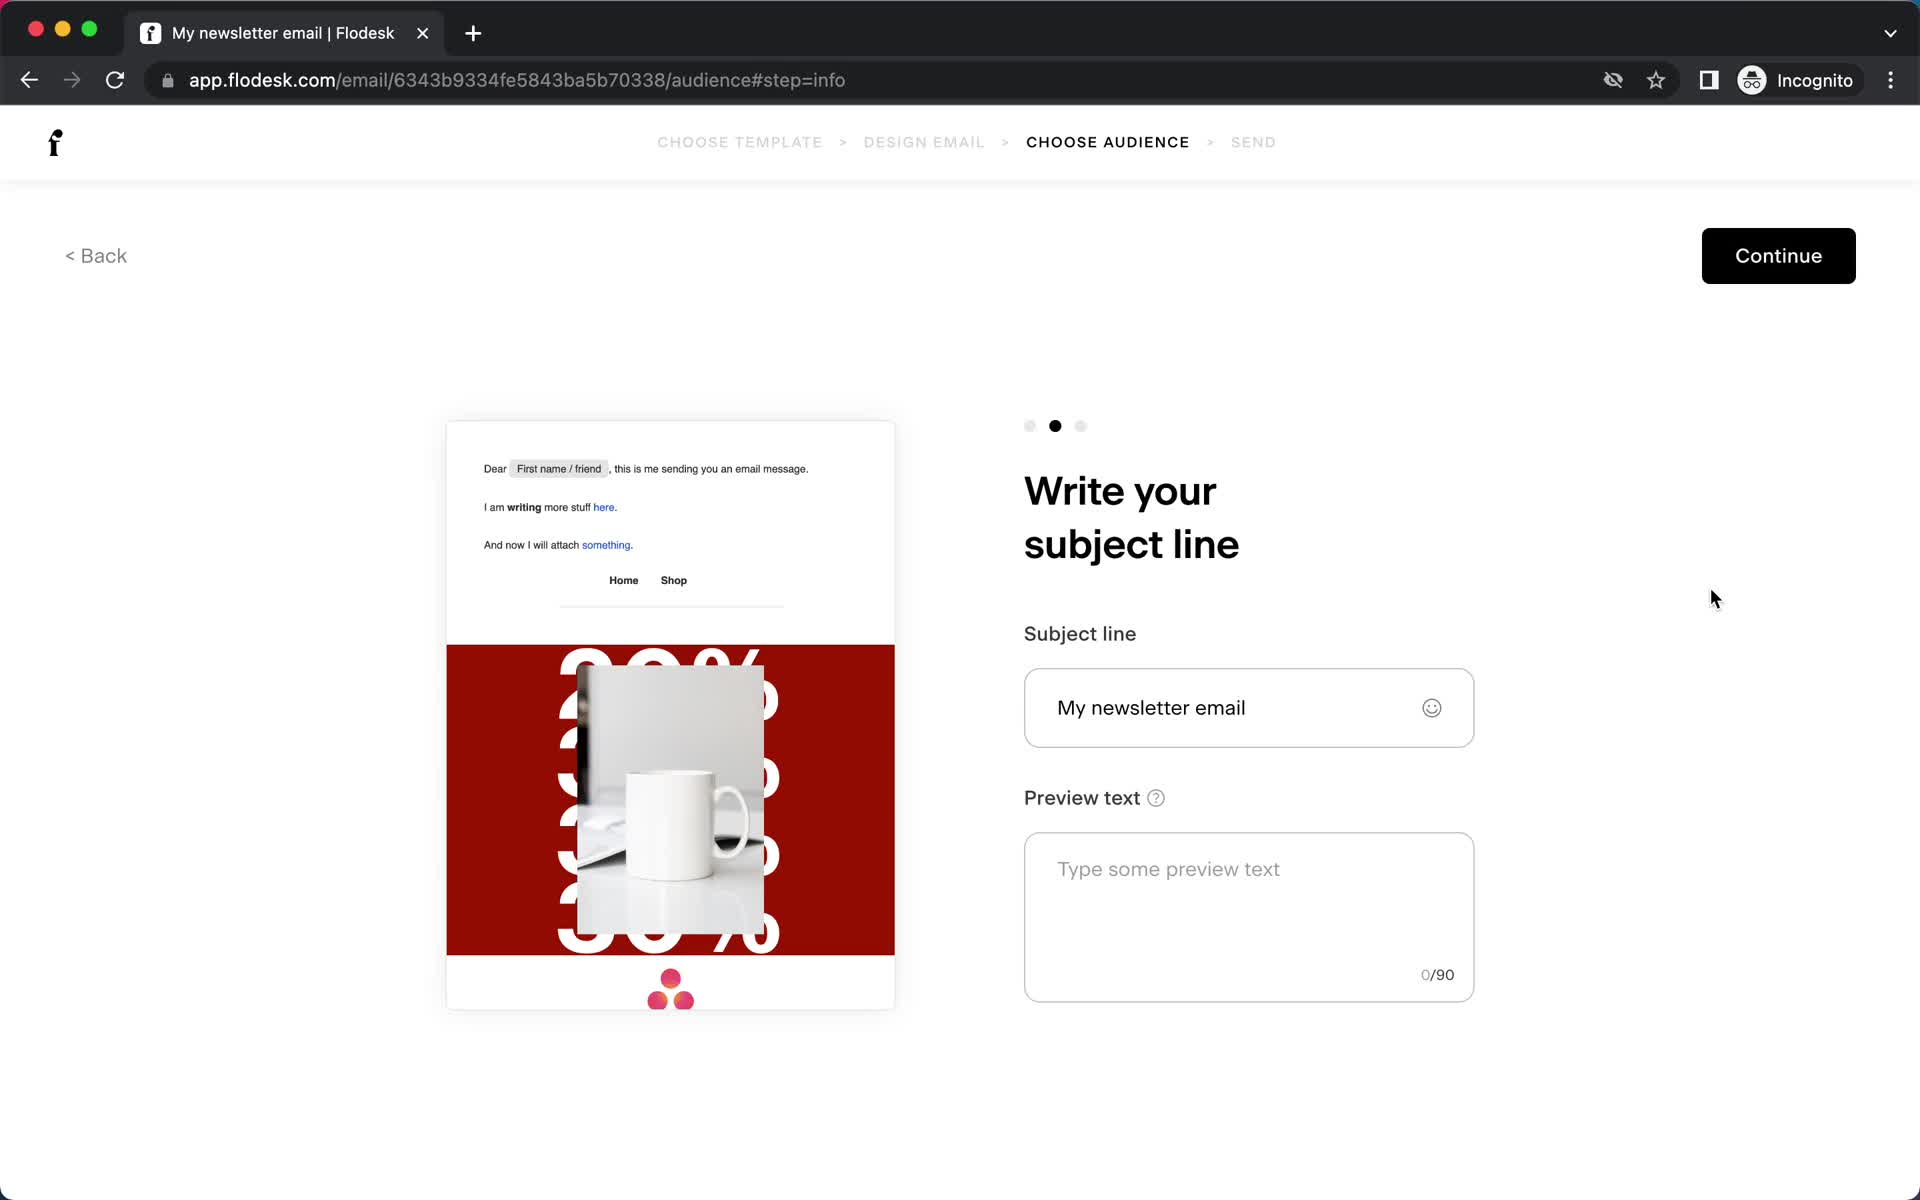
Add subject
this is title
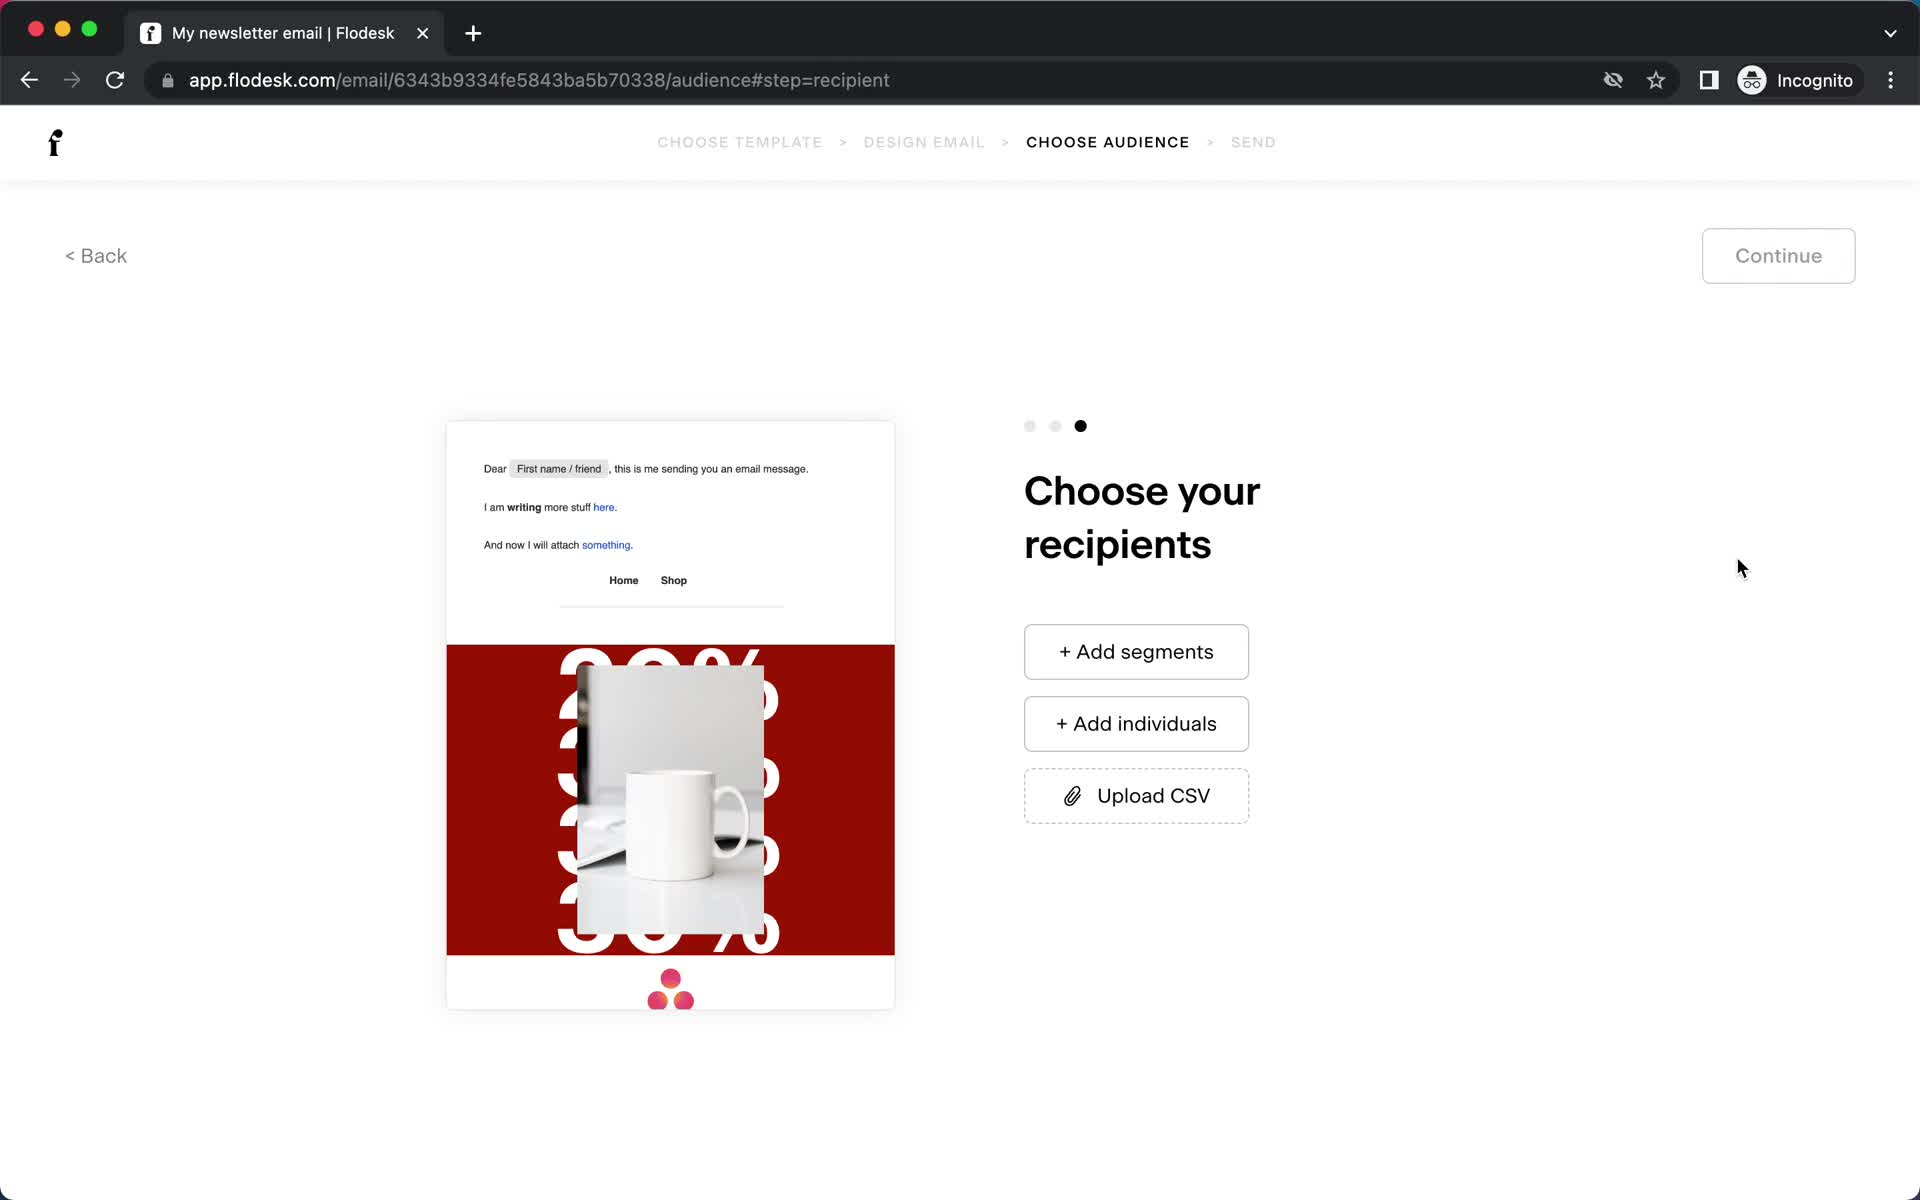
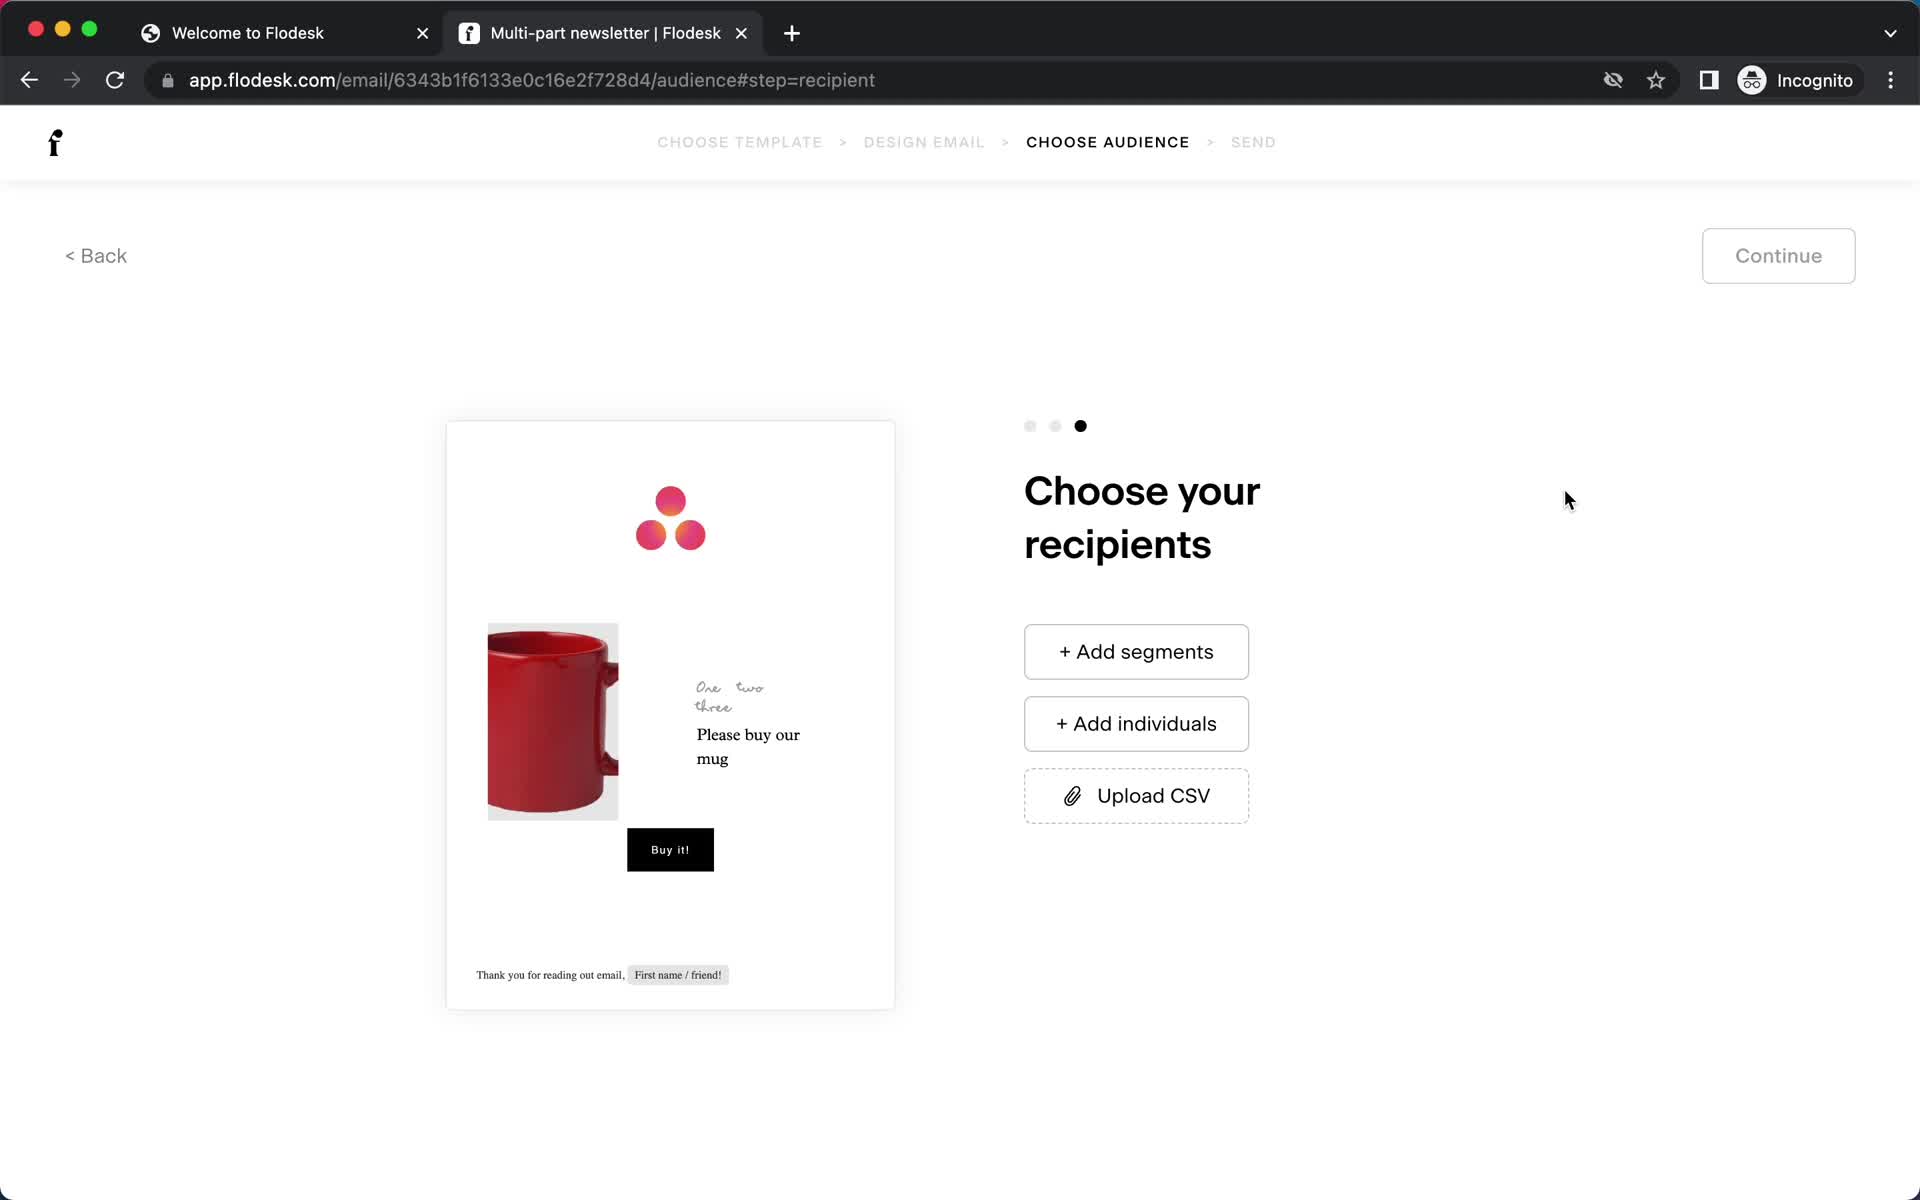
Add recipients
this is title
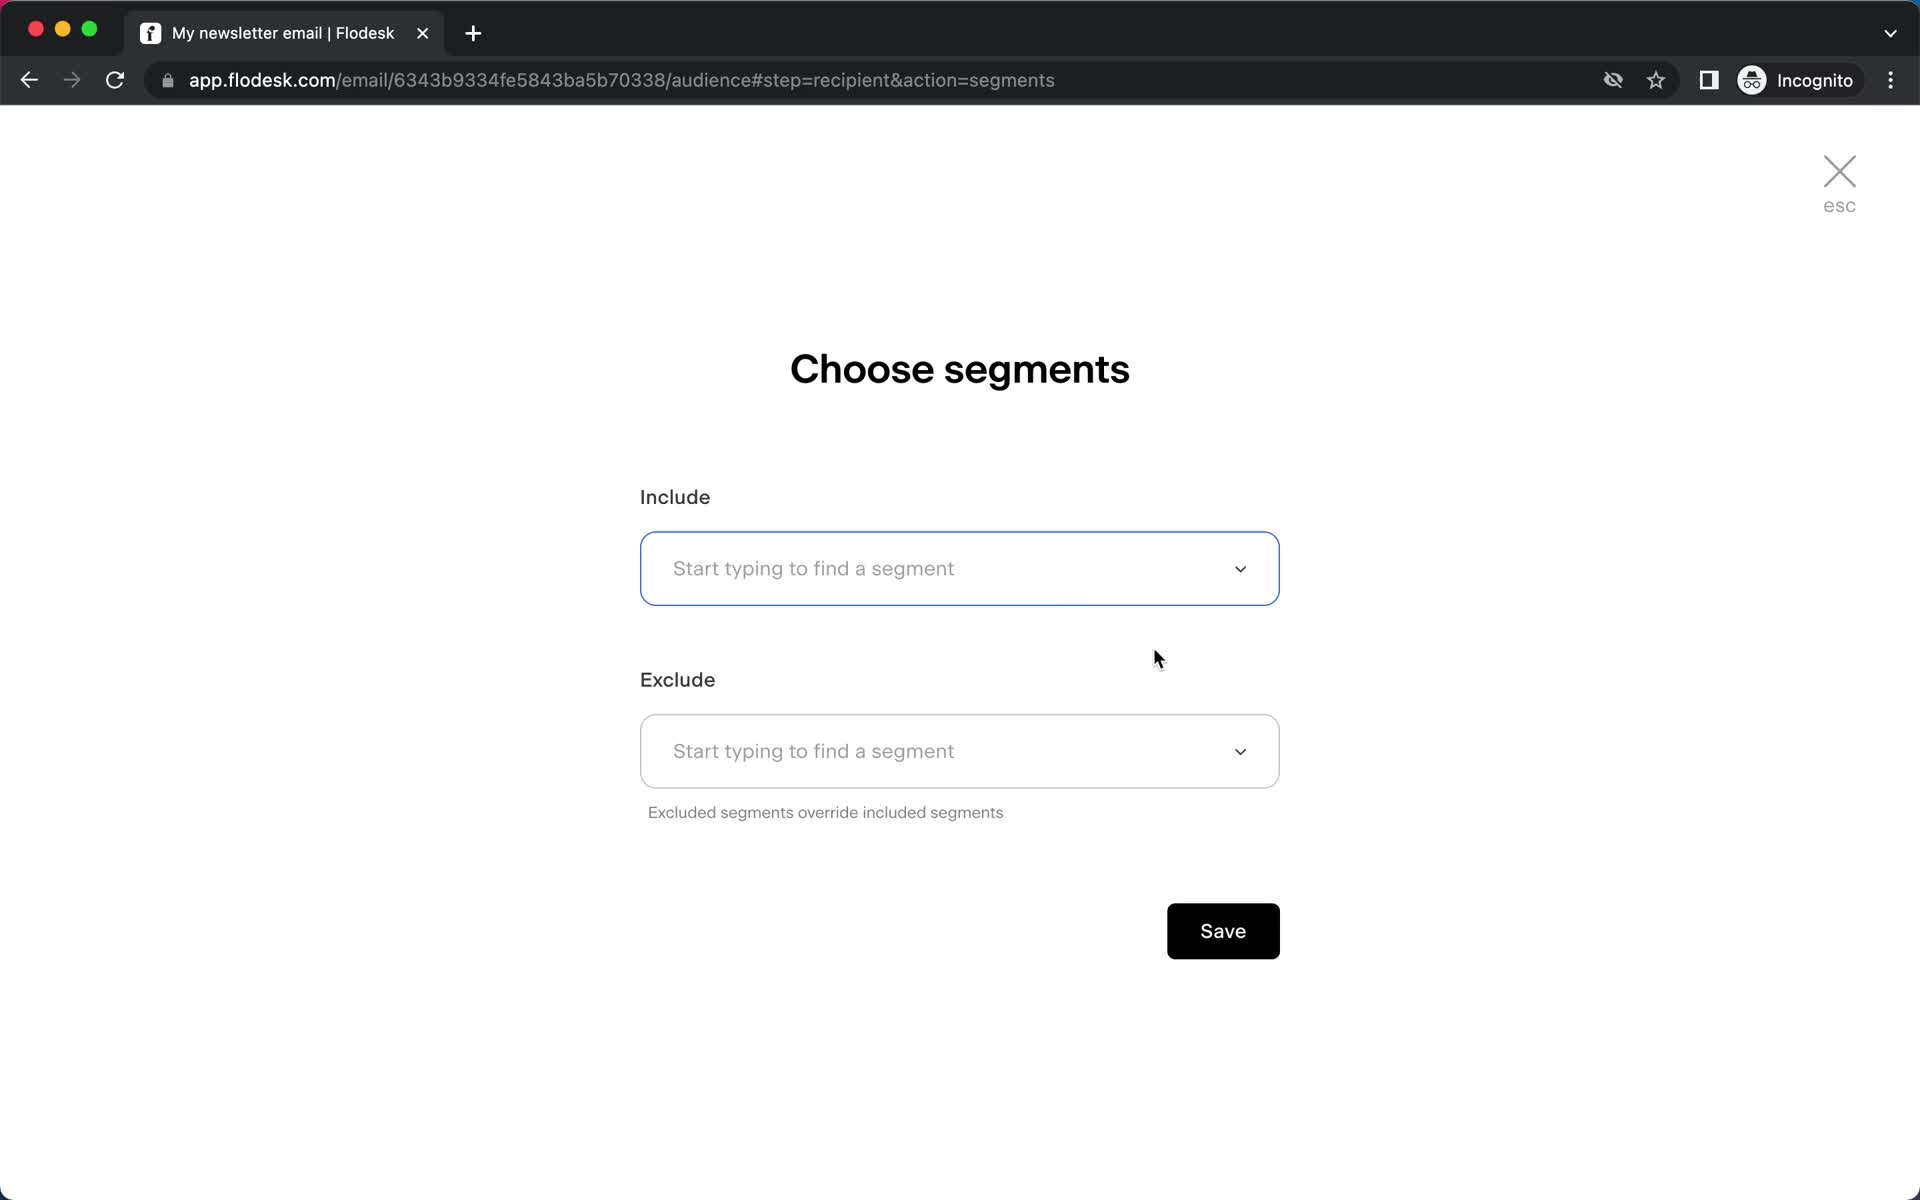
Select segments
this is title
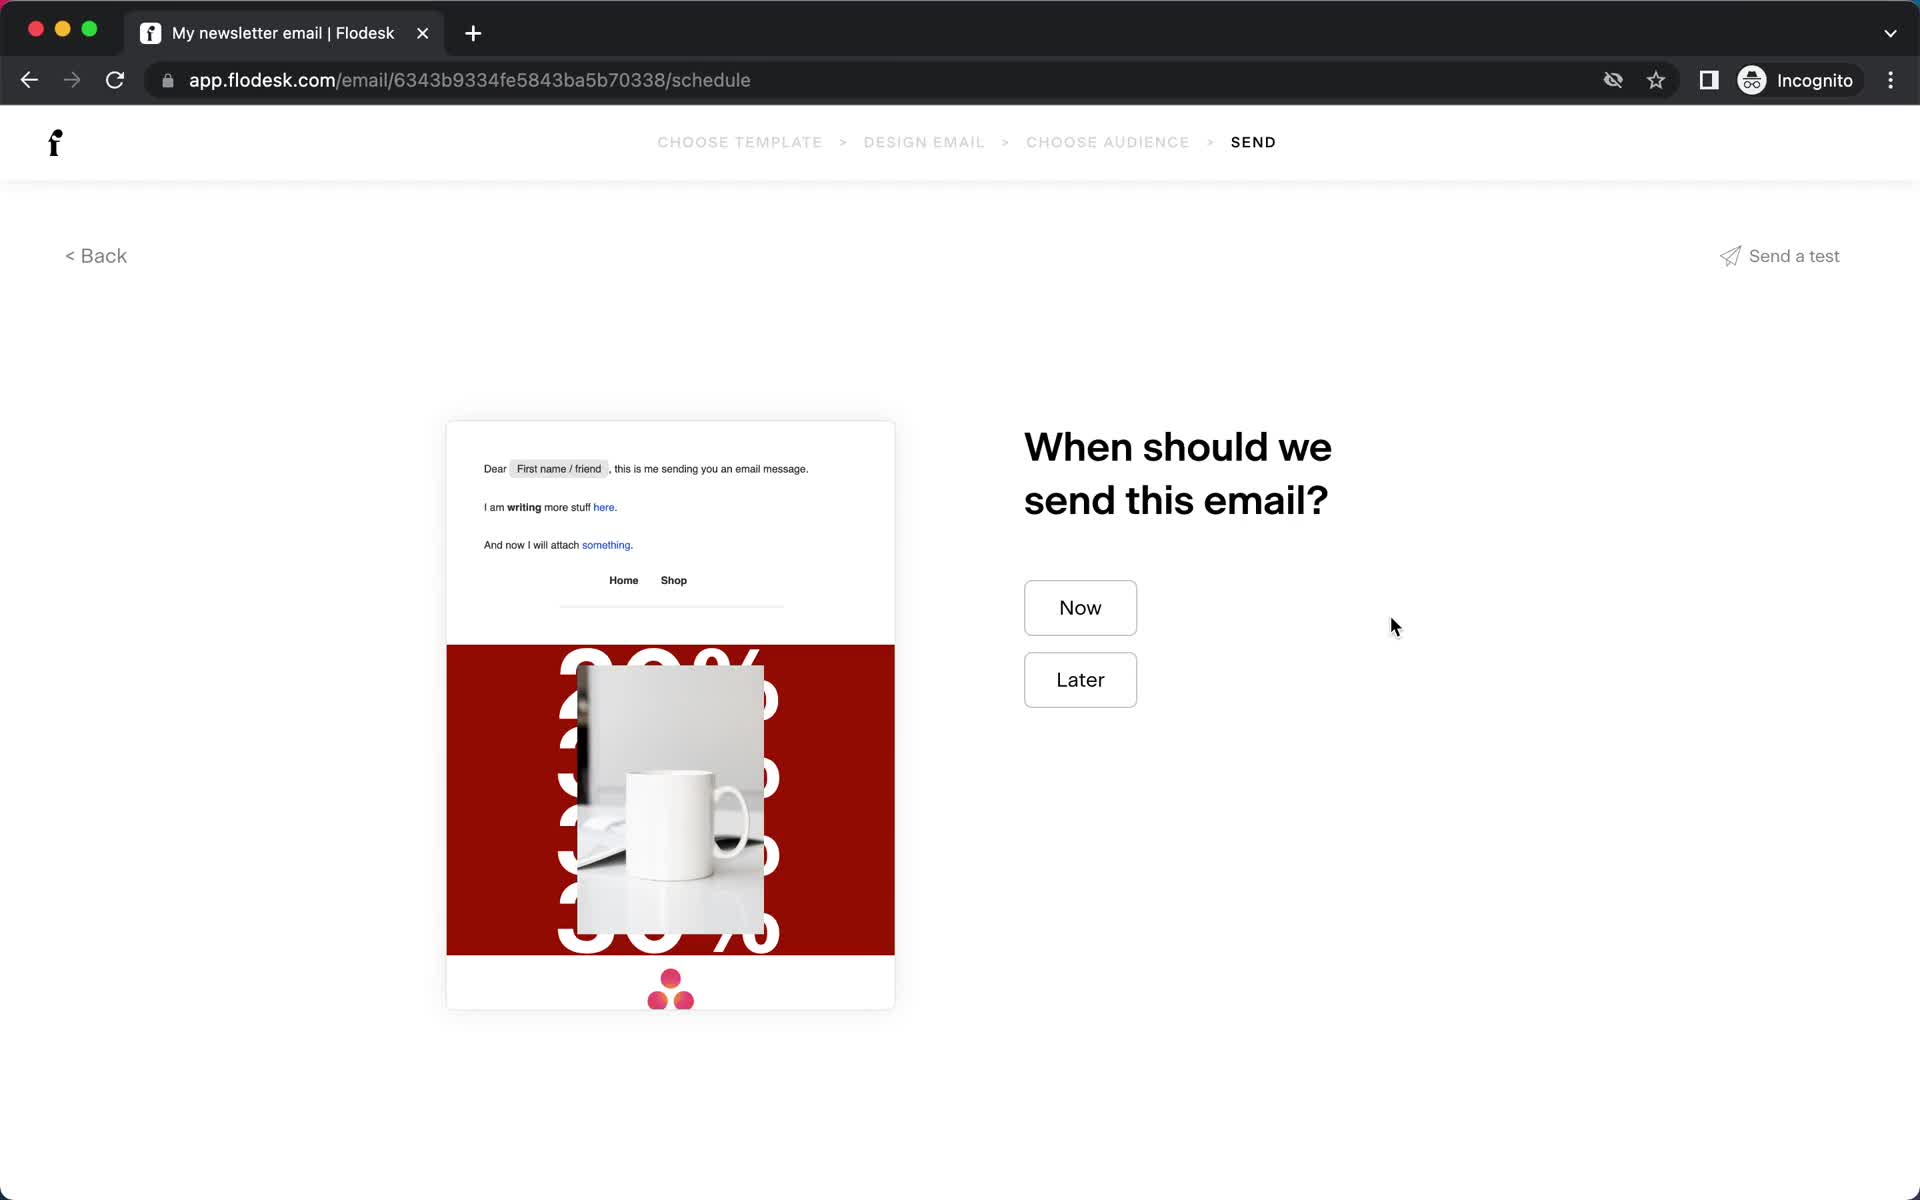
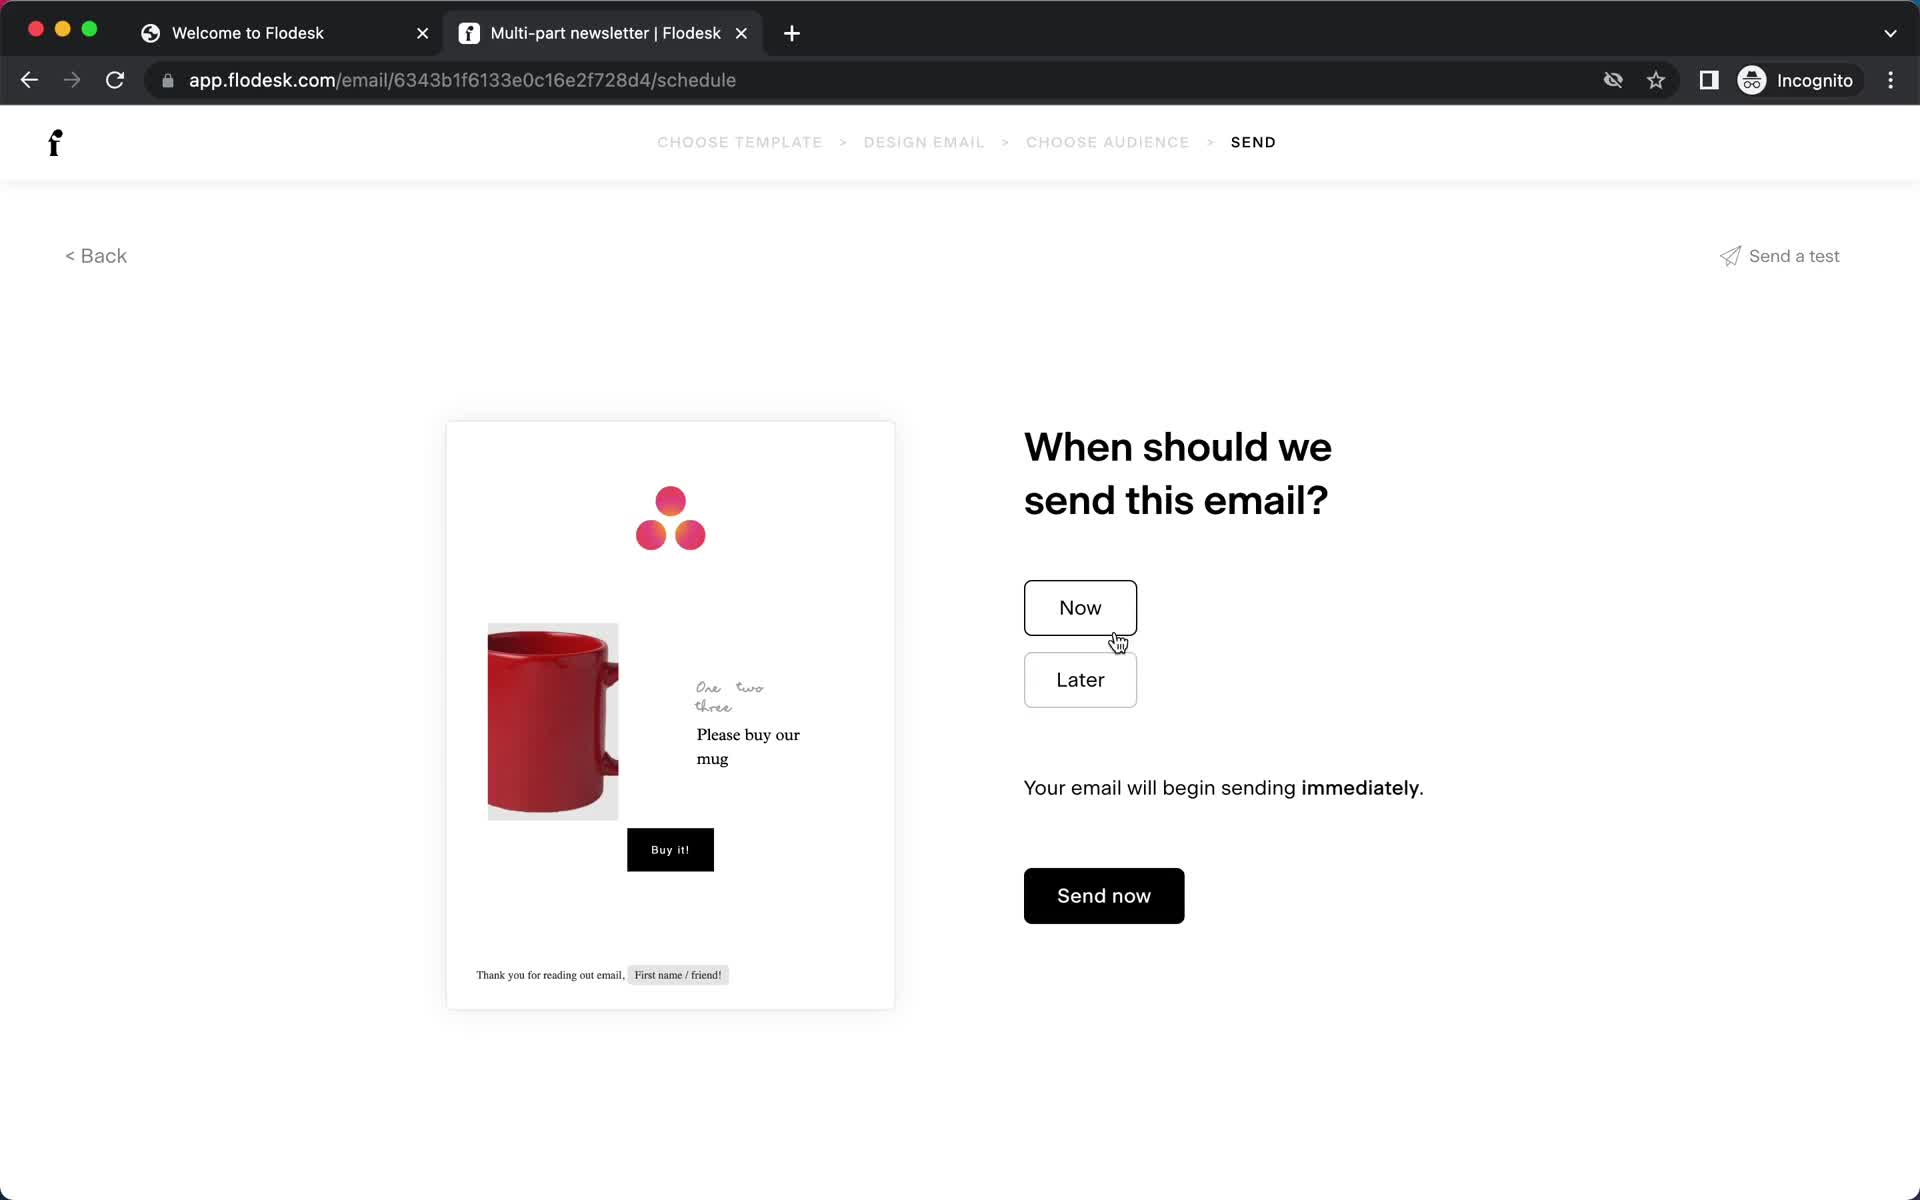
Send email
this is title
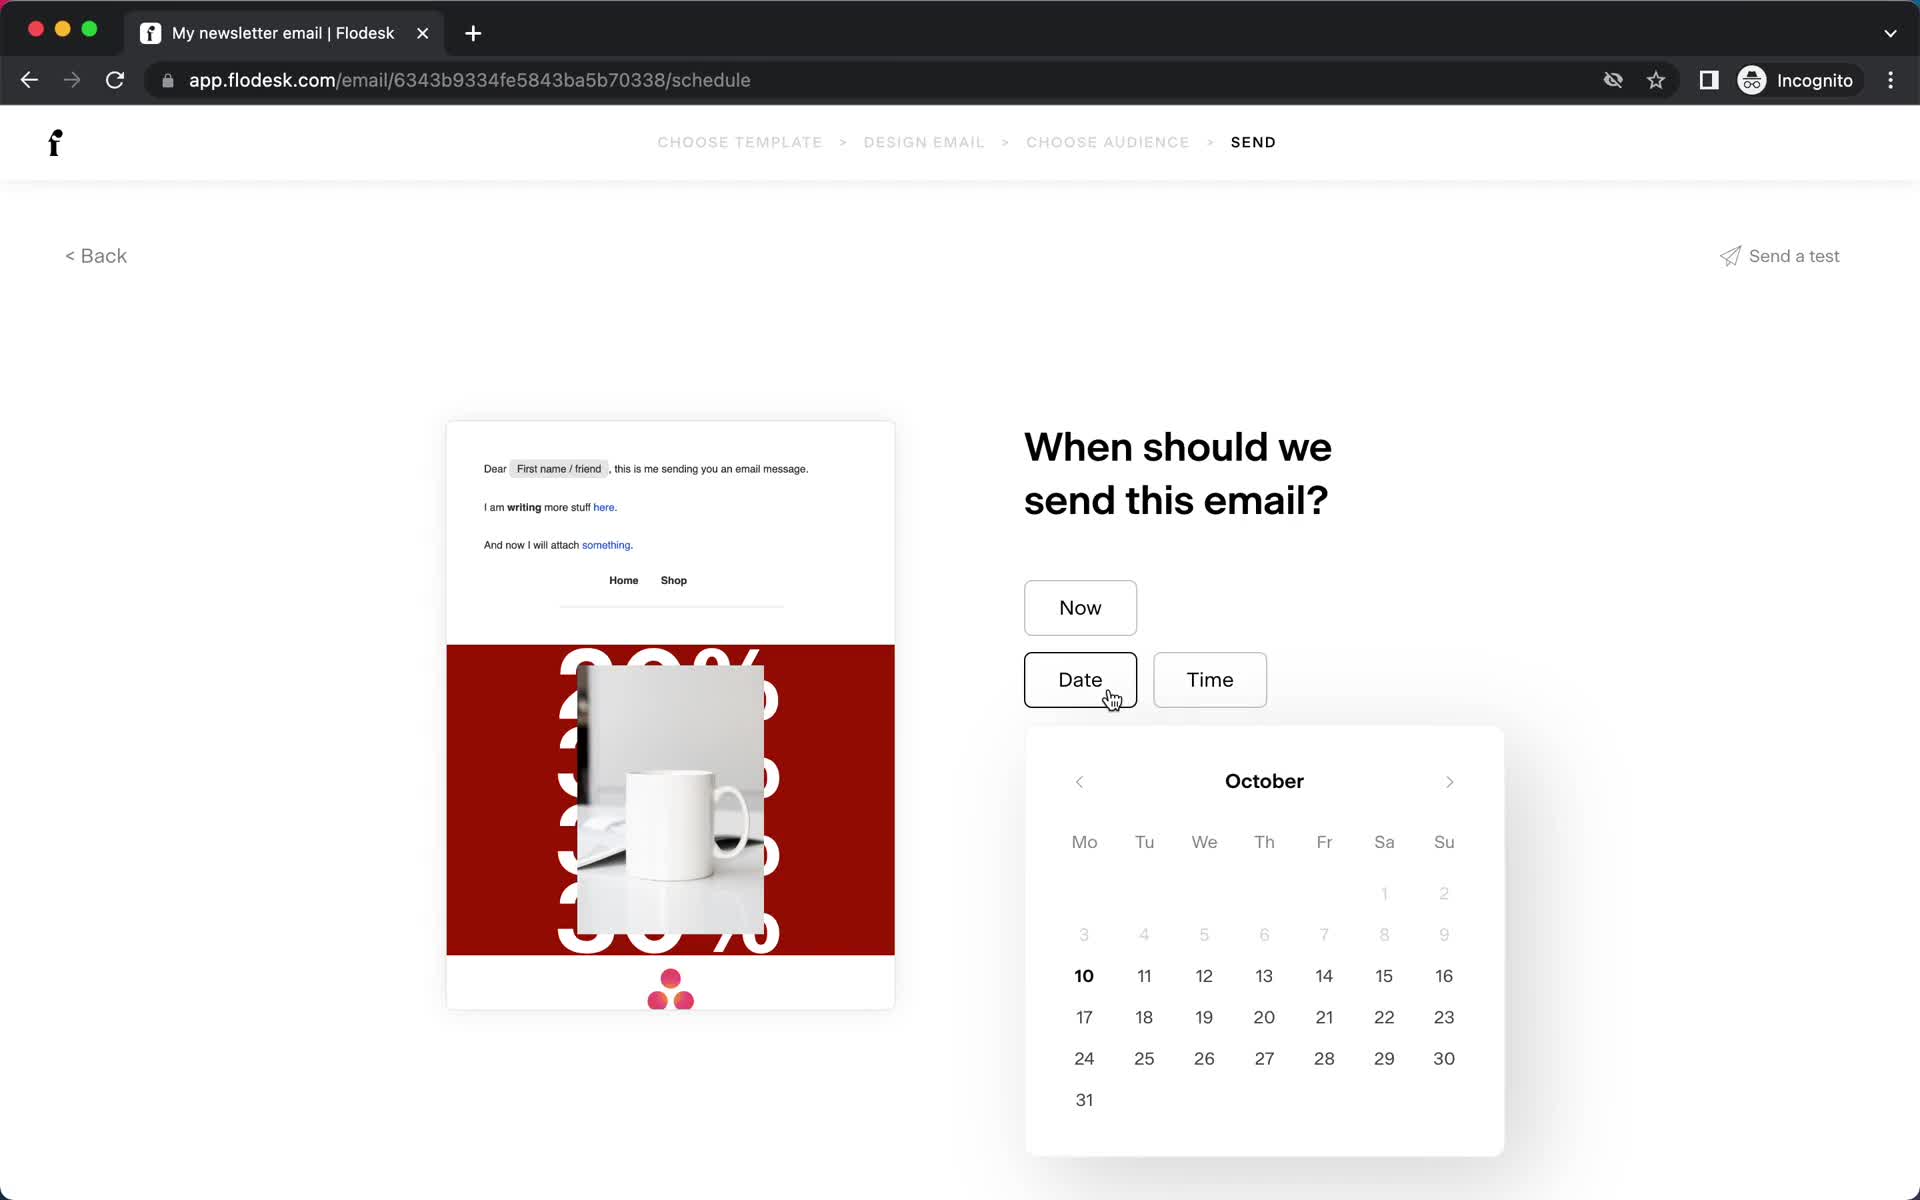
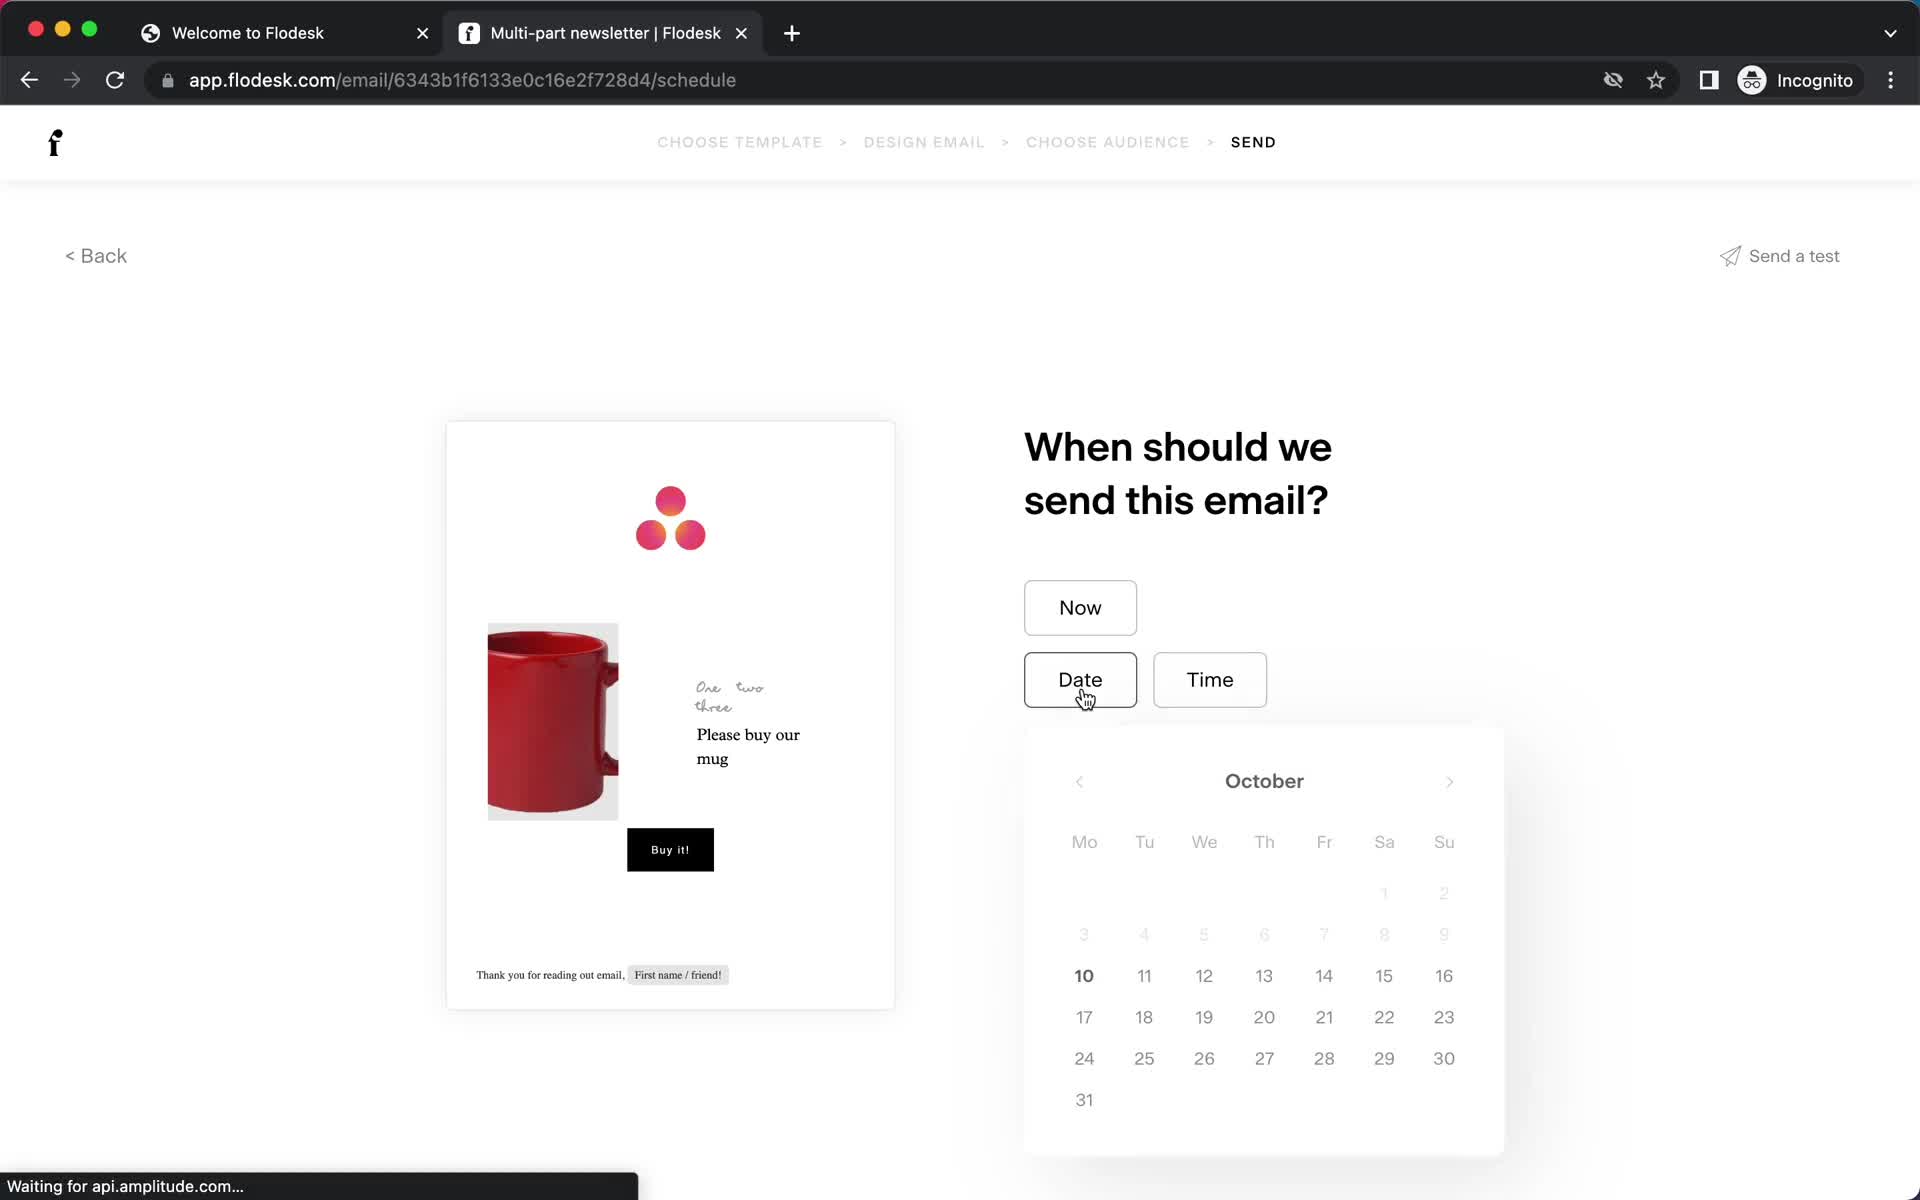
Schedule
this is title
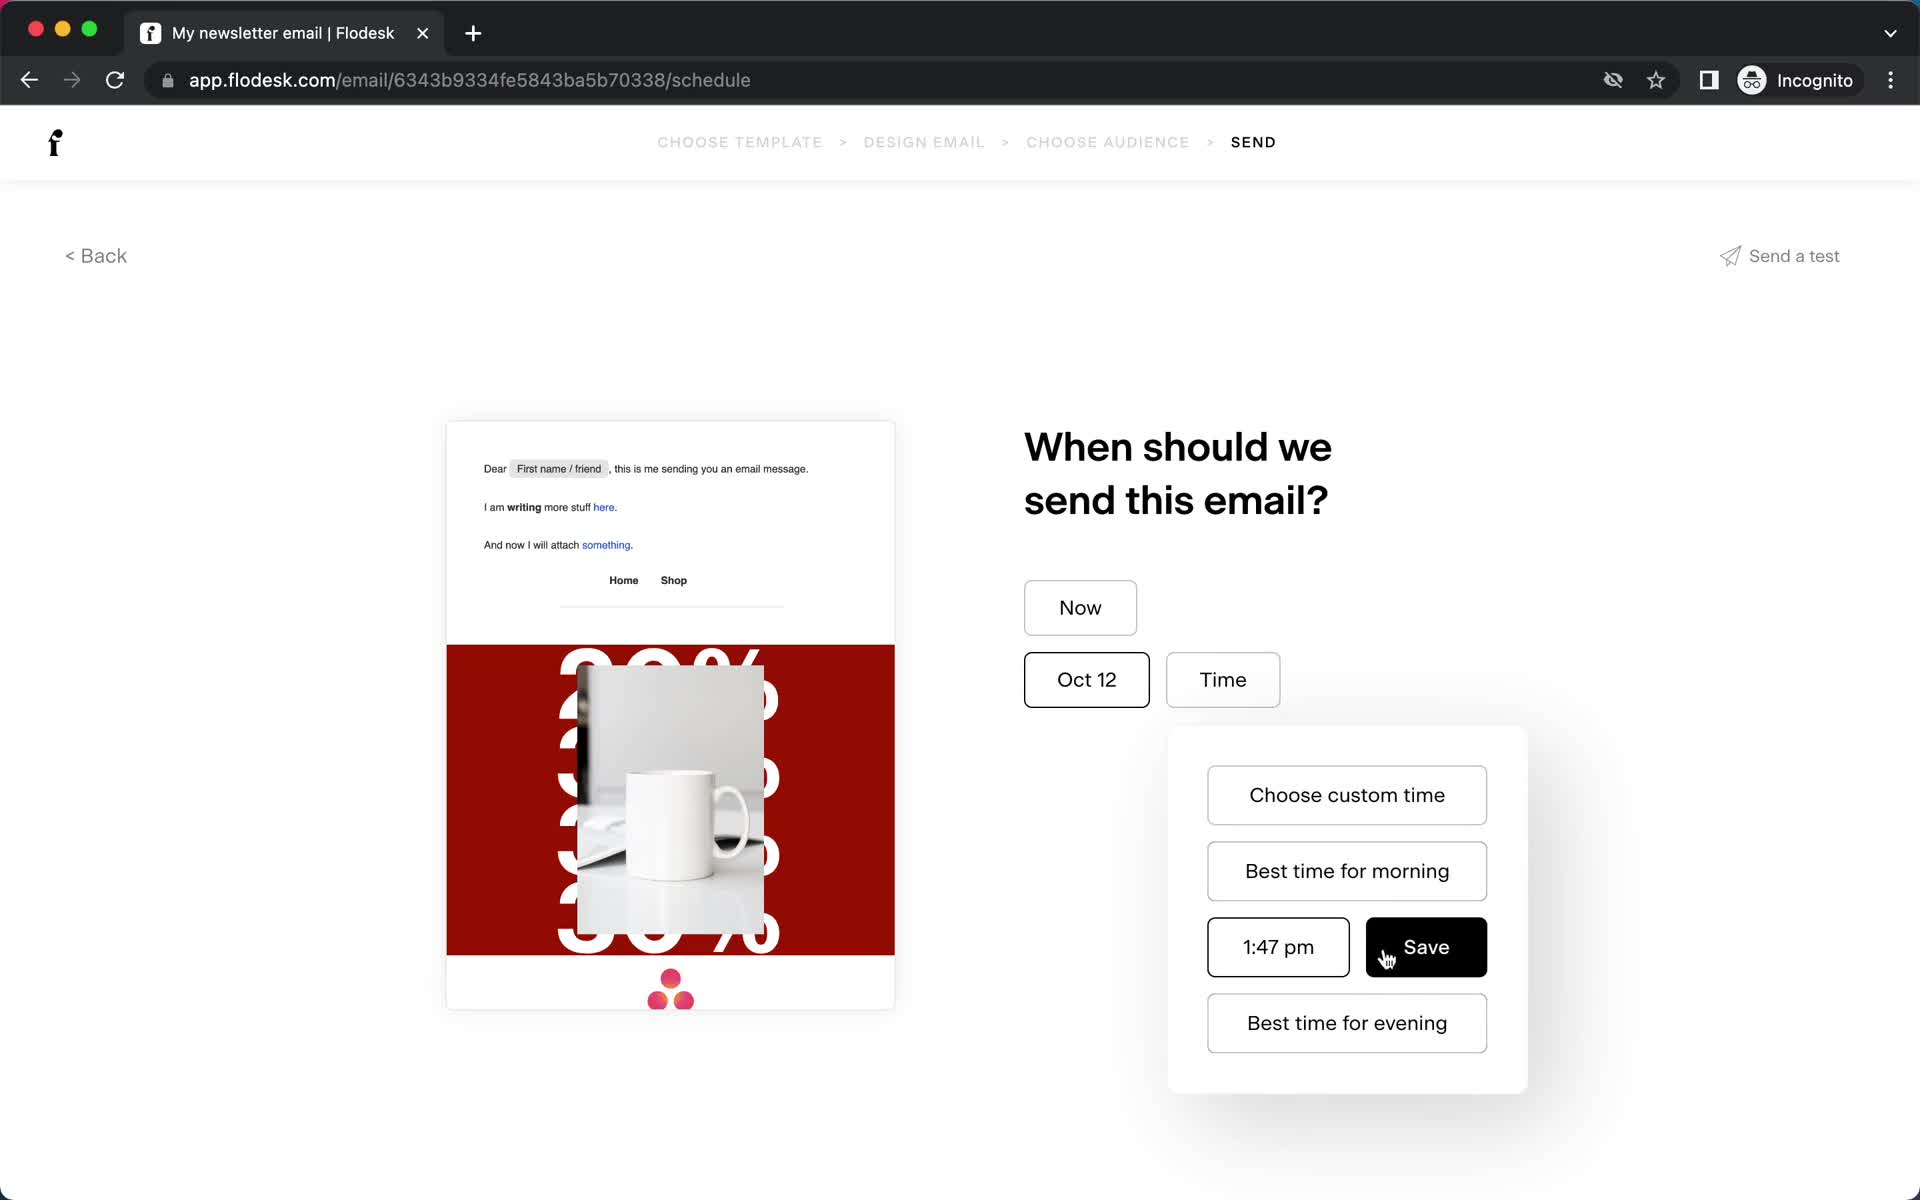
Schedule
this is title
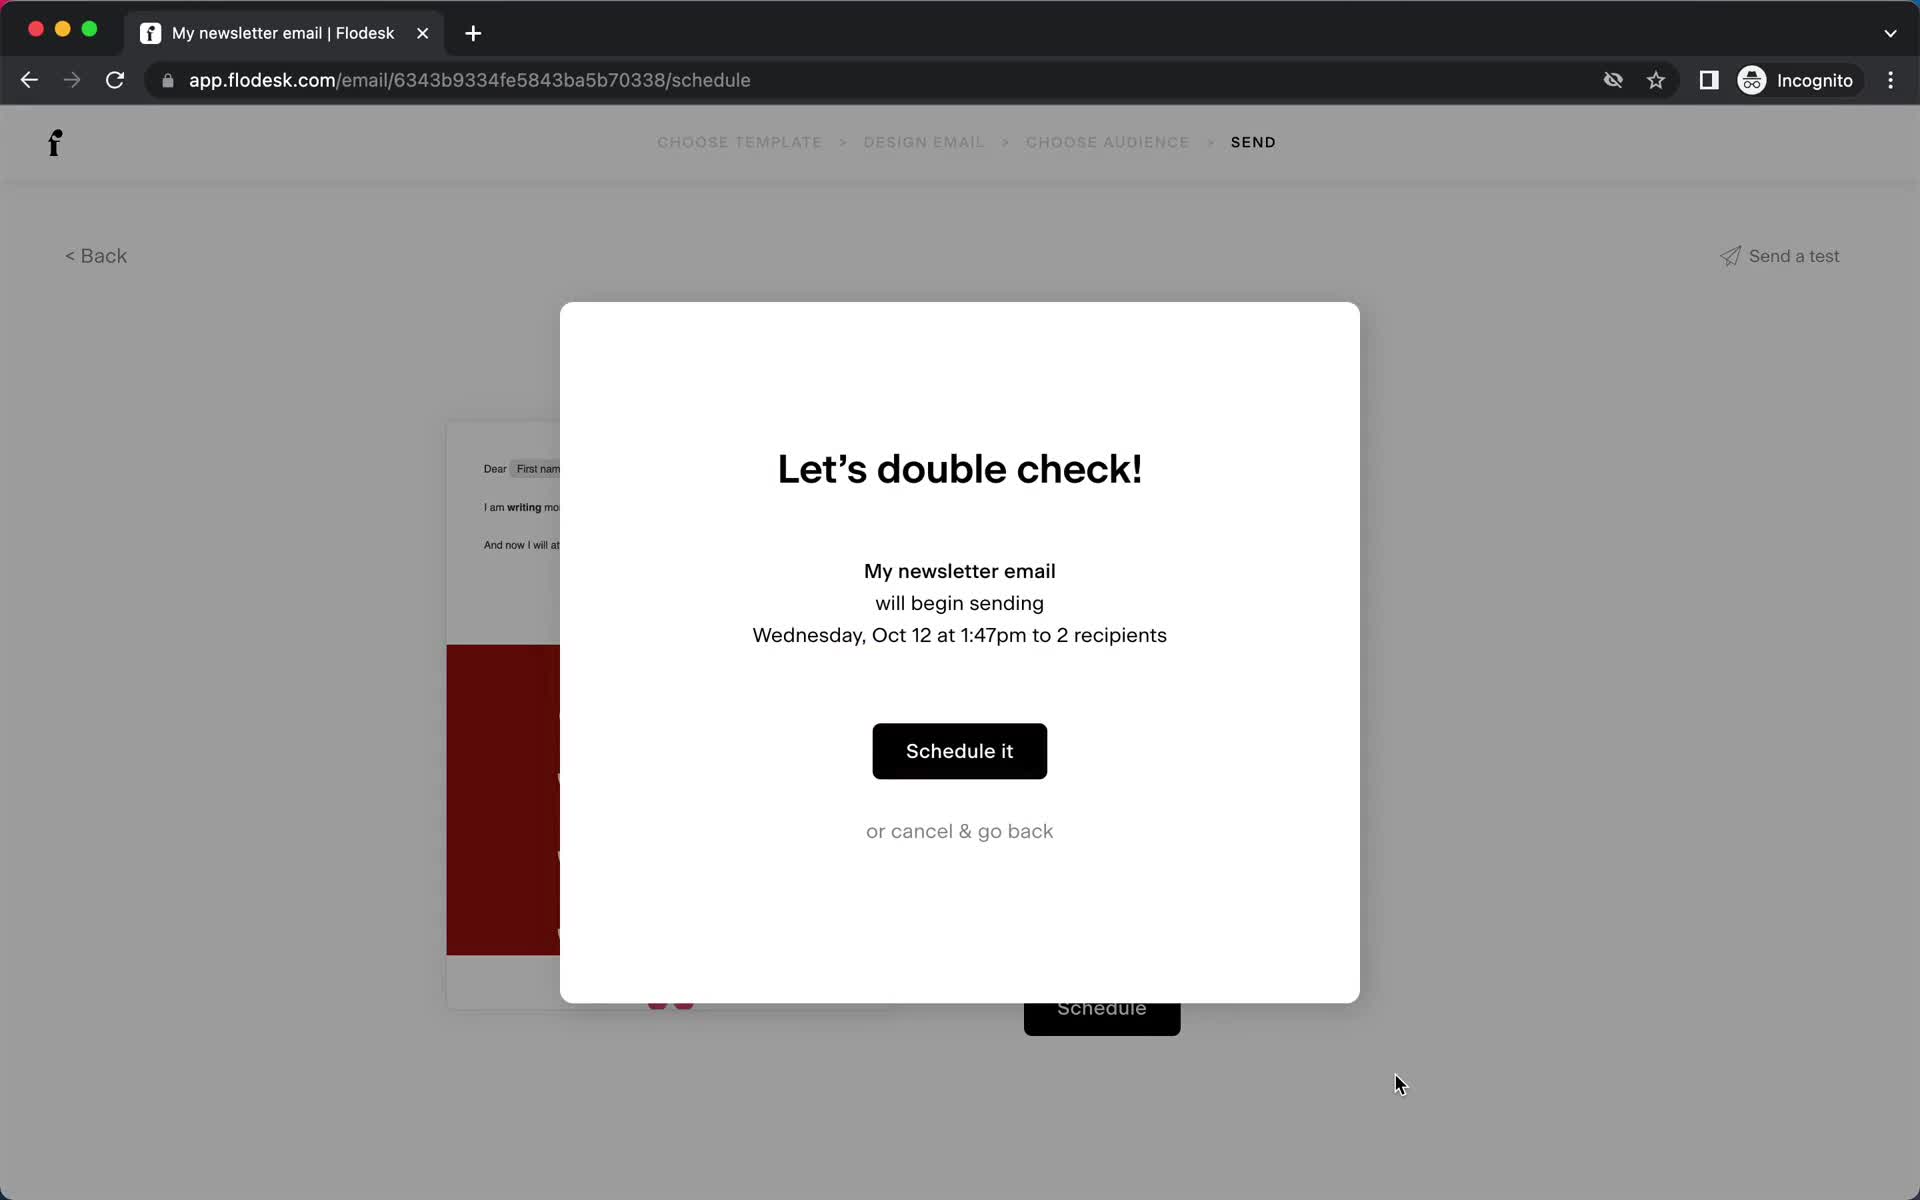
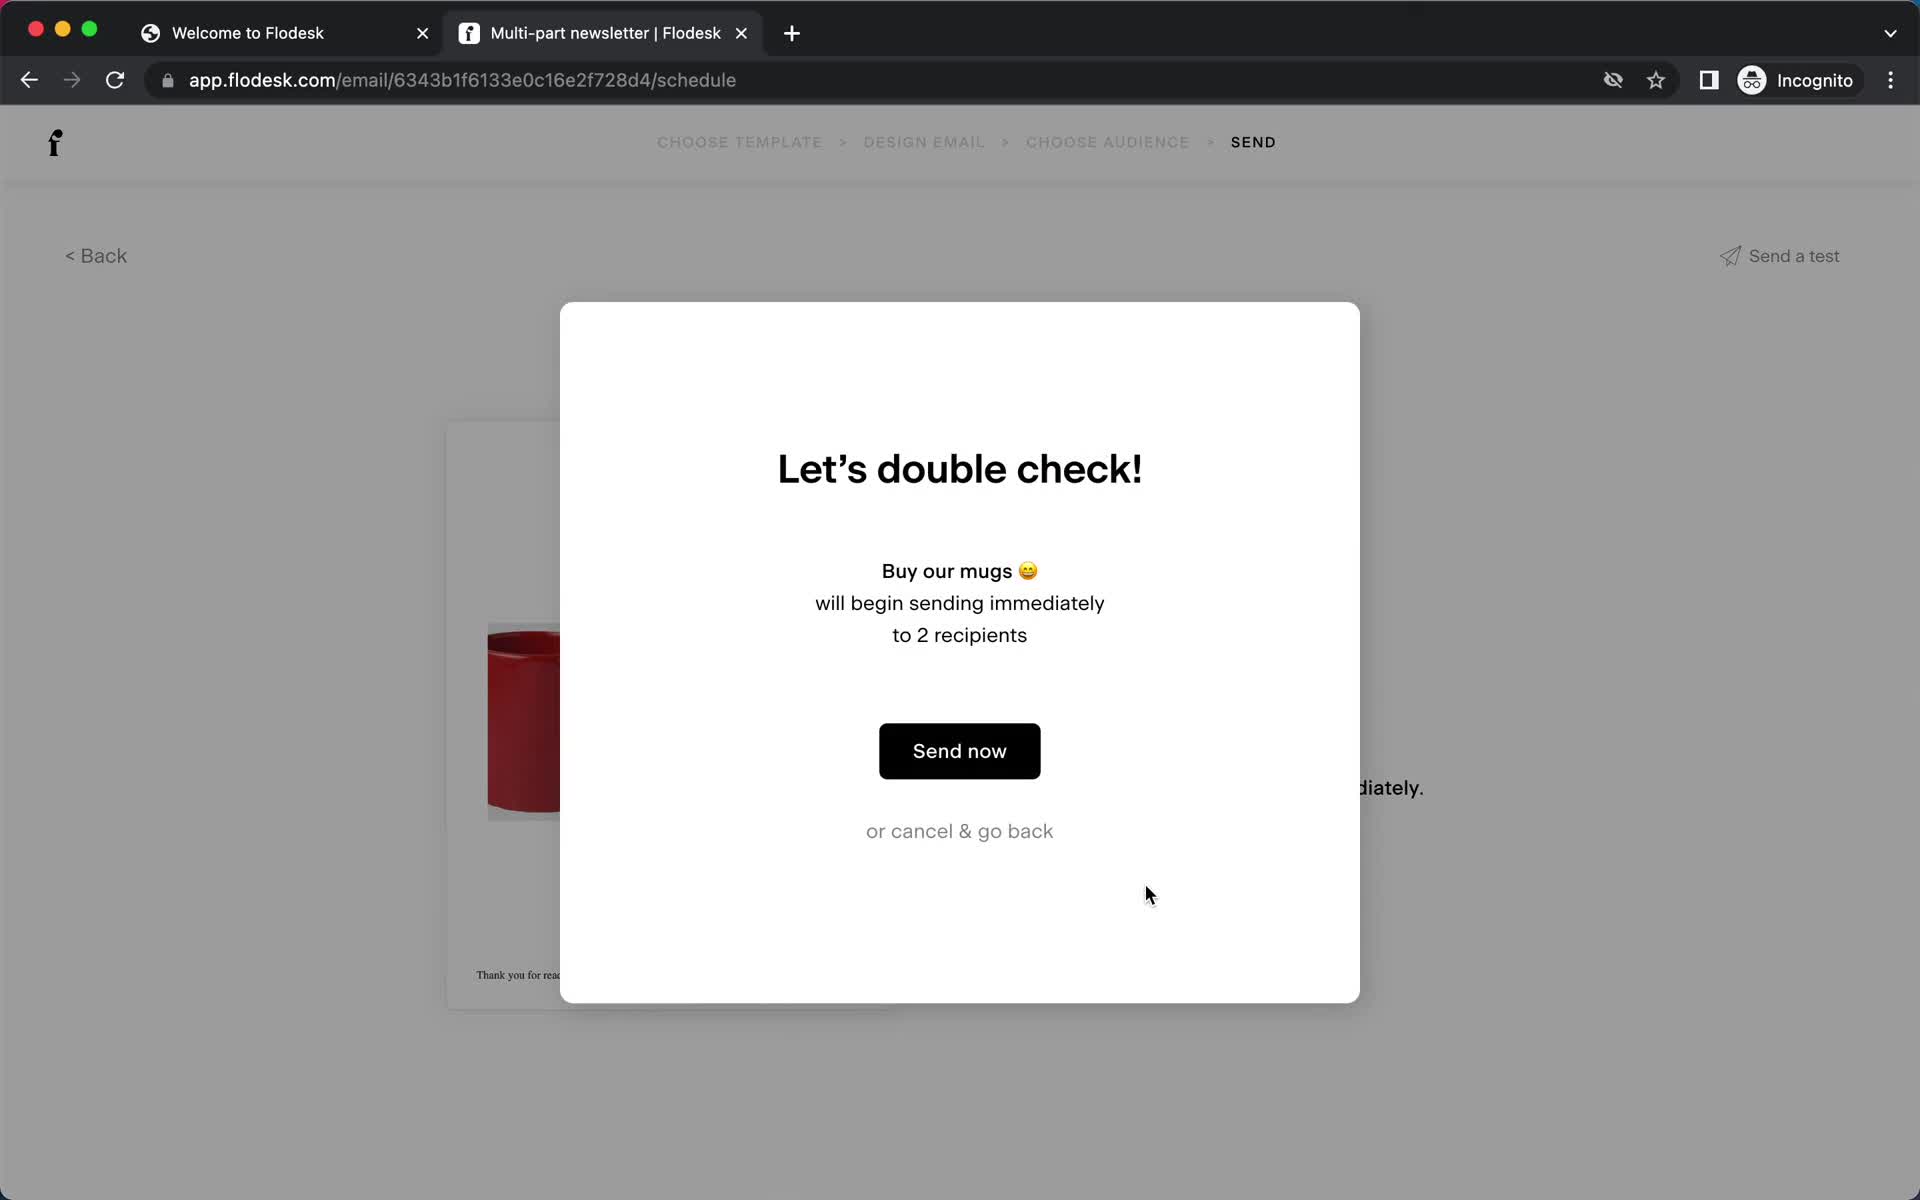
Confirm
this is title
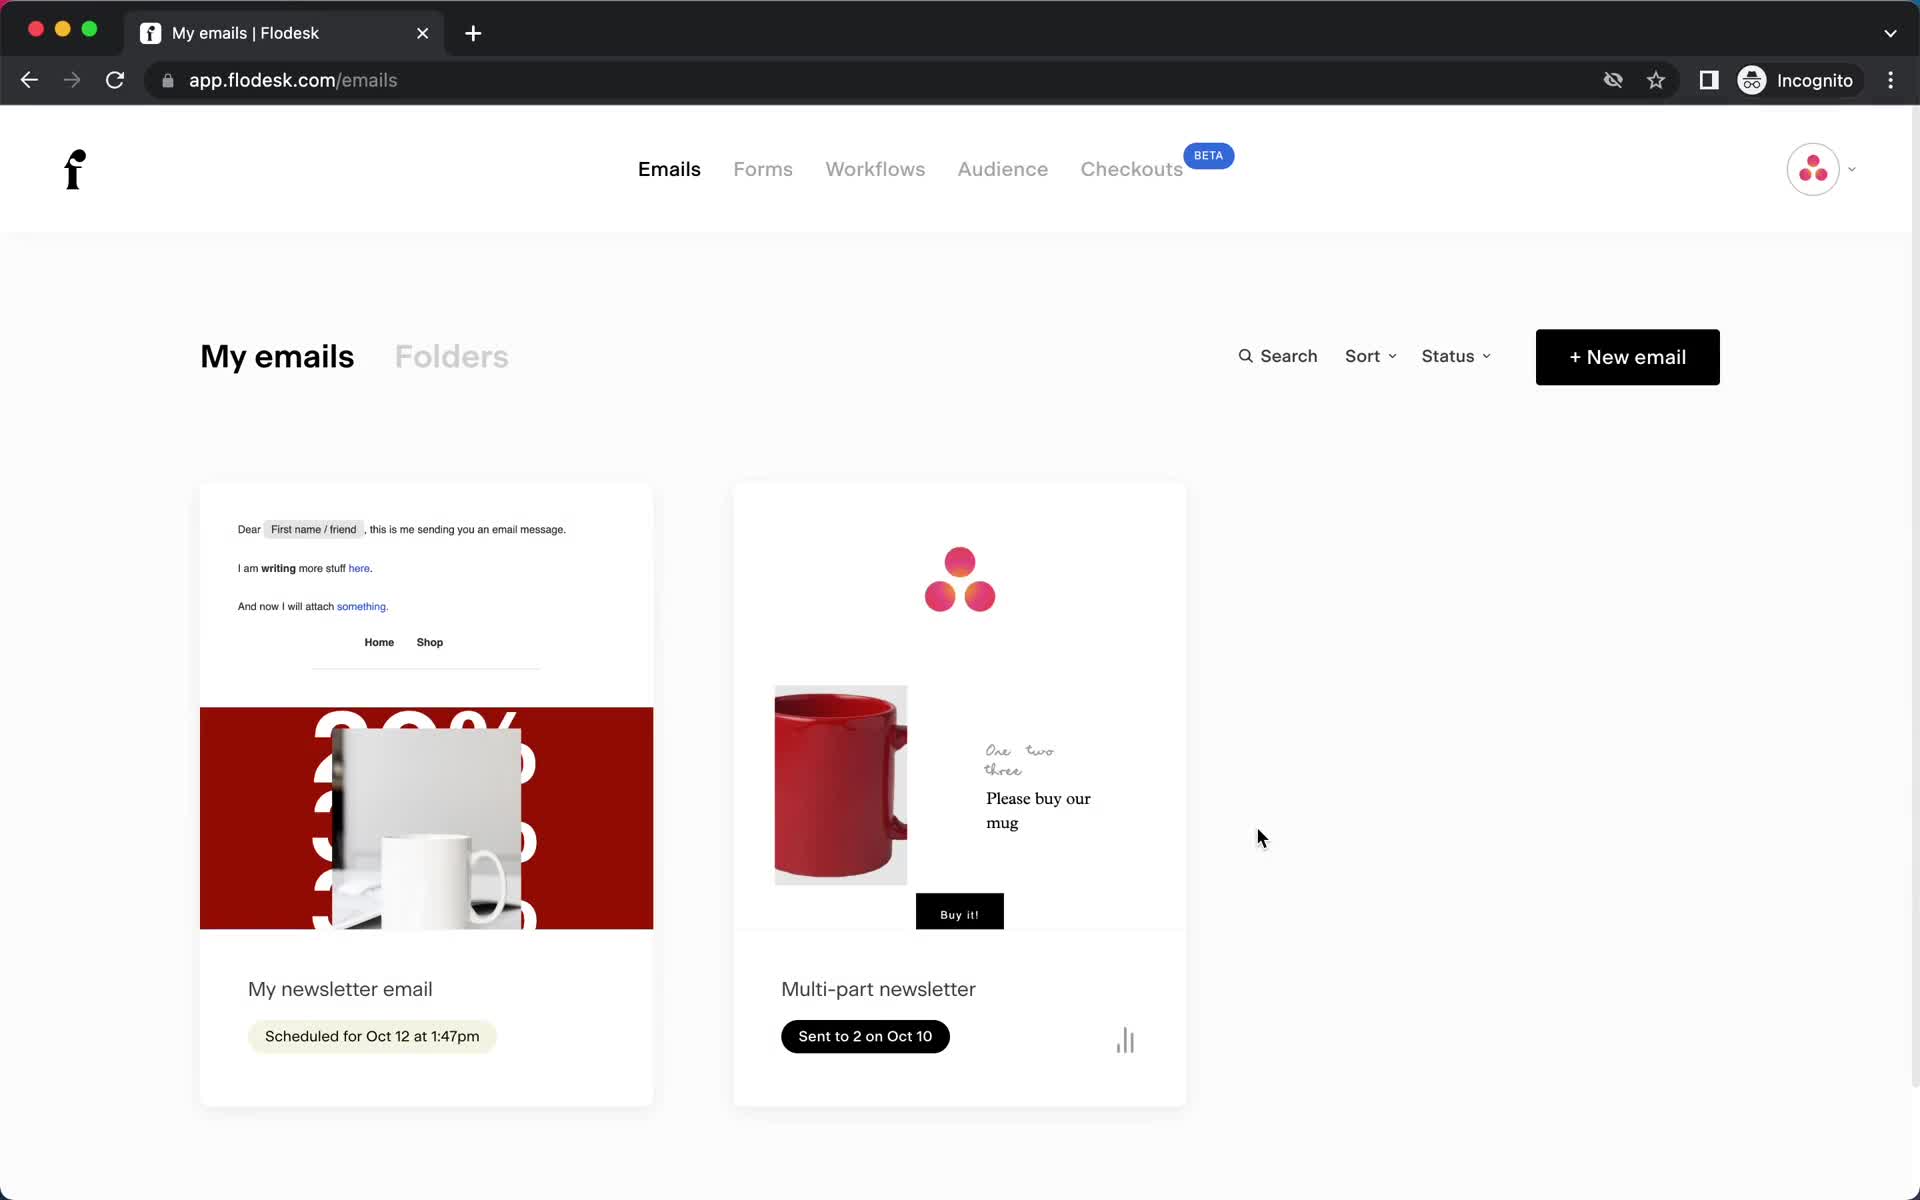
Email campaigns
this is title
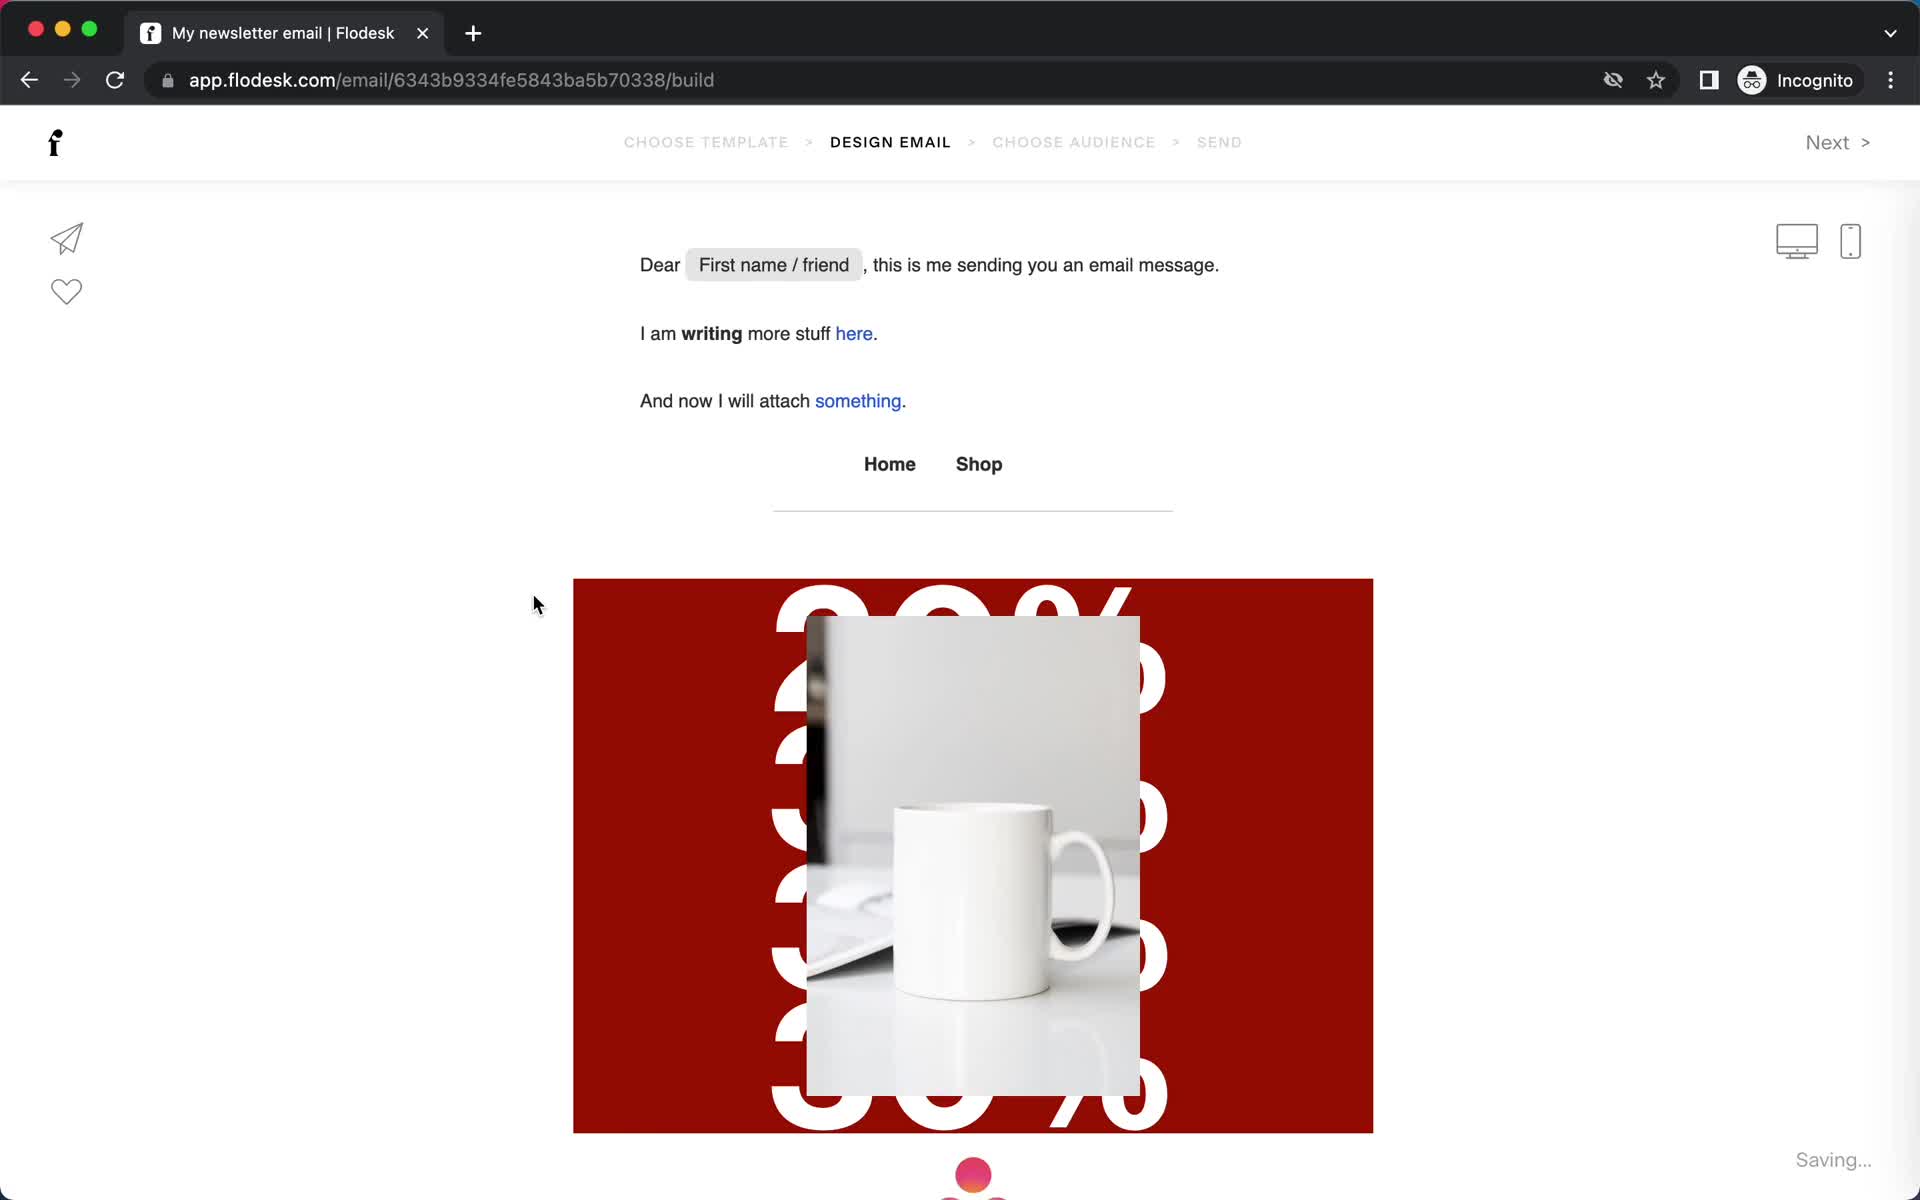
Editor
this is title
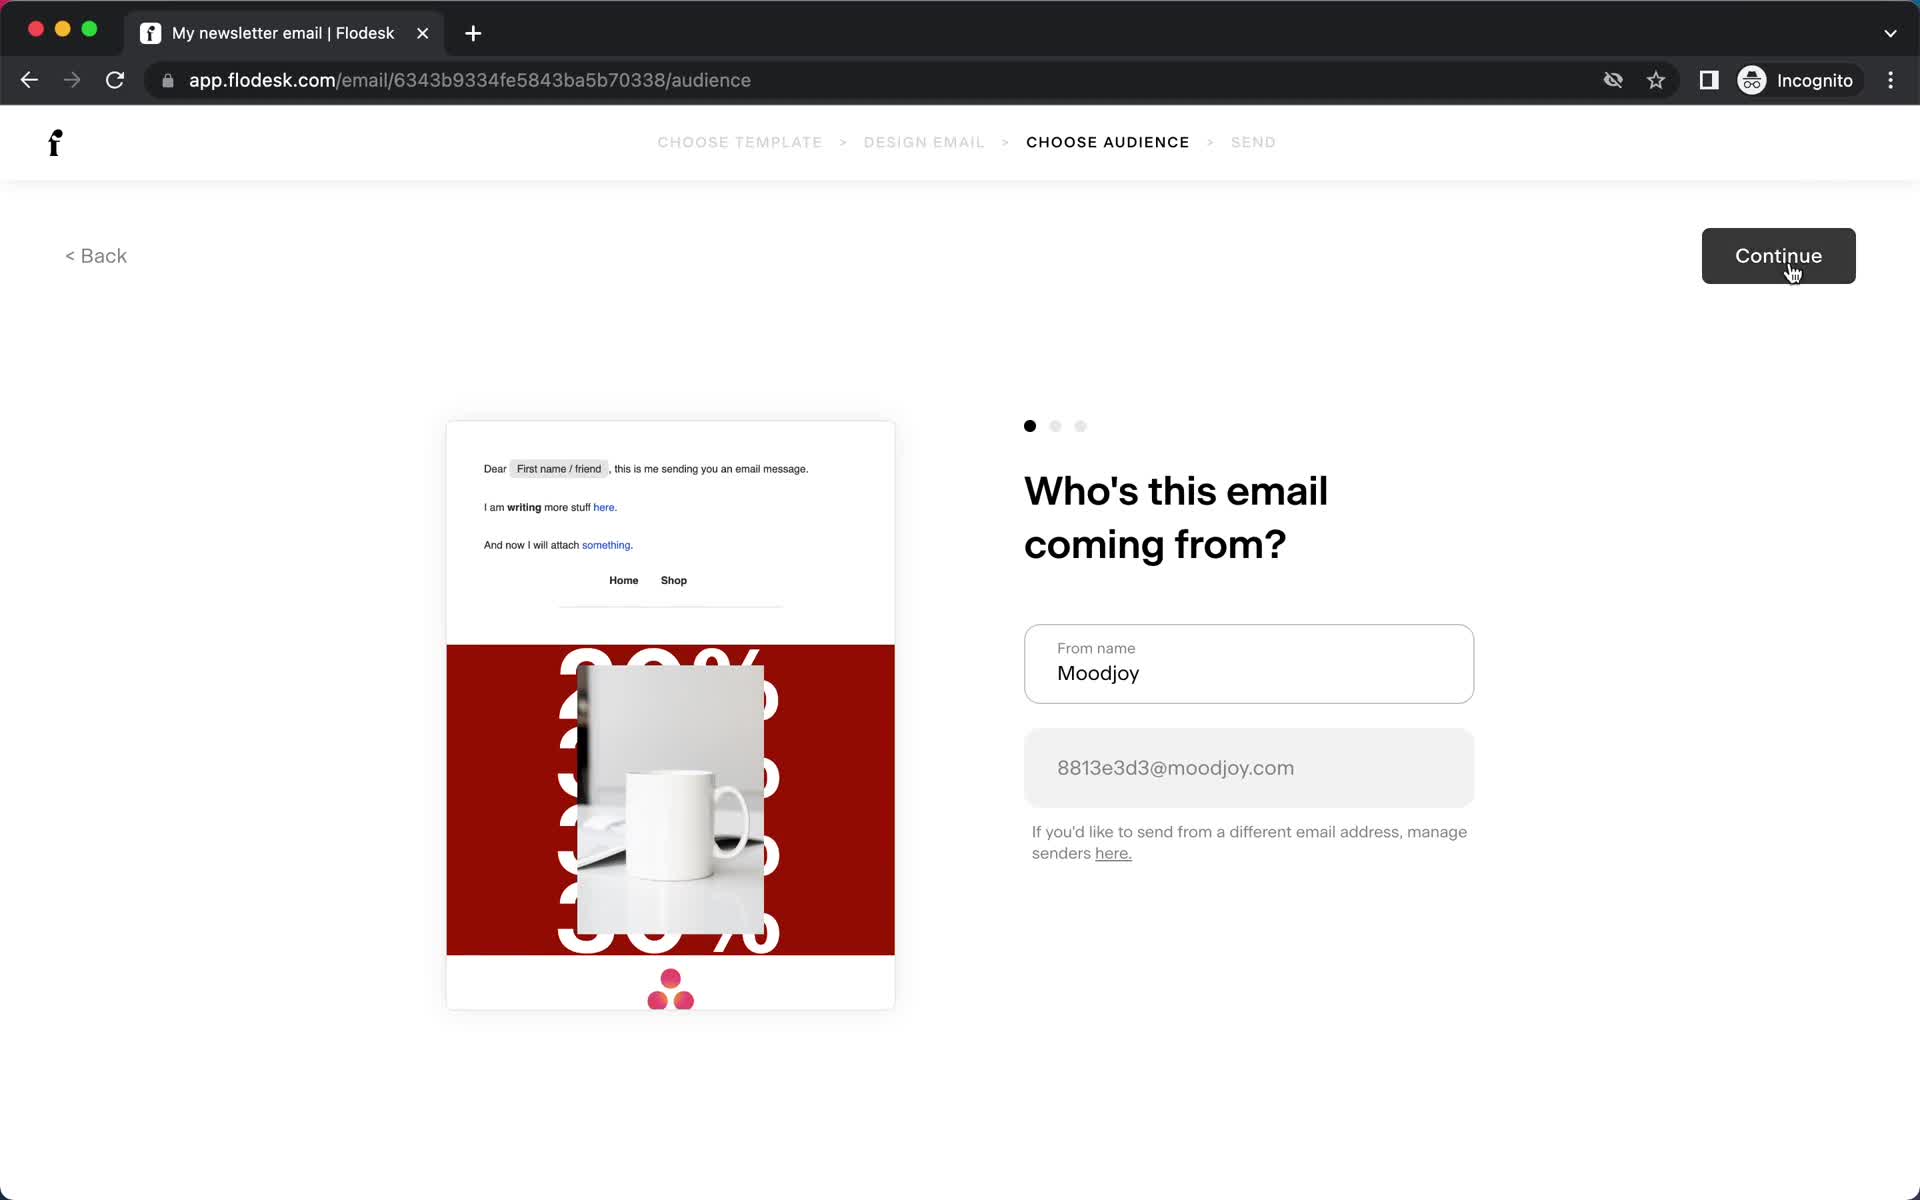
Set from email
this is title
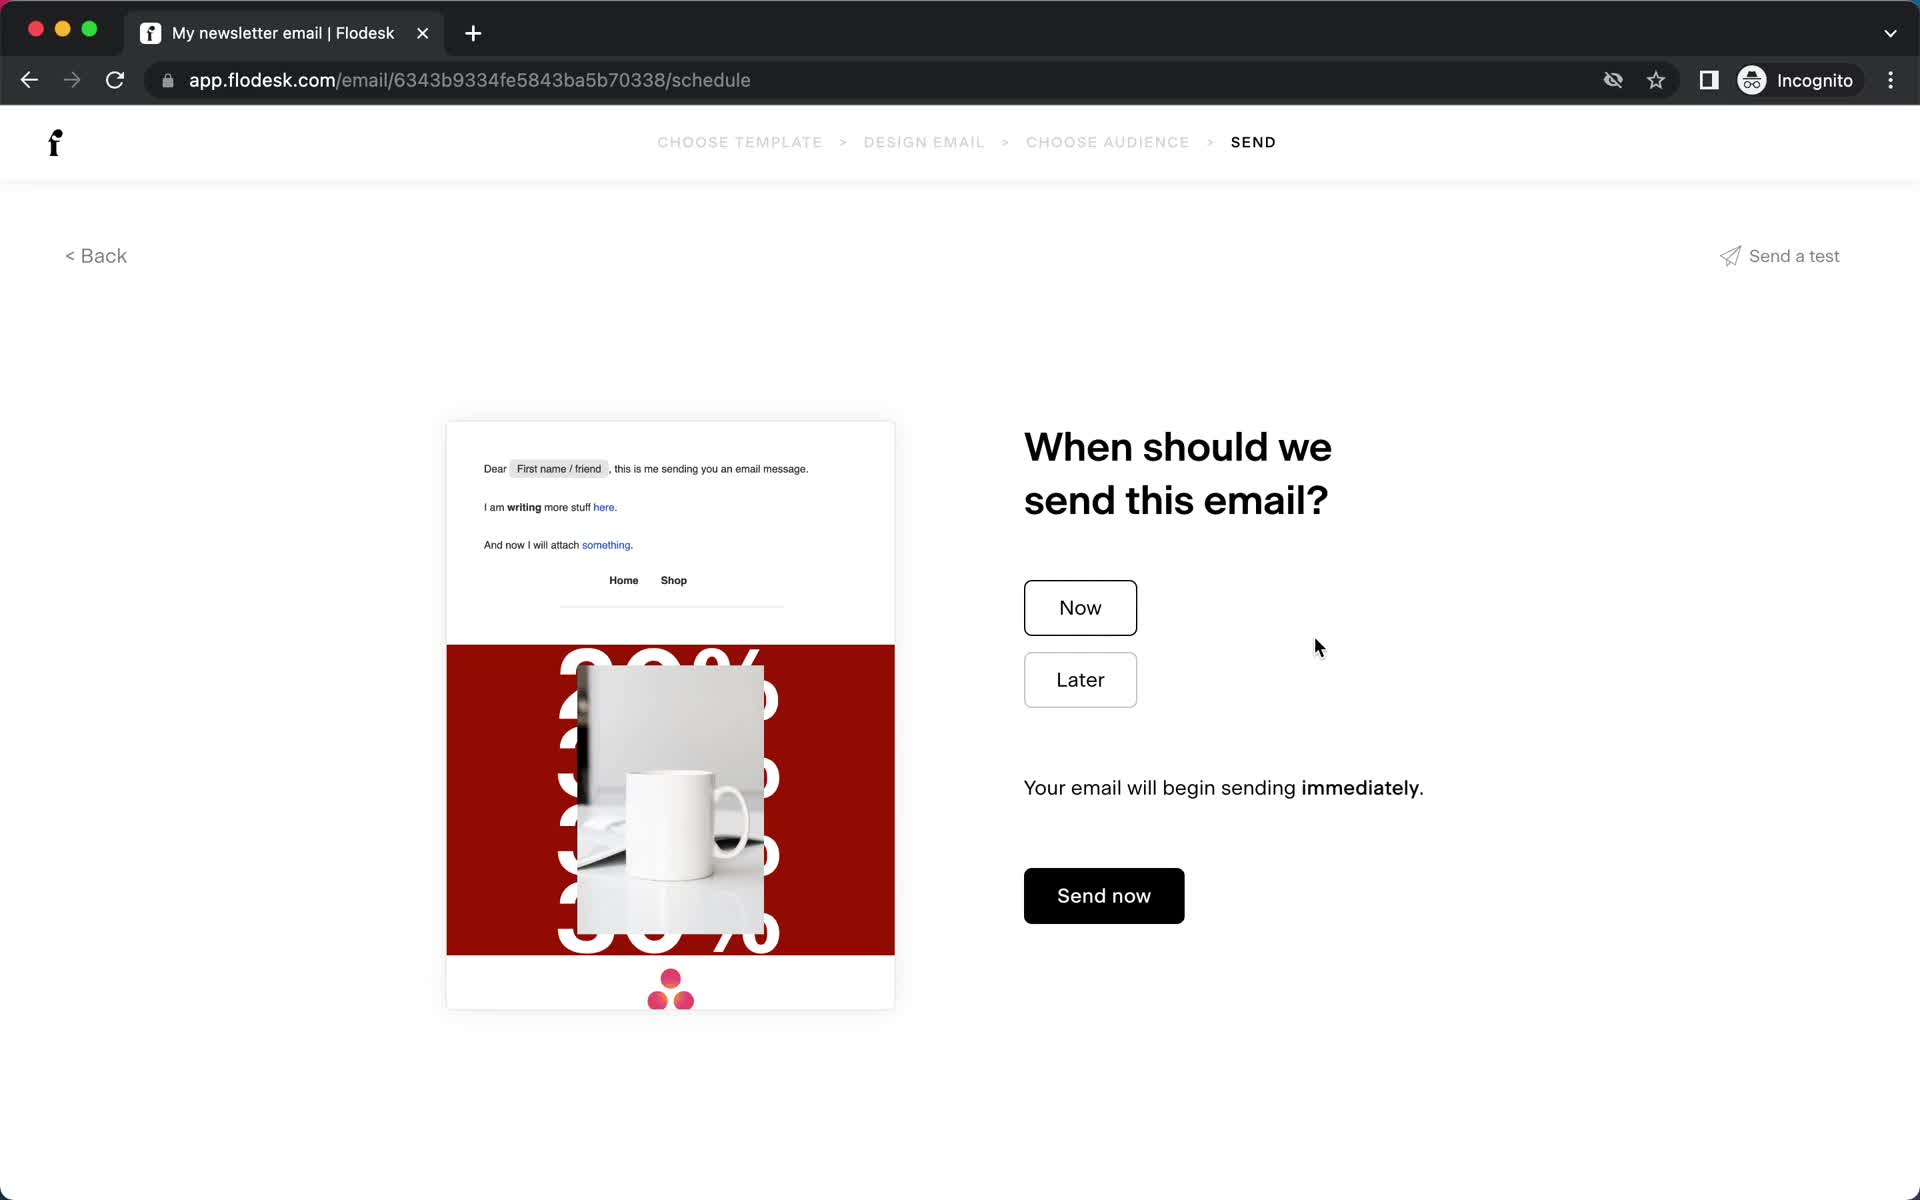
Send email
this is title
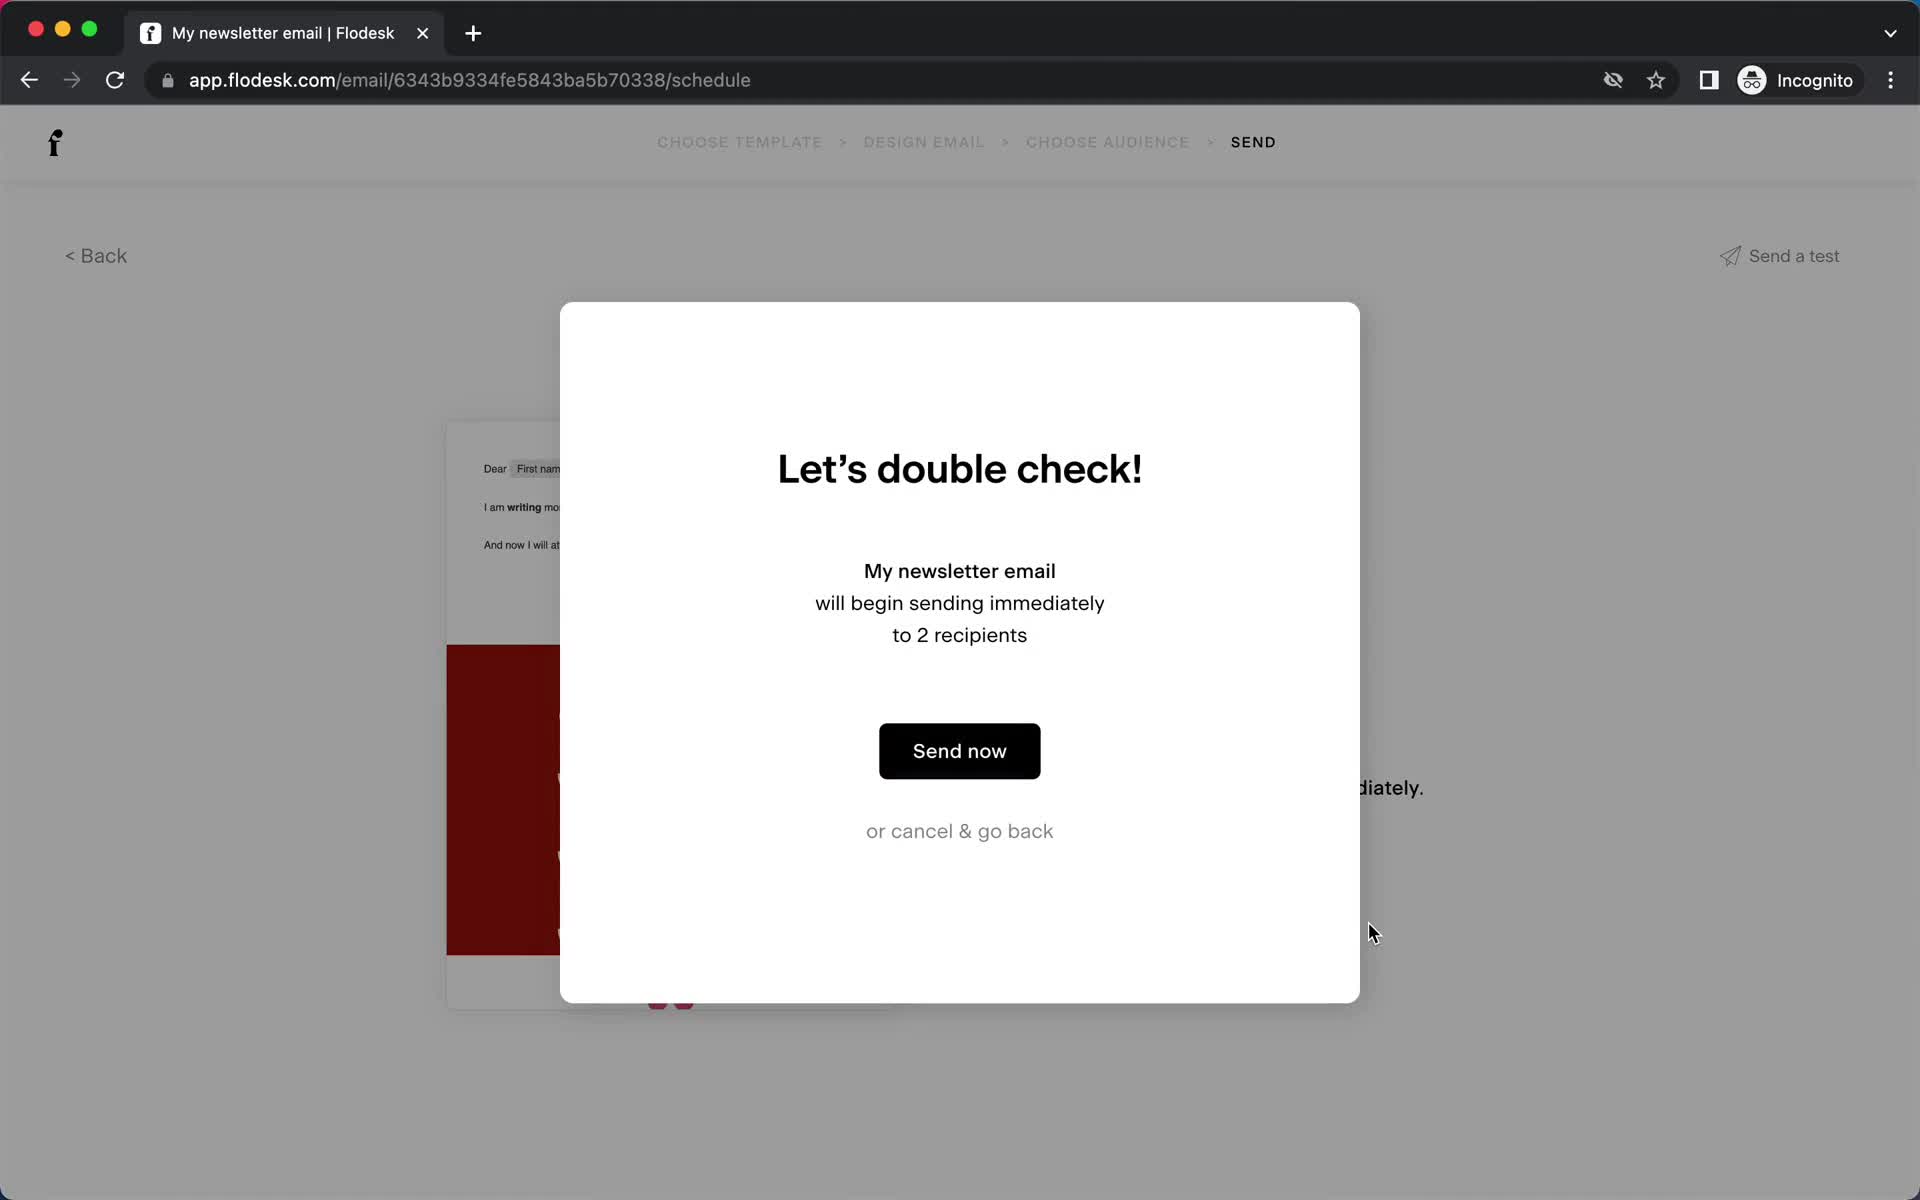
Confirm send
this is title
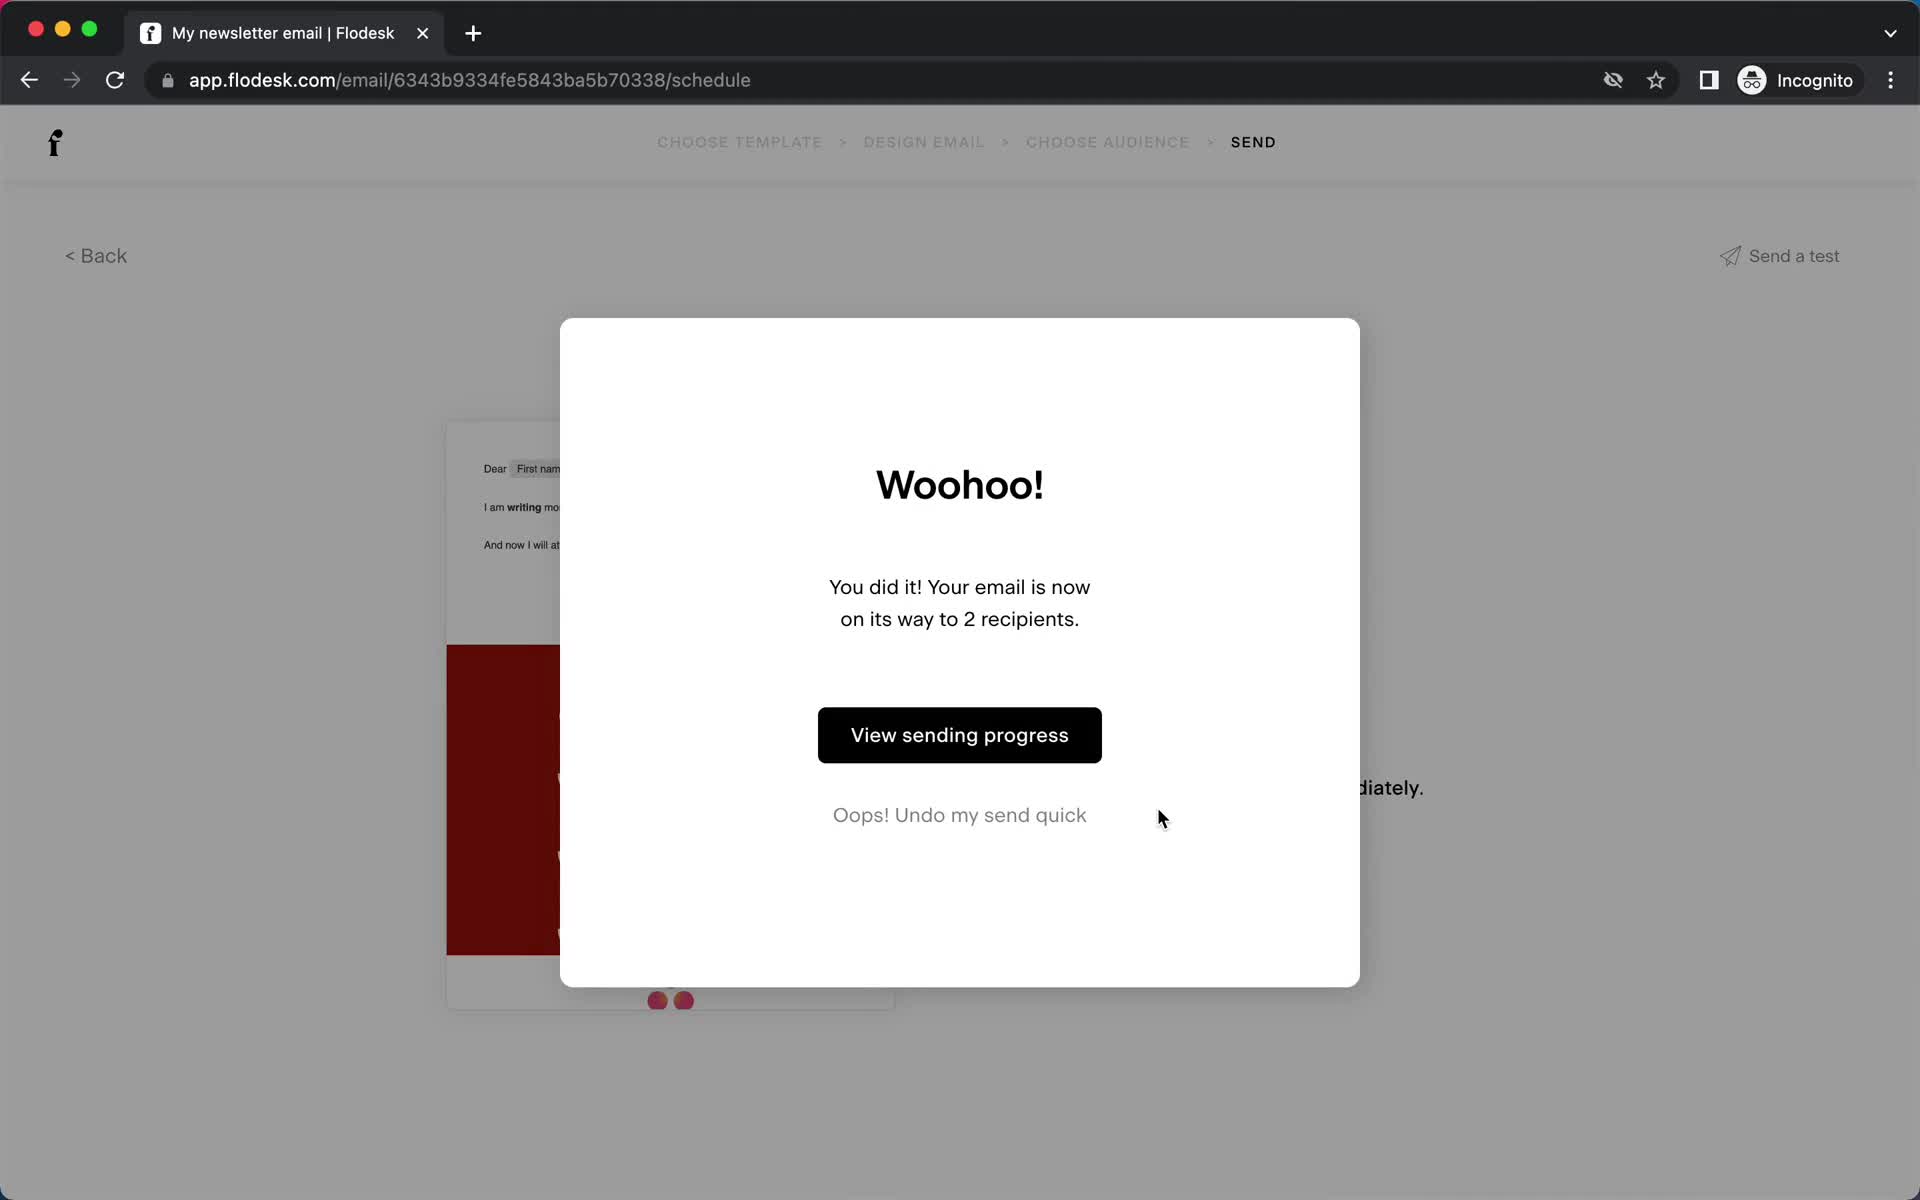
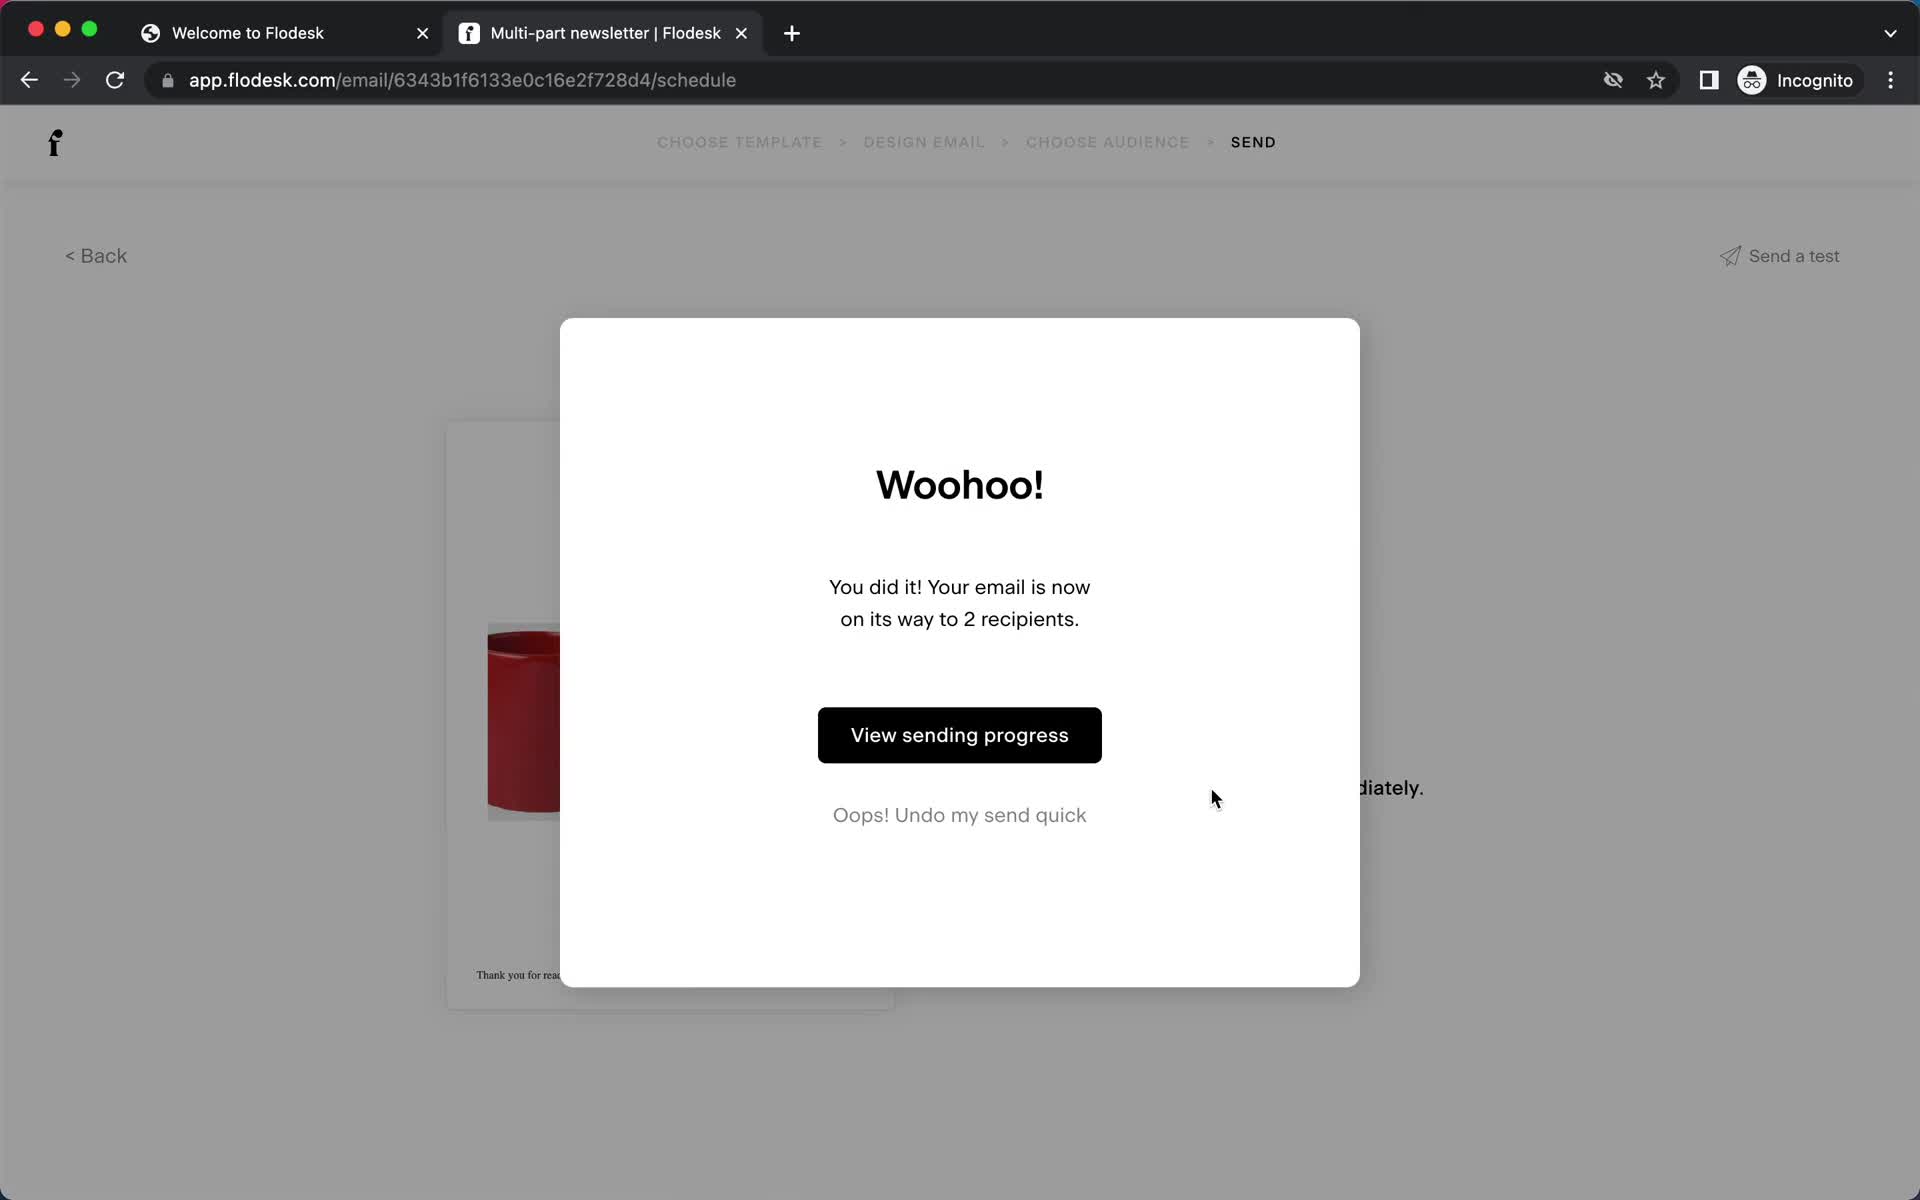
Email sent
this is title
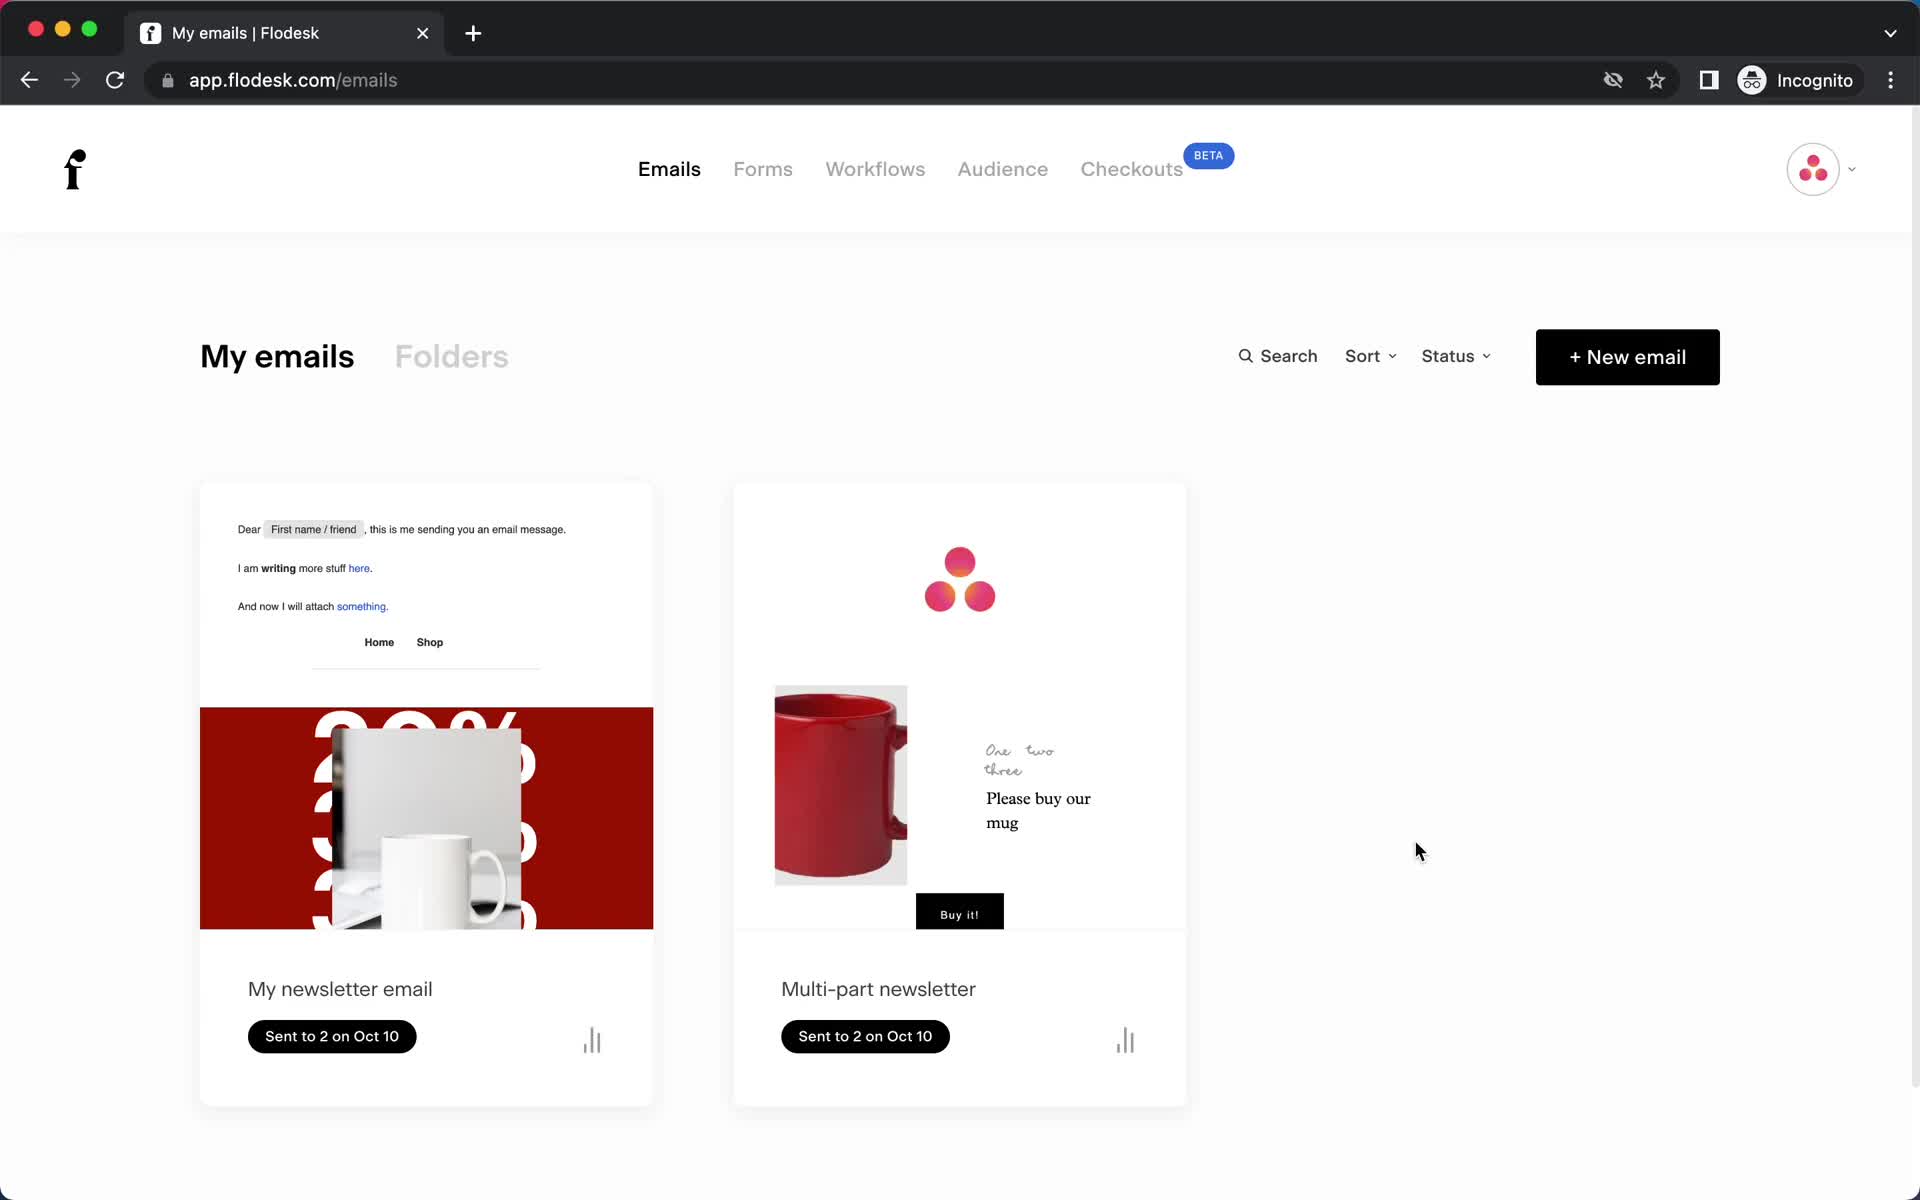
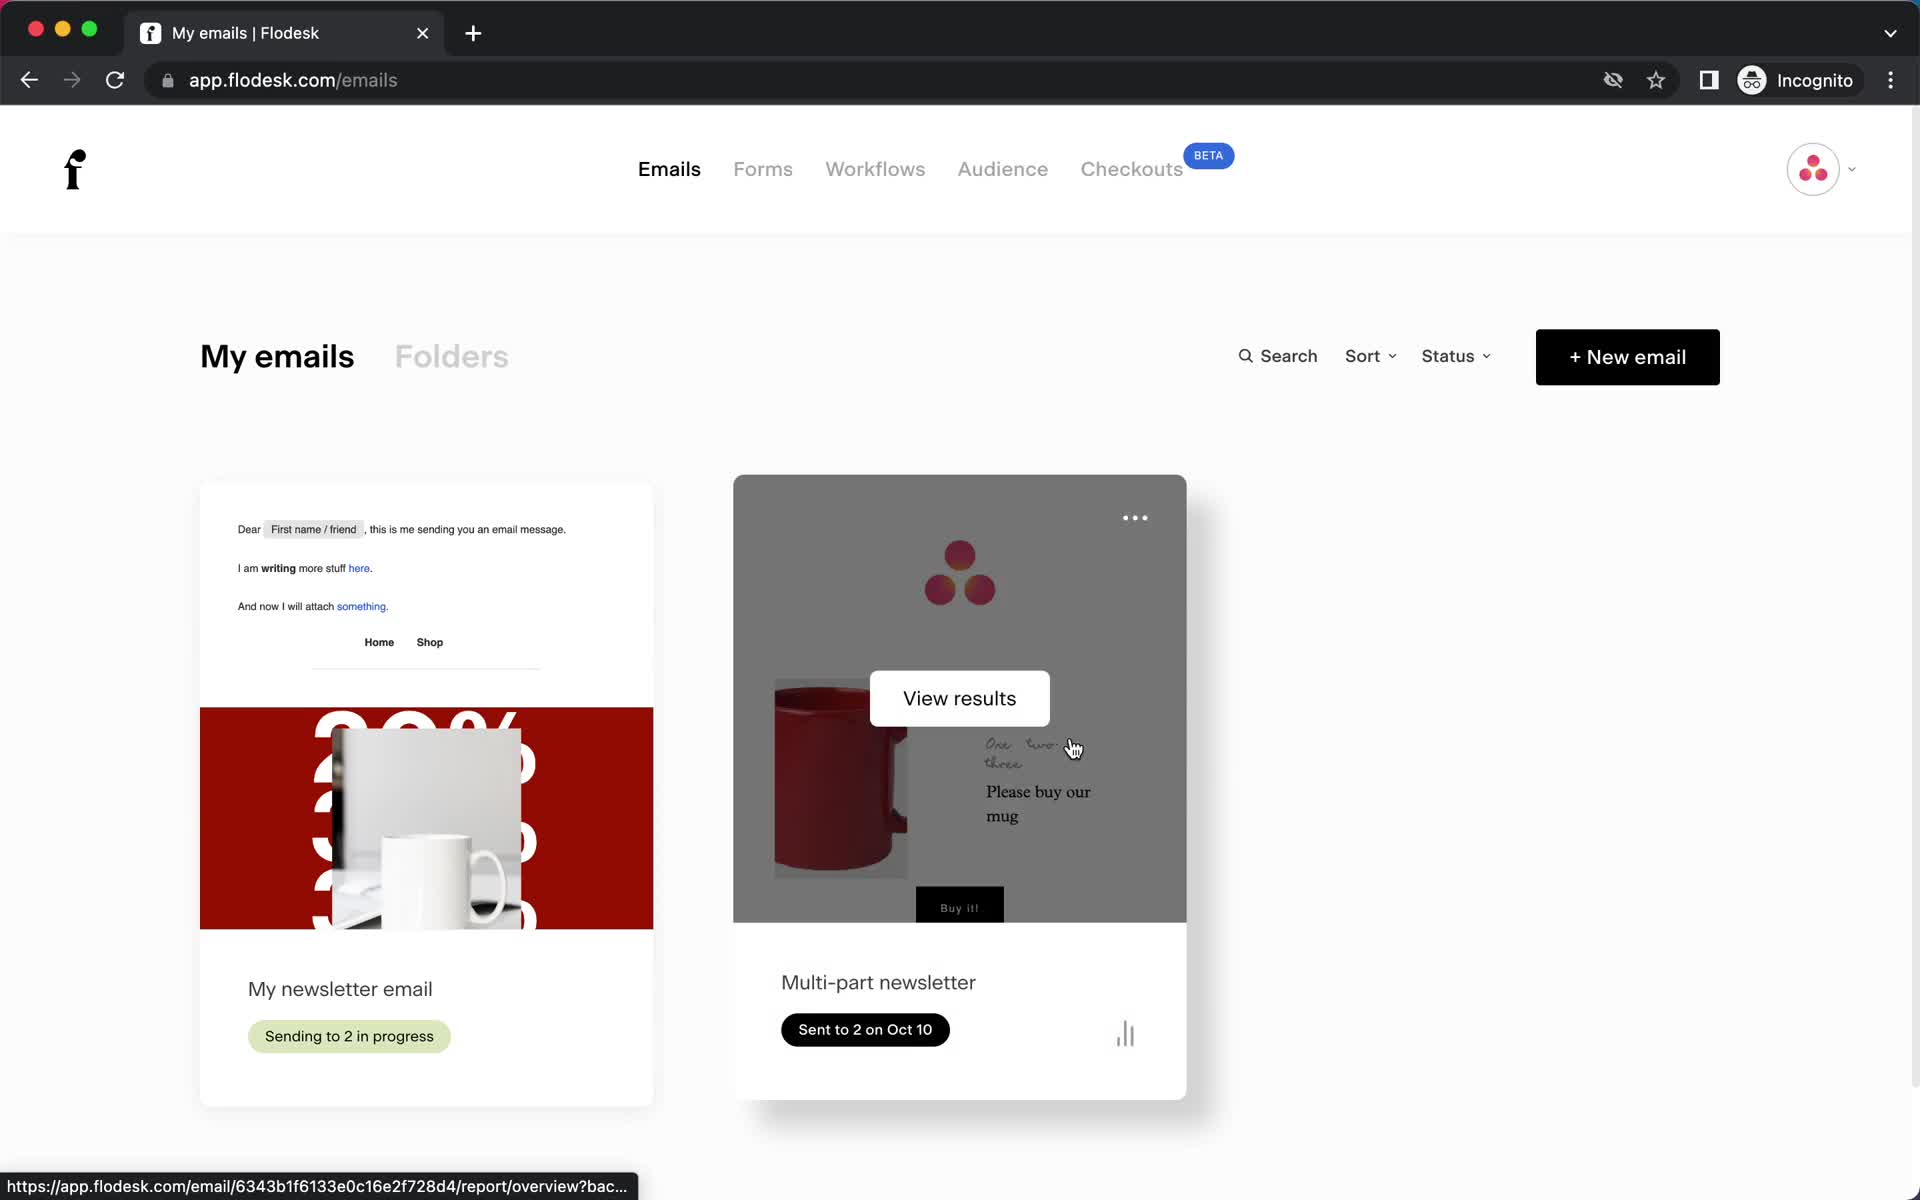
Email campaigns
this is title
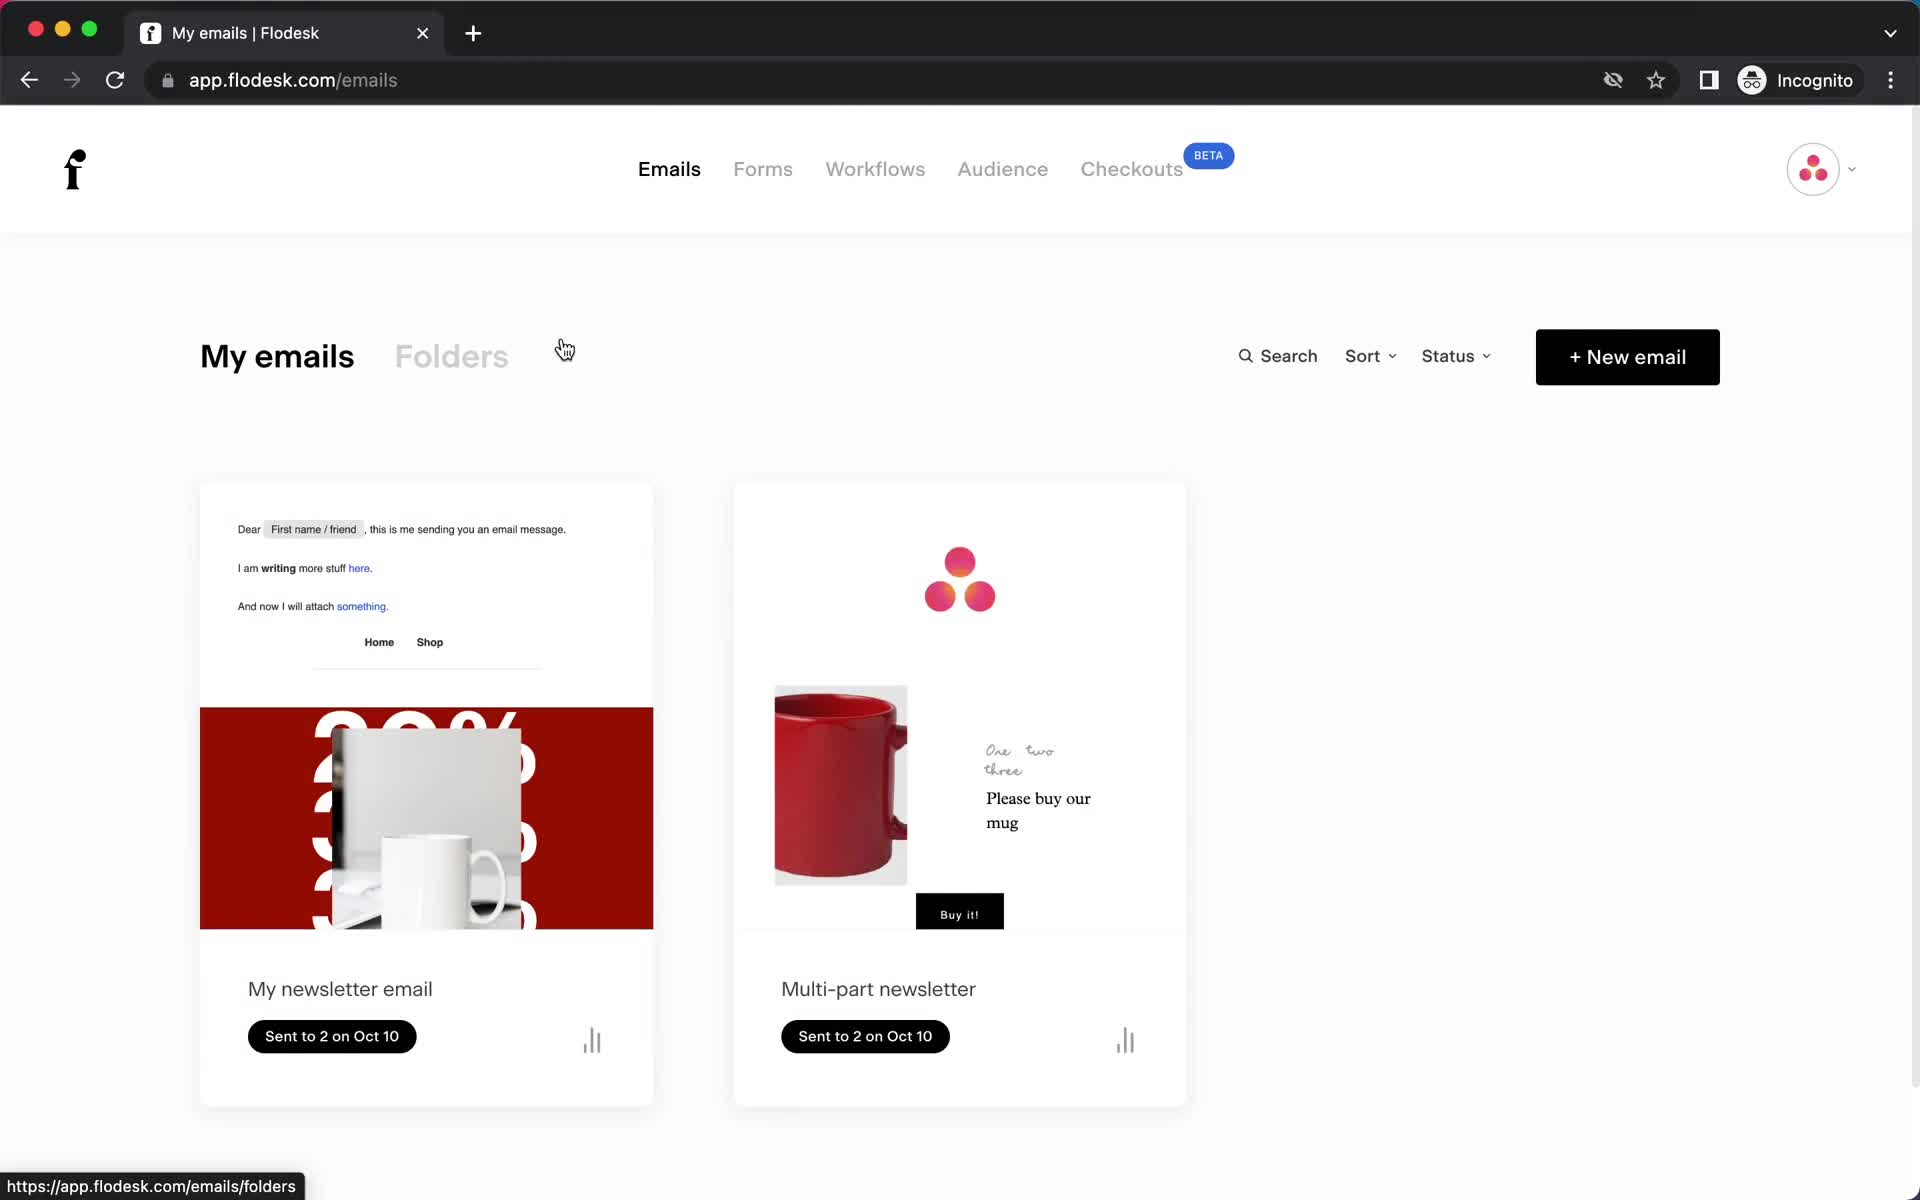
Email campaigns
this is title
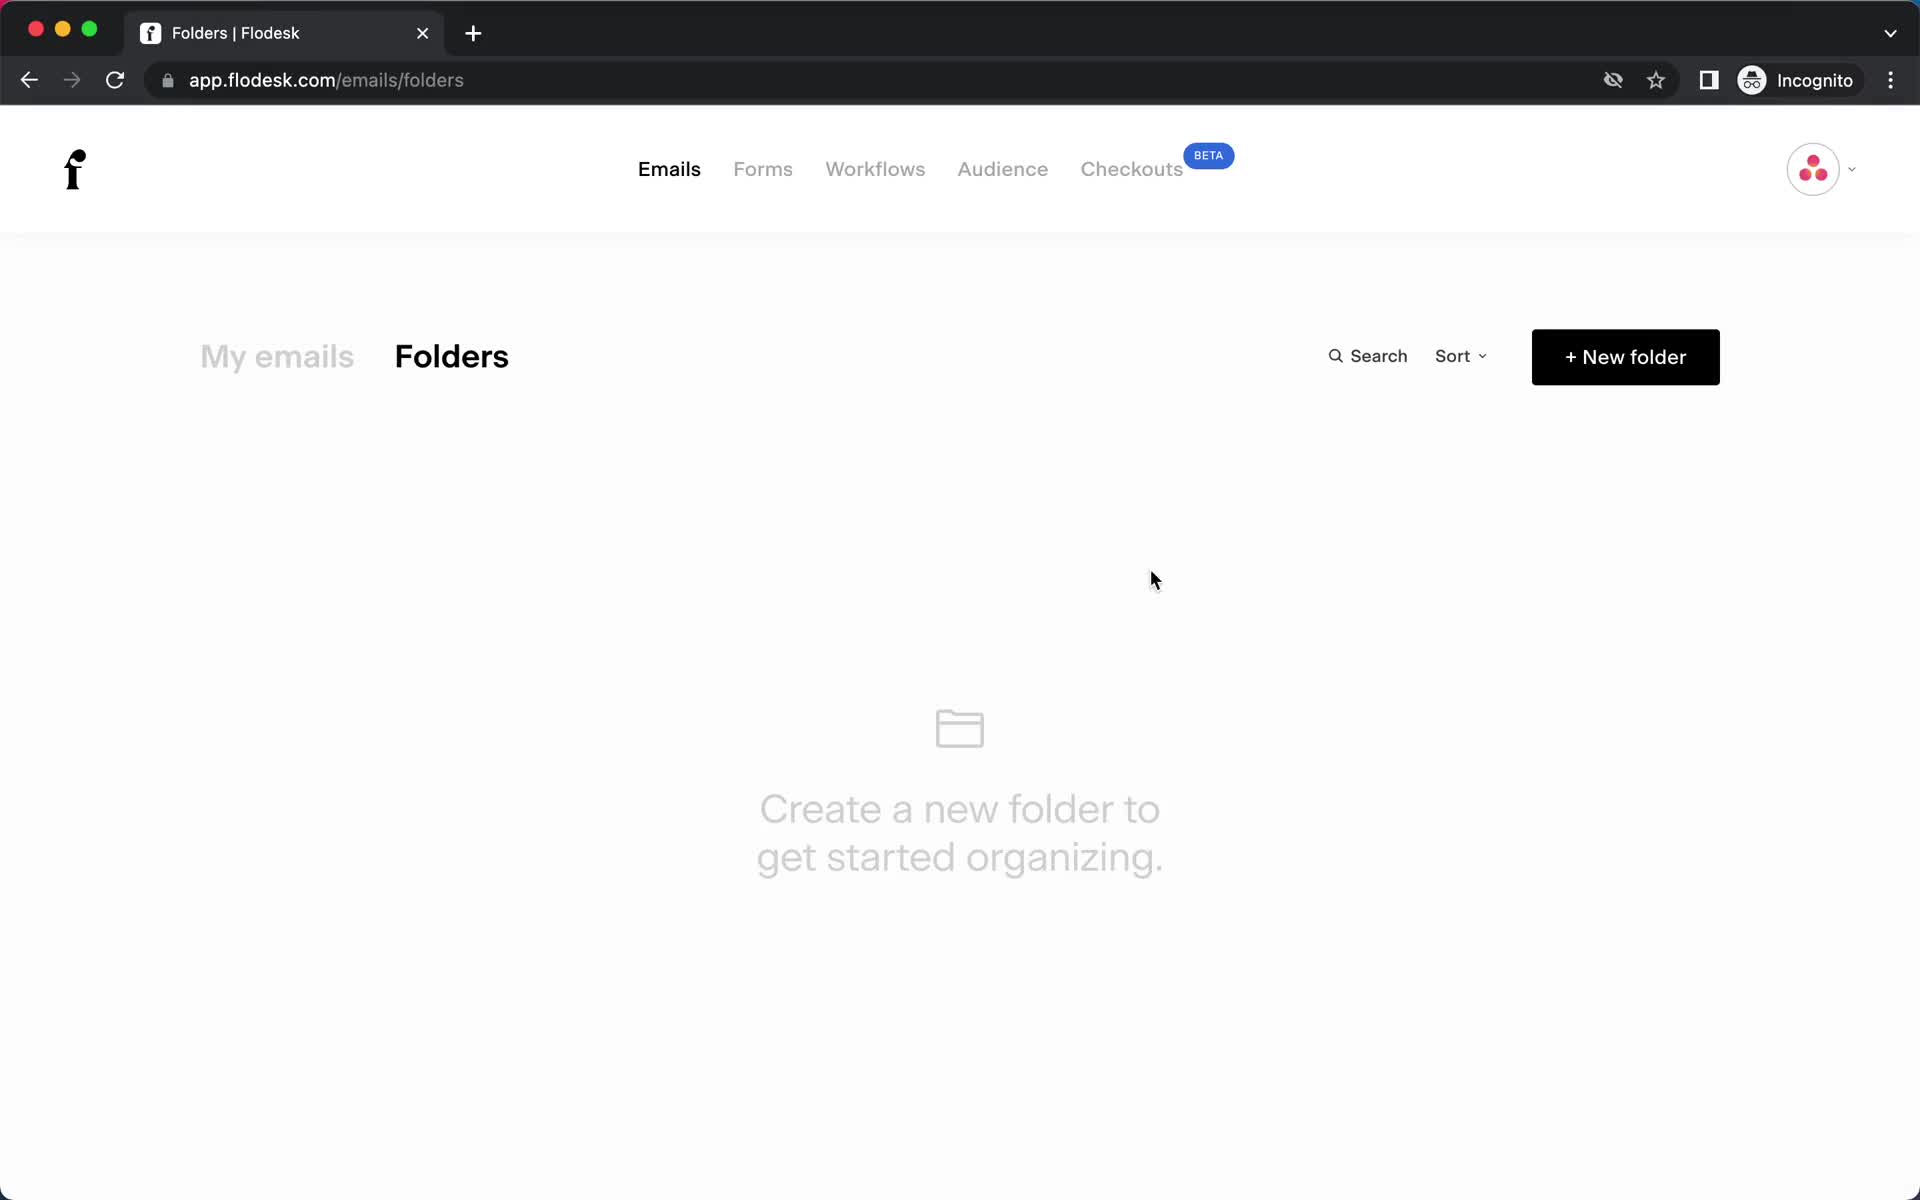
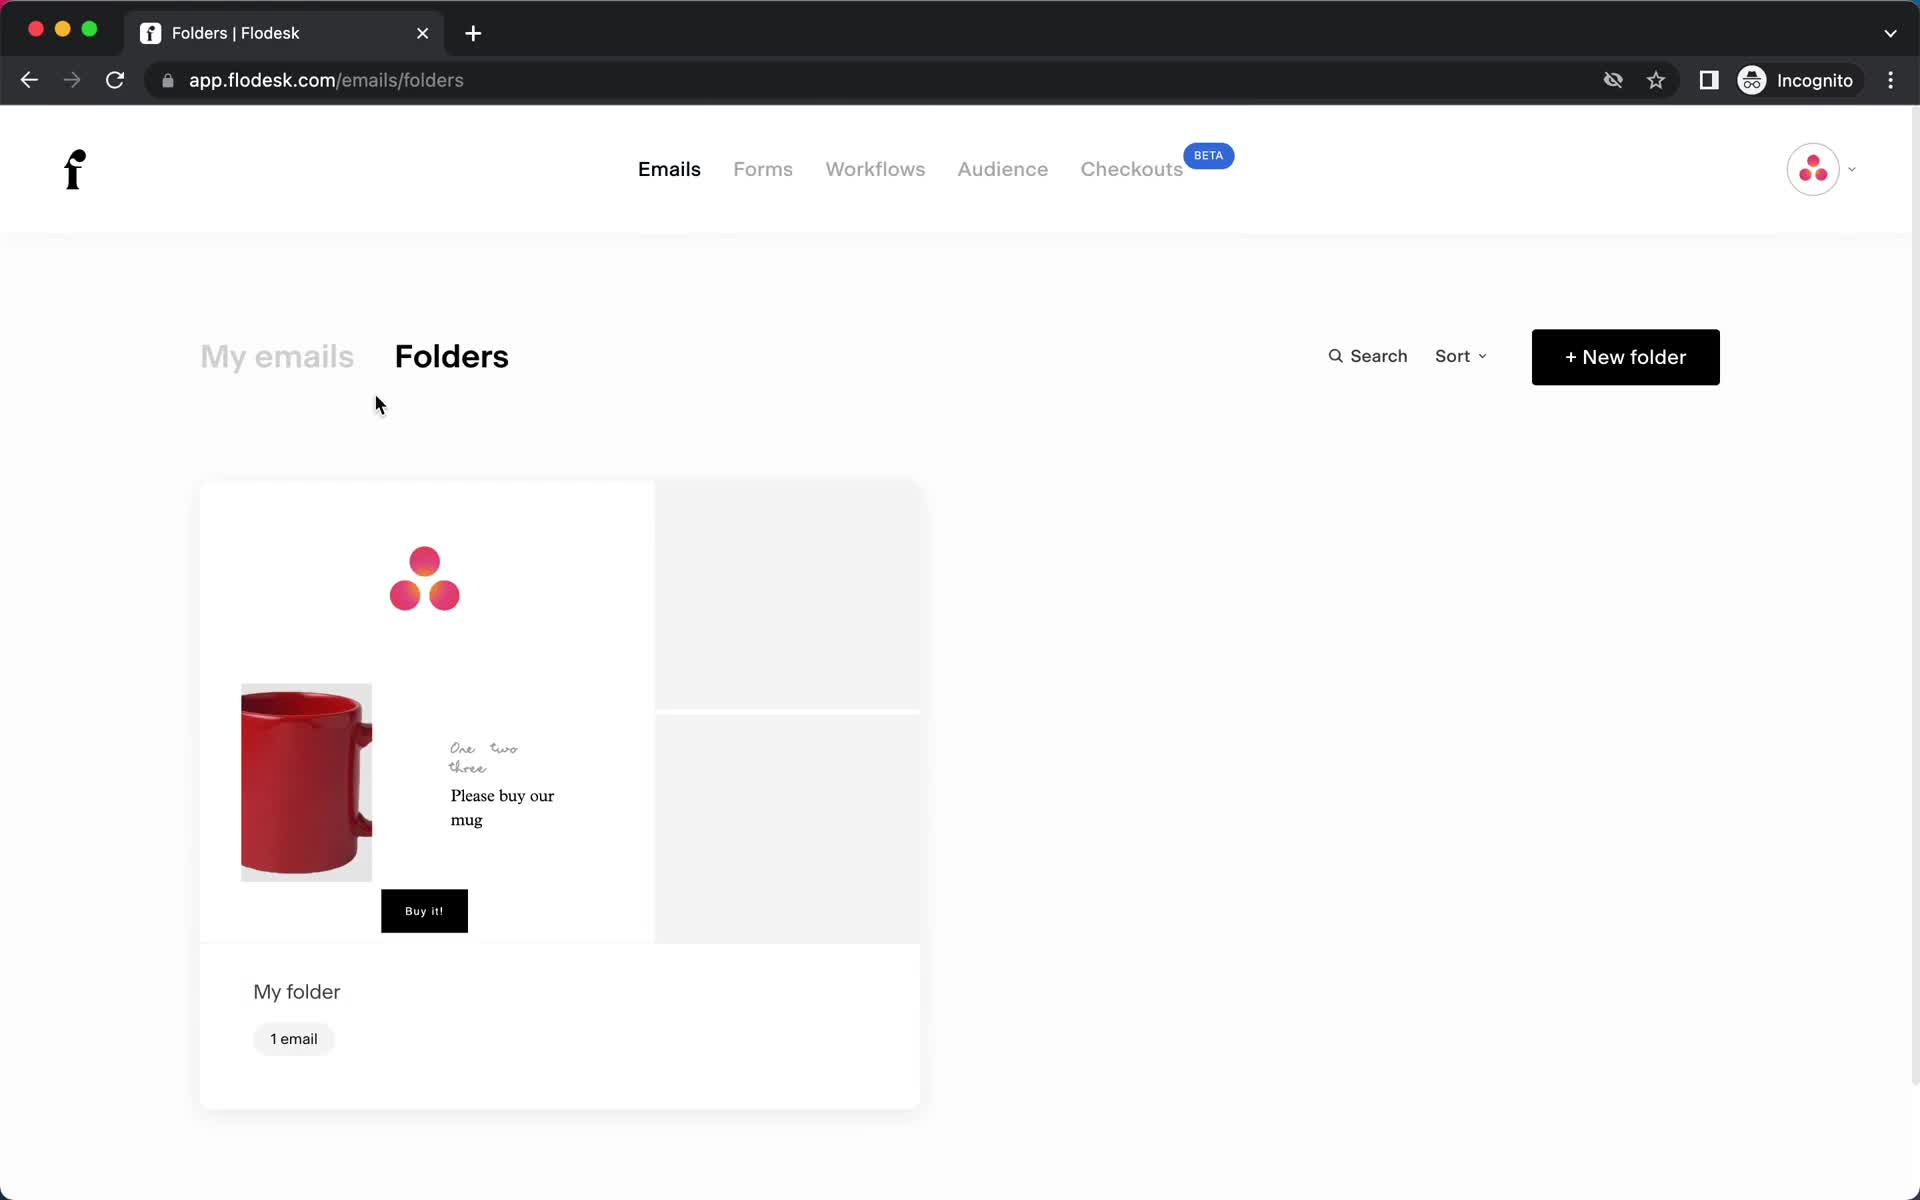
Folders
this is title
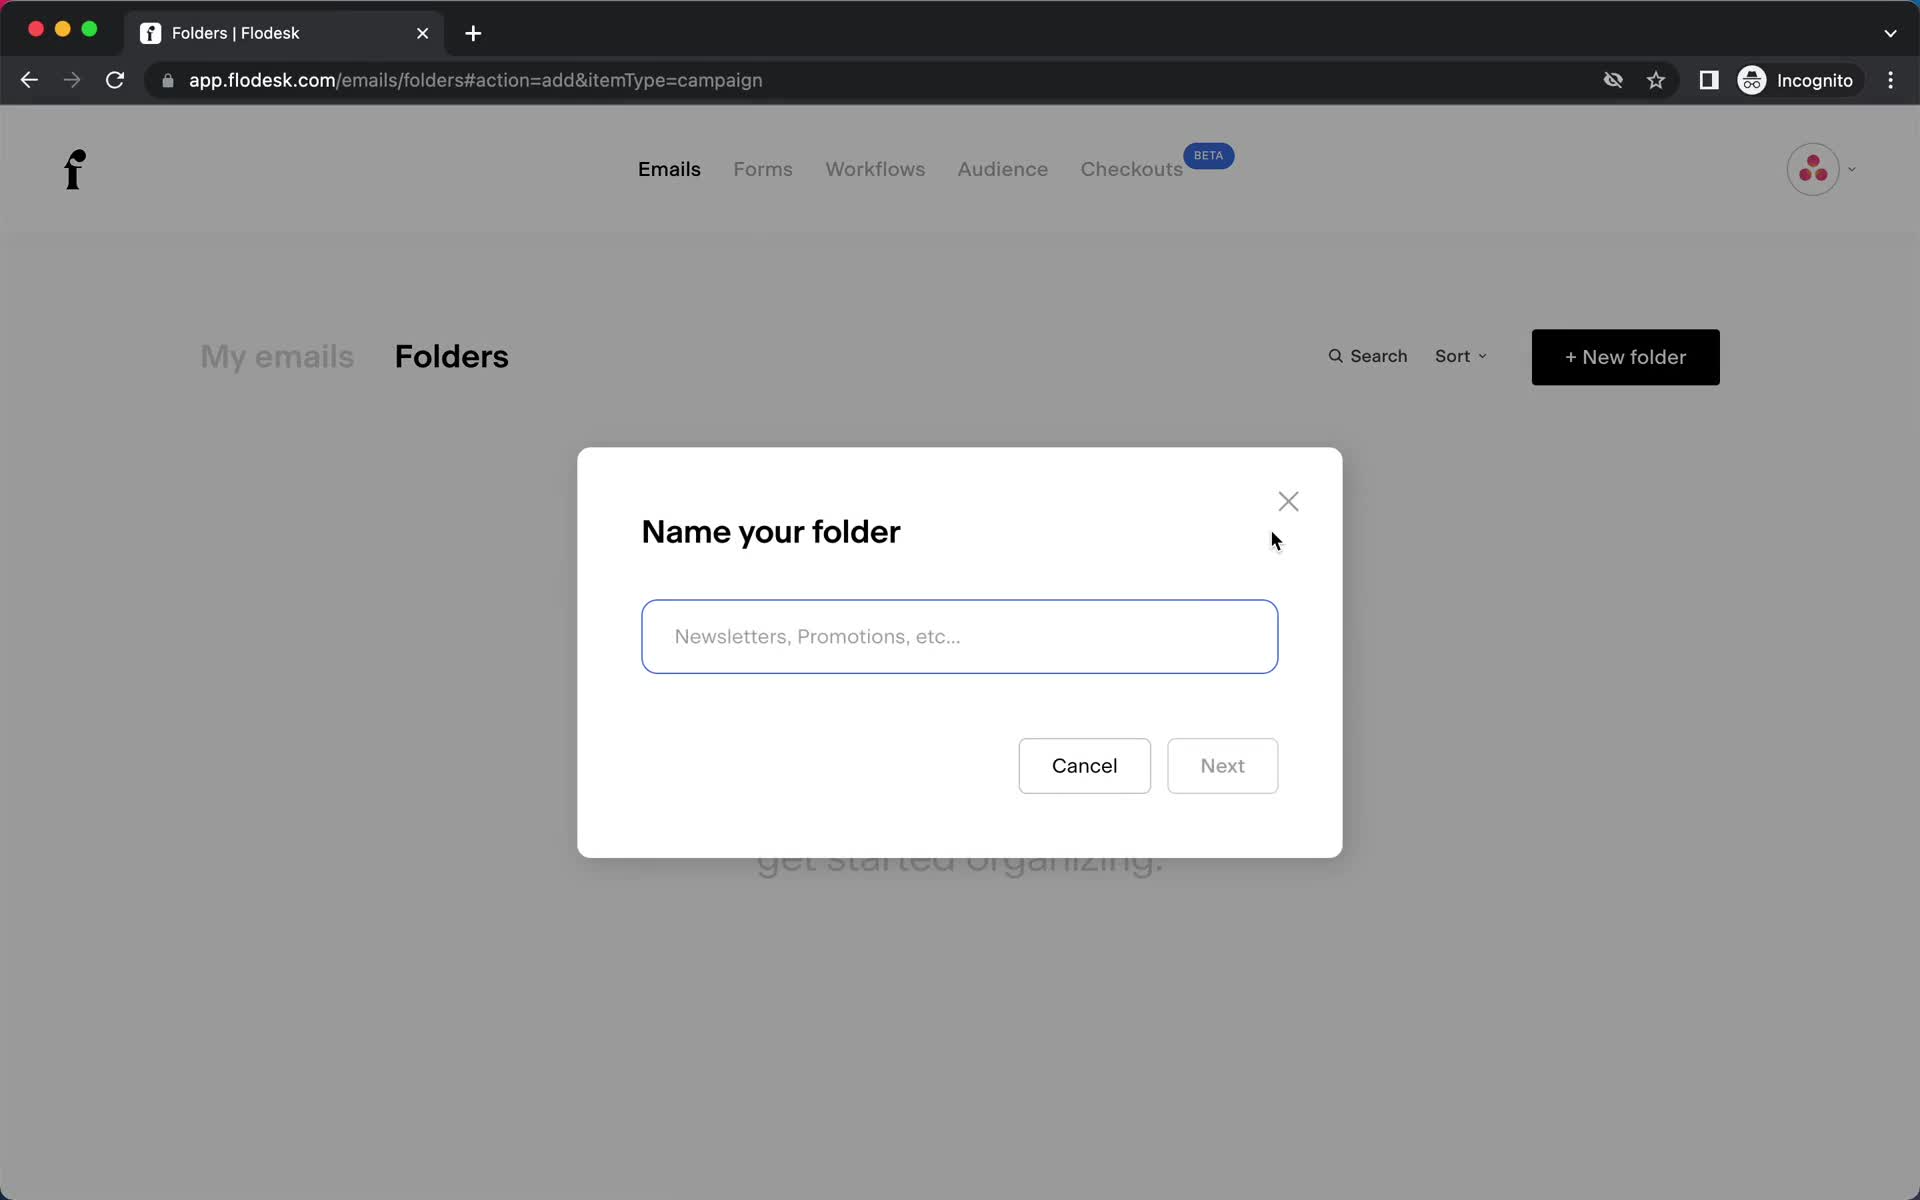
Create folder
this is title
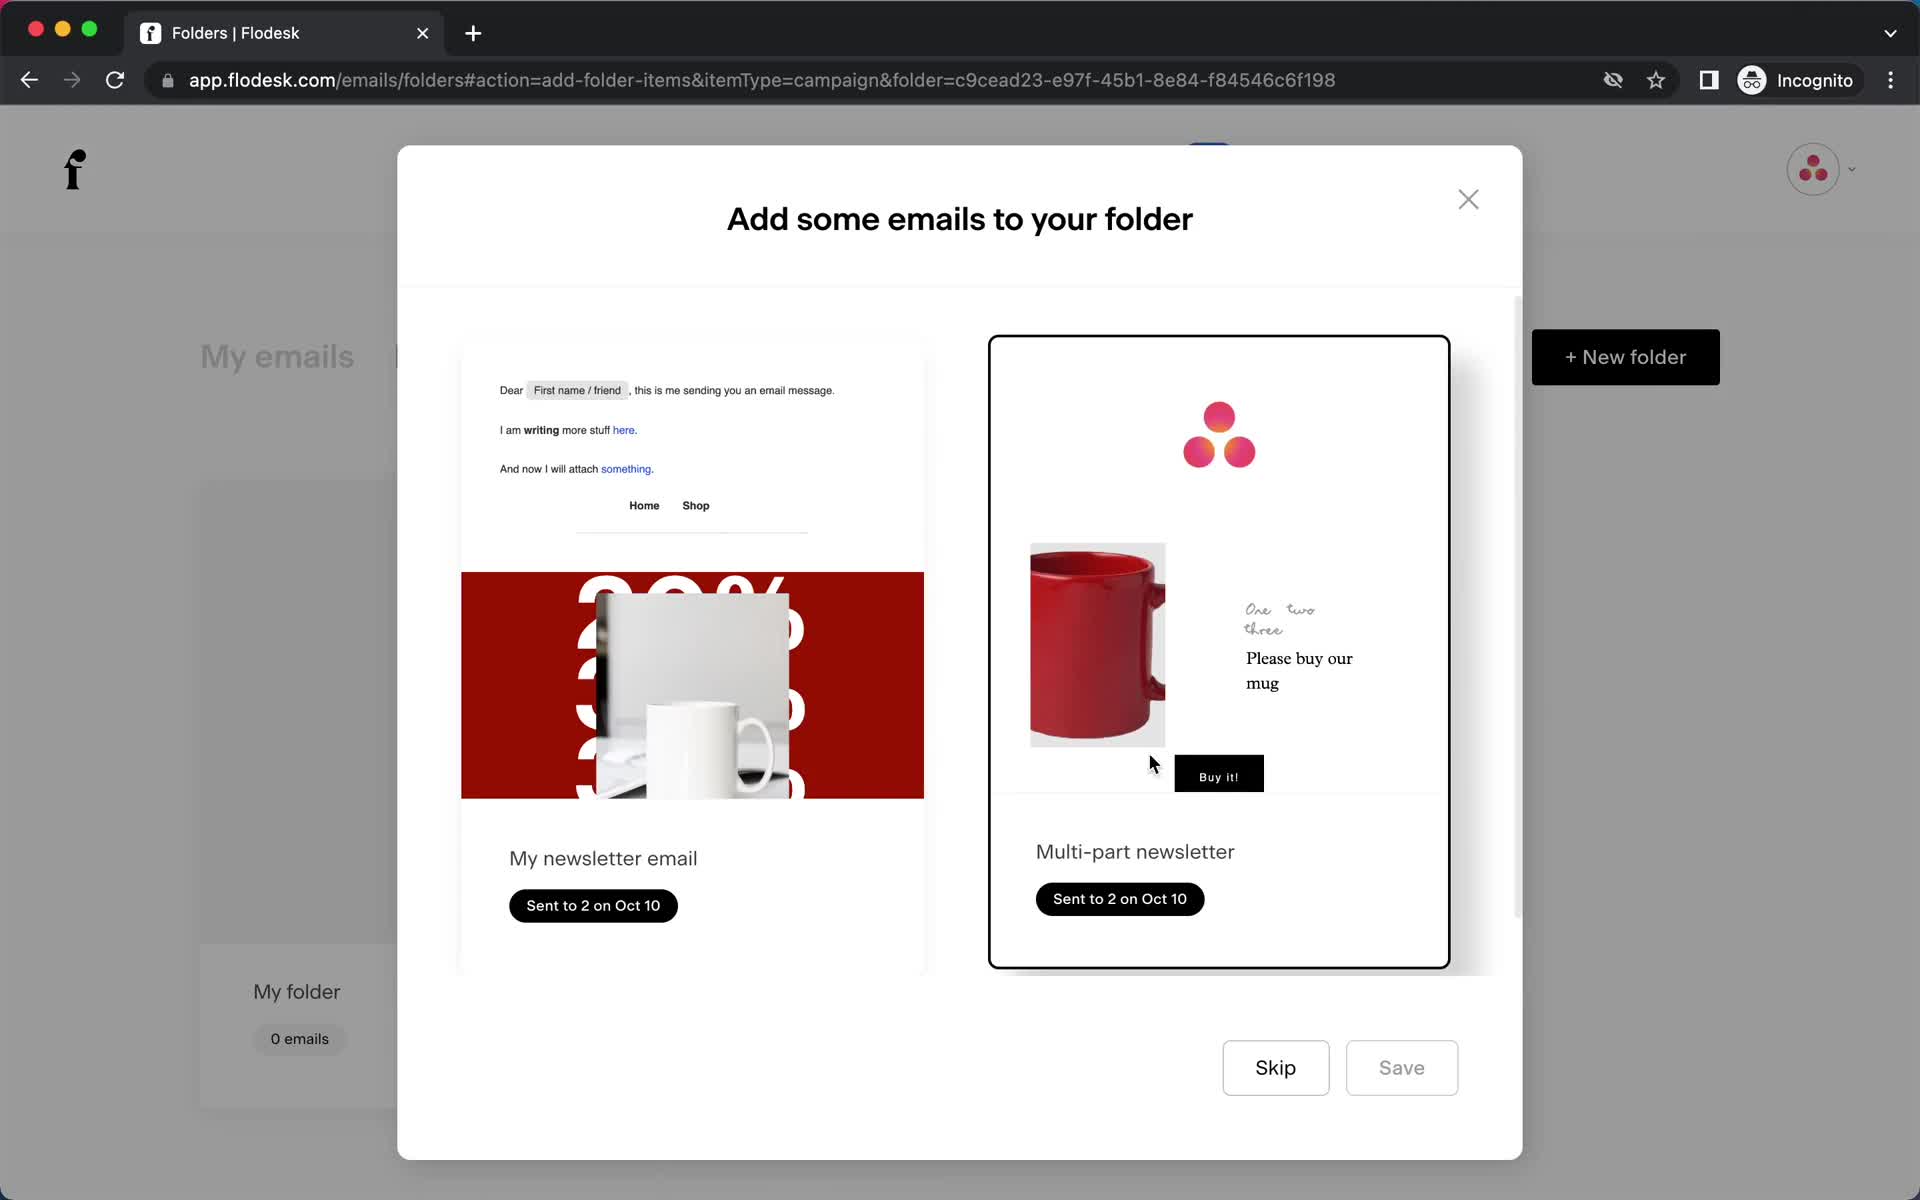
Add items
this is title
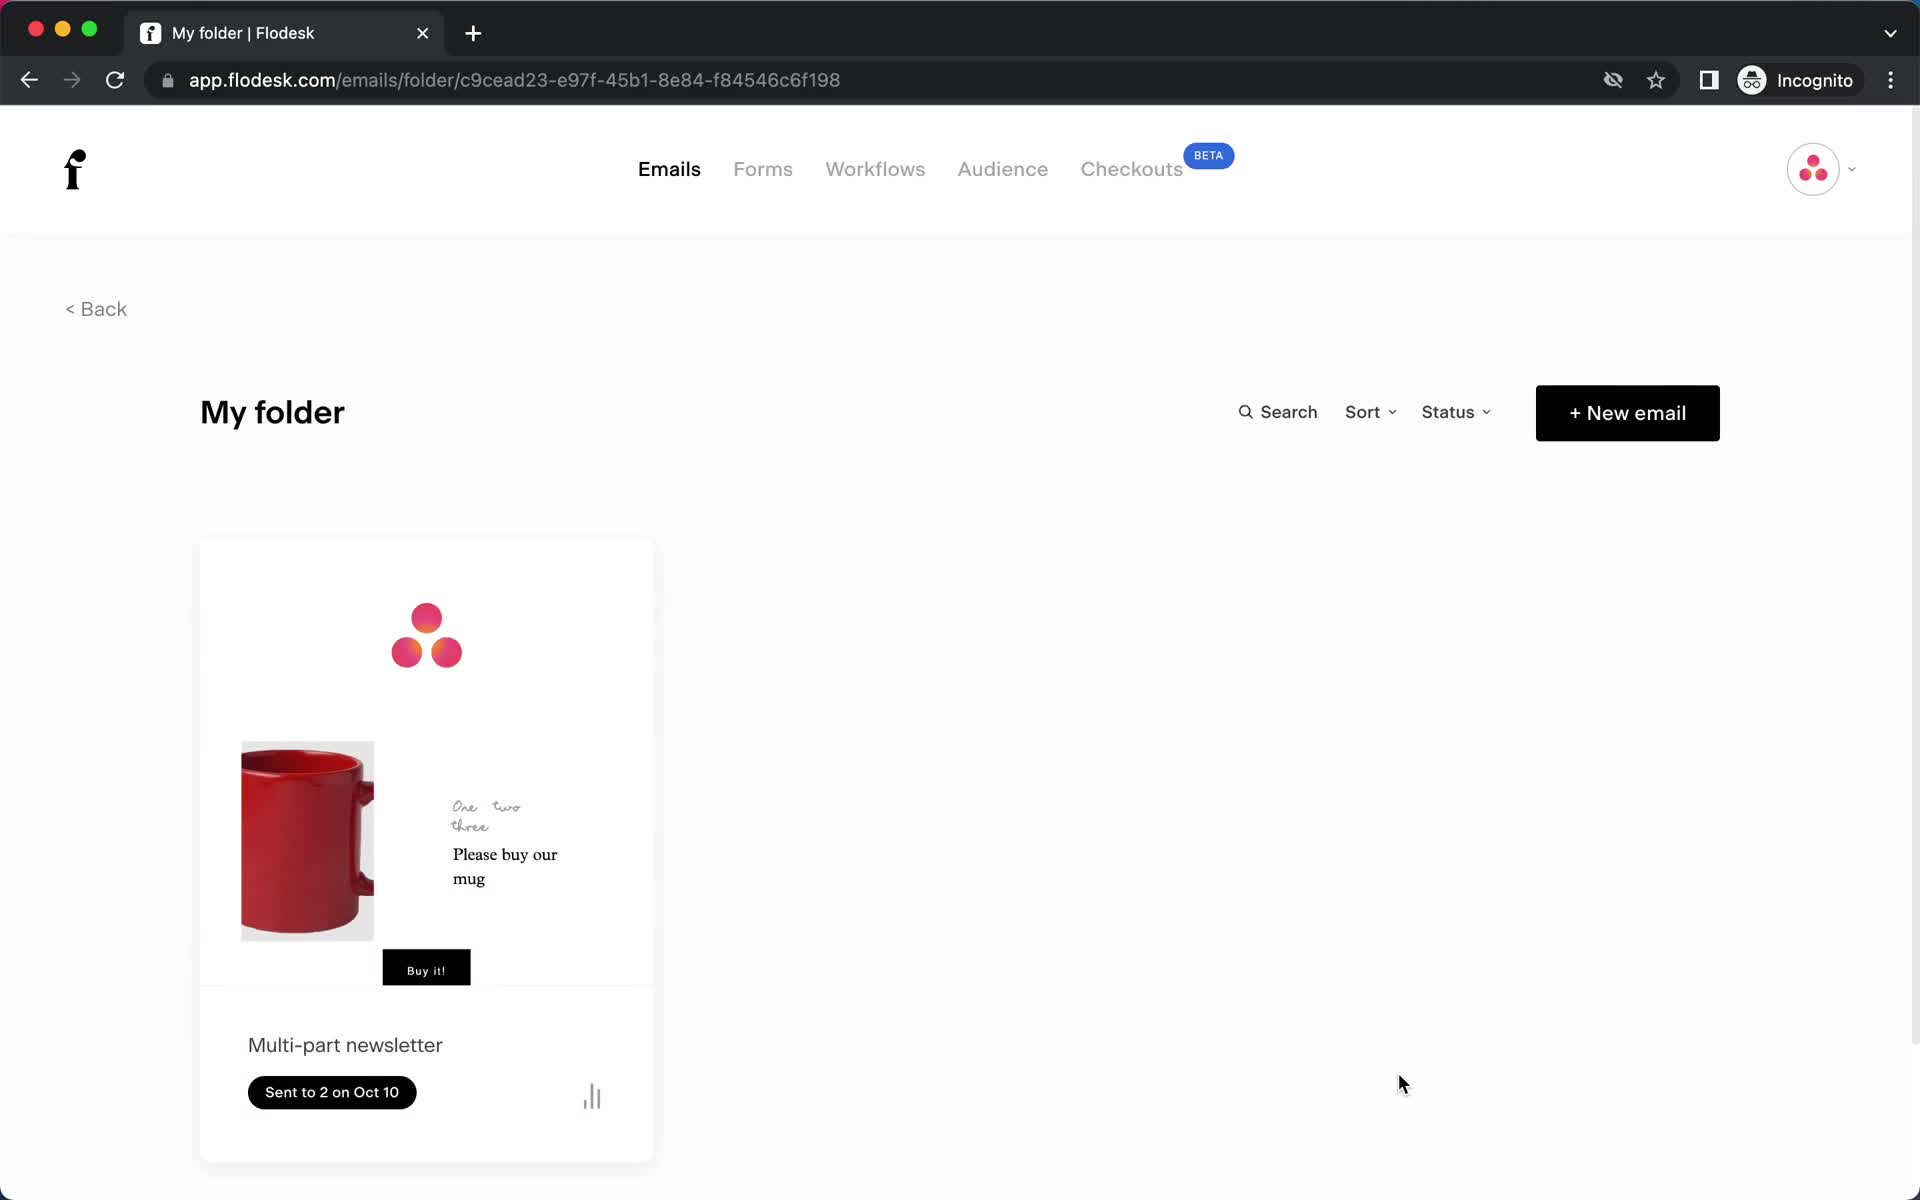
Folder
this is title
Folders
this is title
Email campaigns
this is title
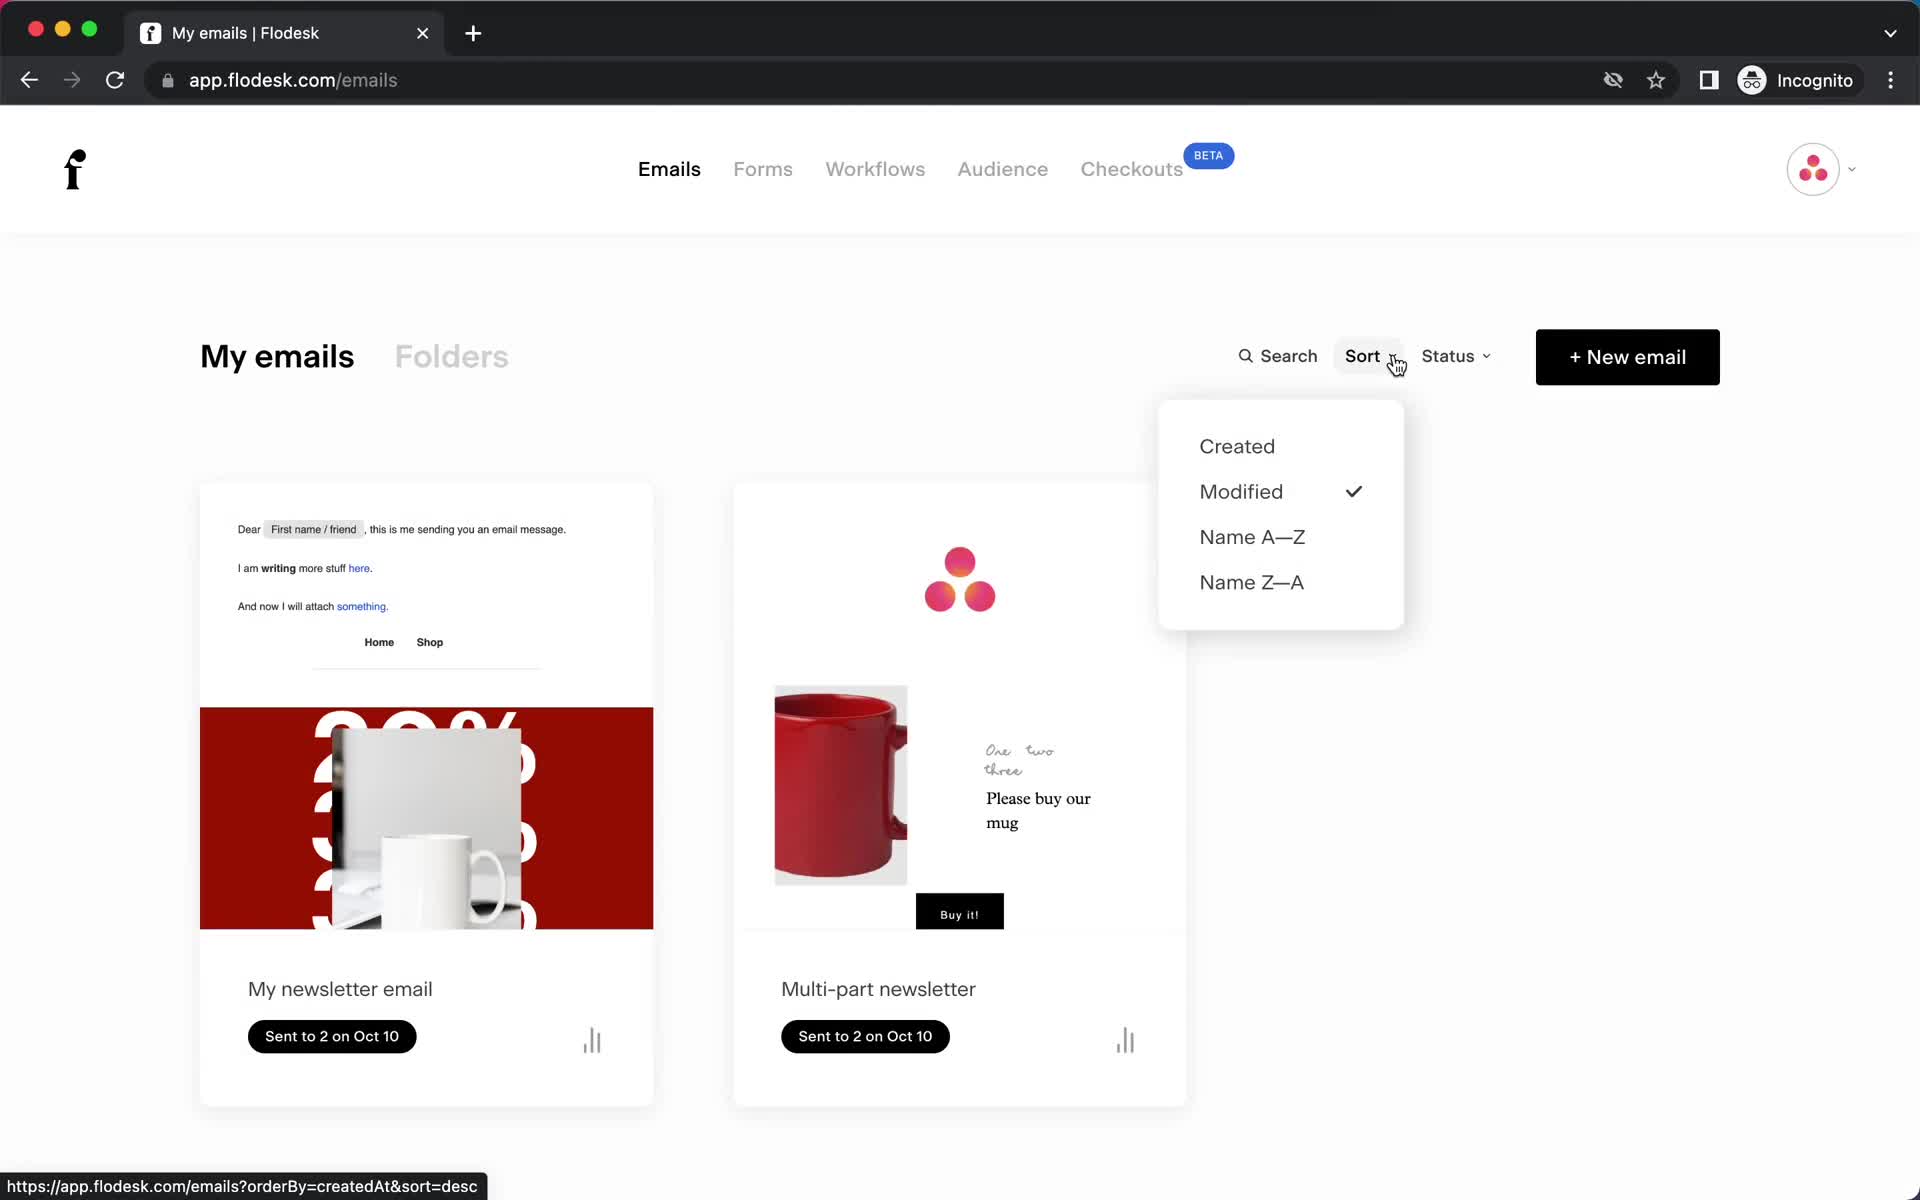
Sort
this is title
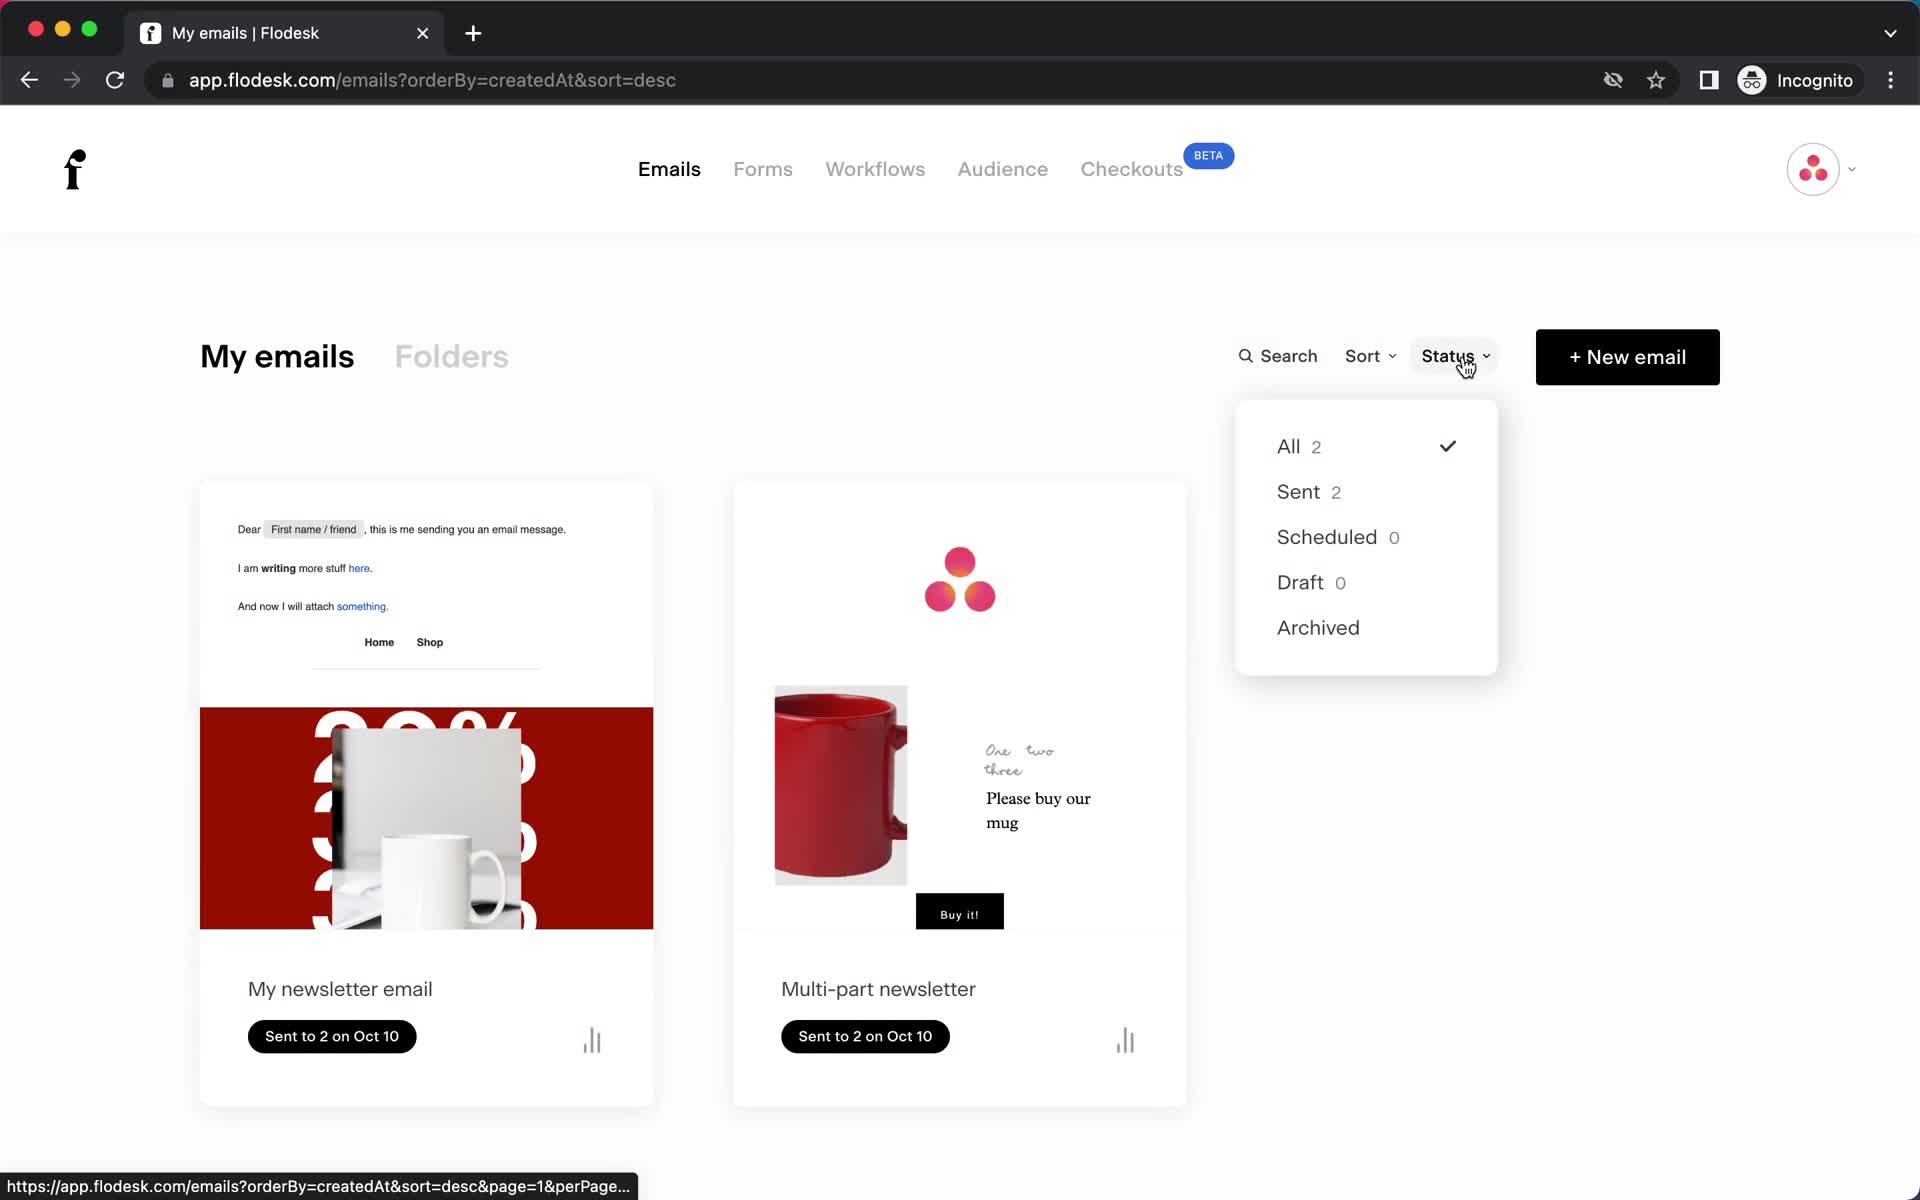
Filter
this is title
Email campaigns
this is title
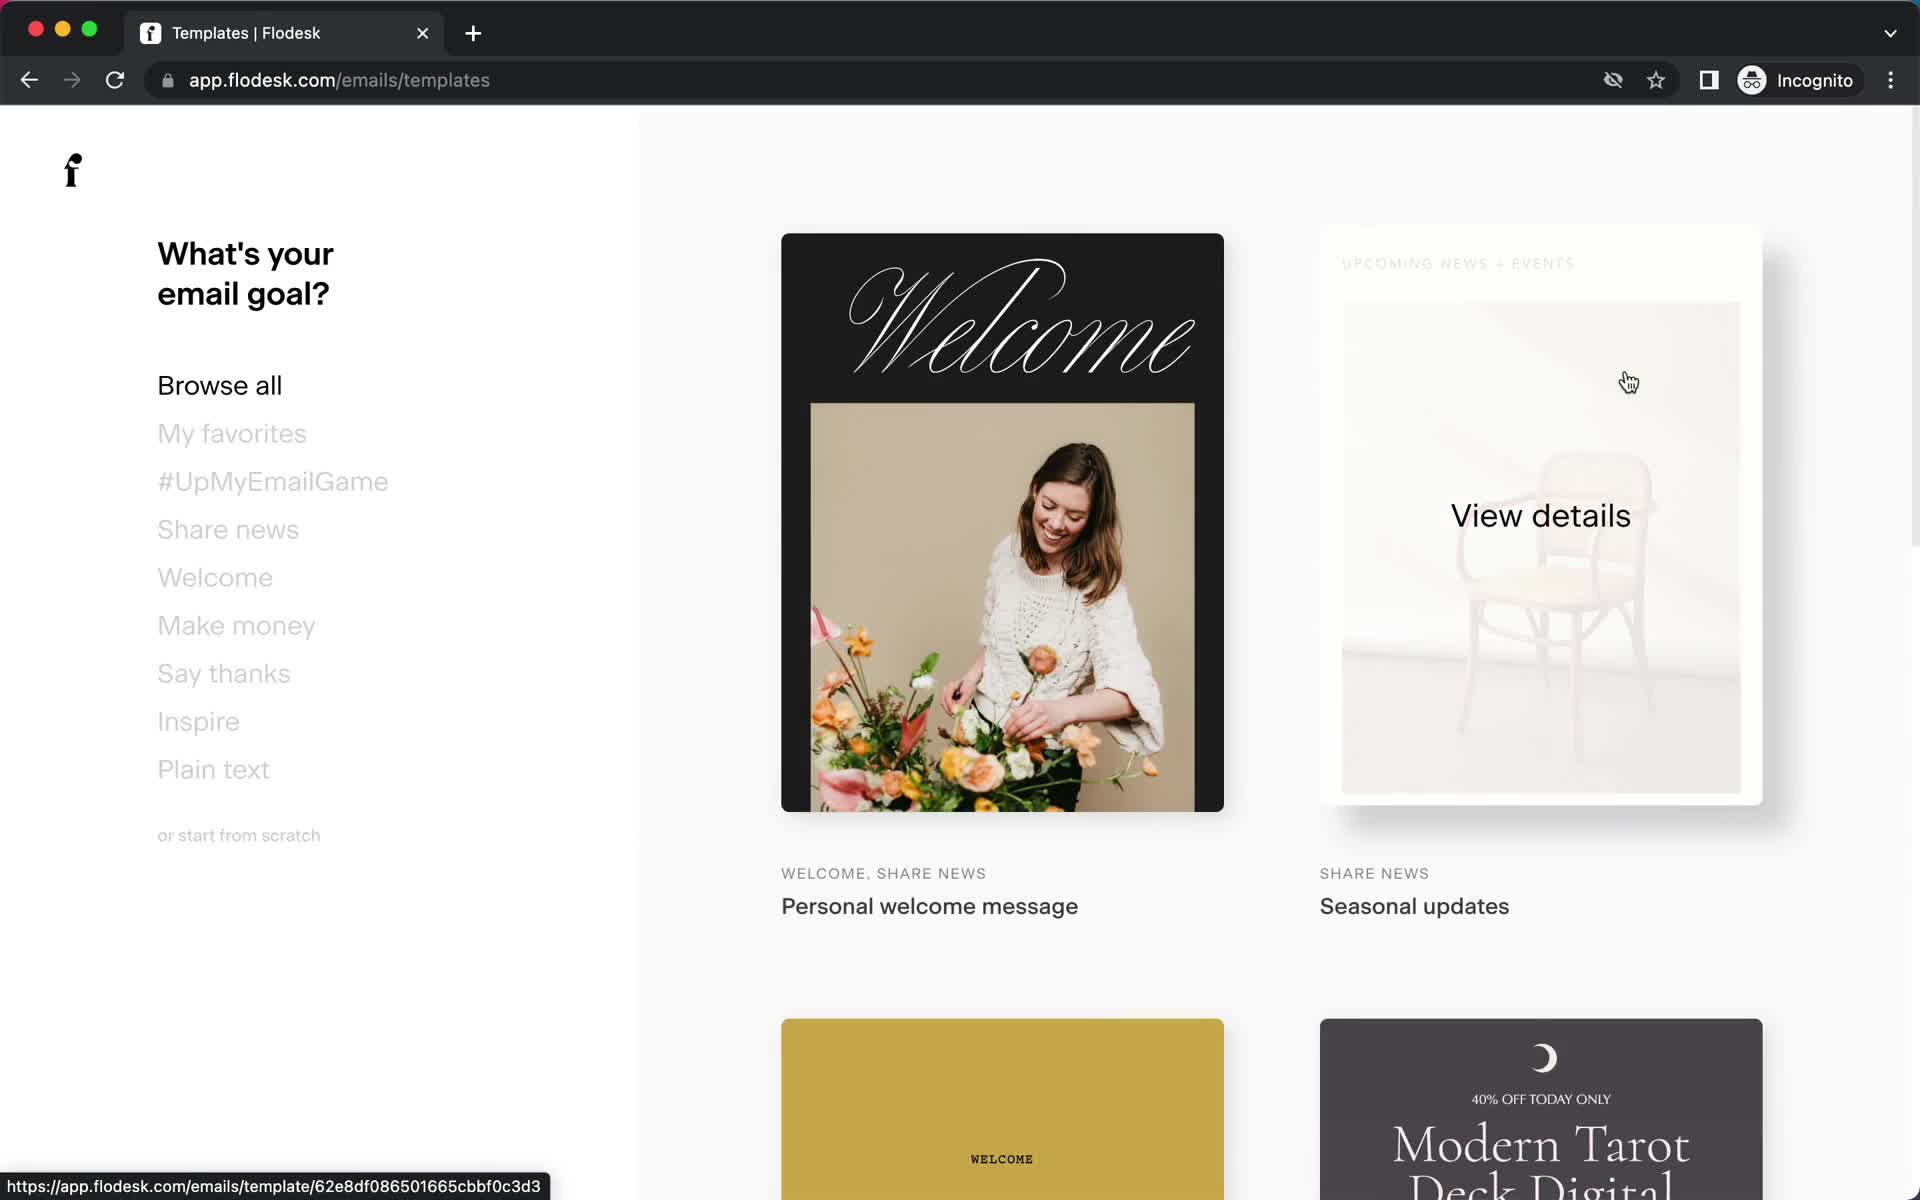
Templates
this is title
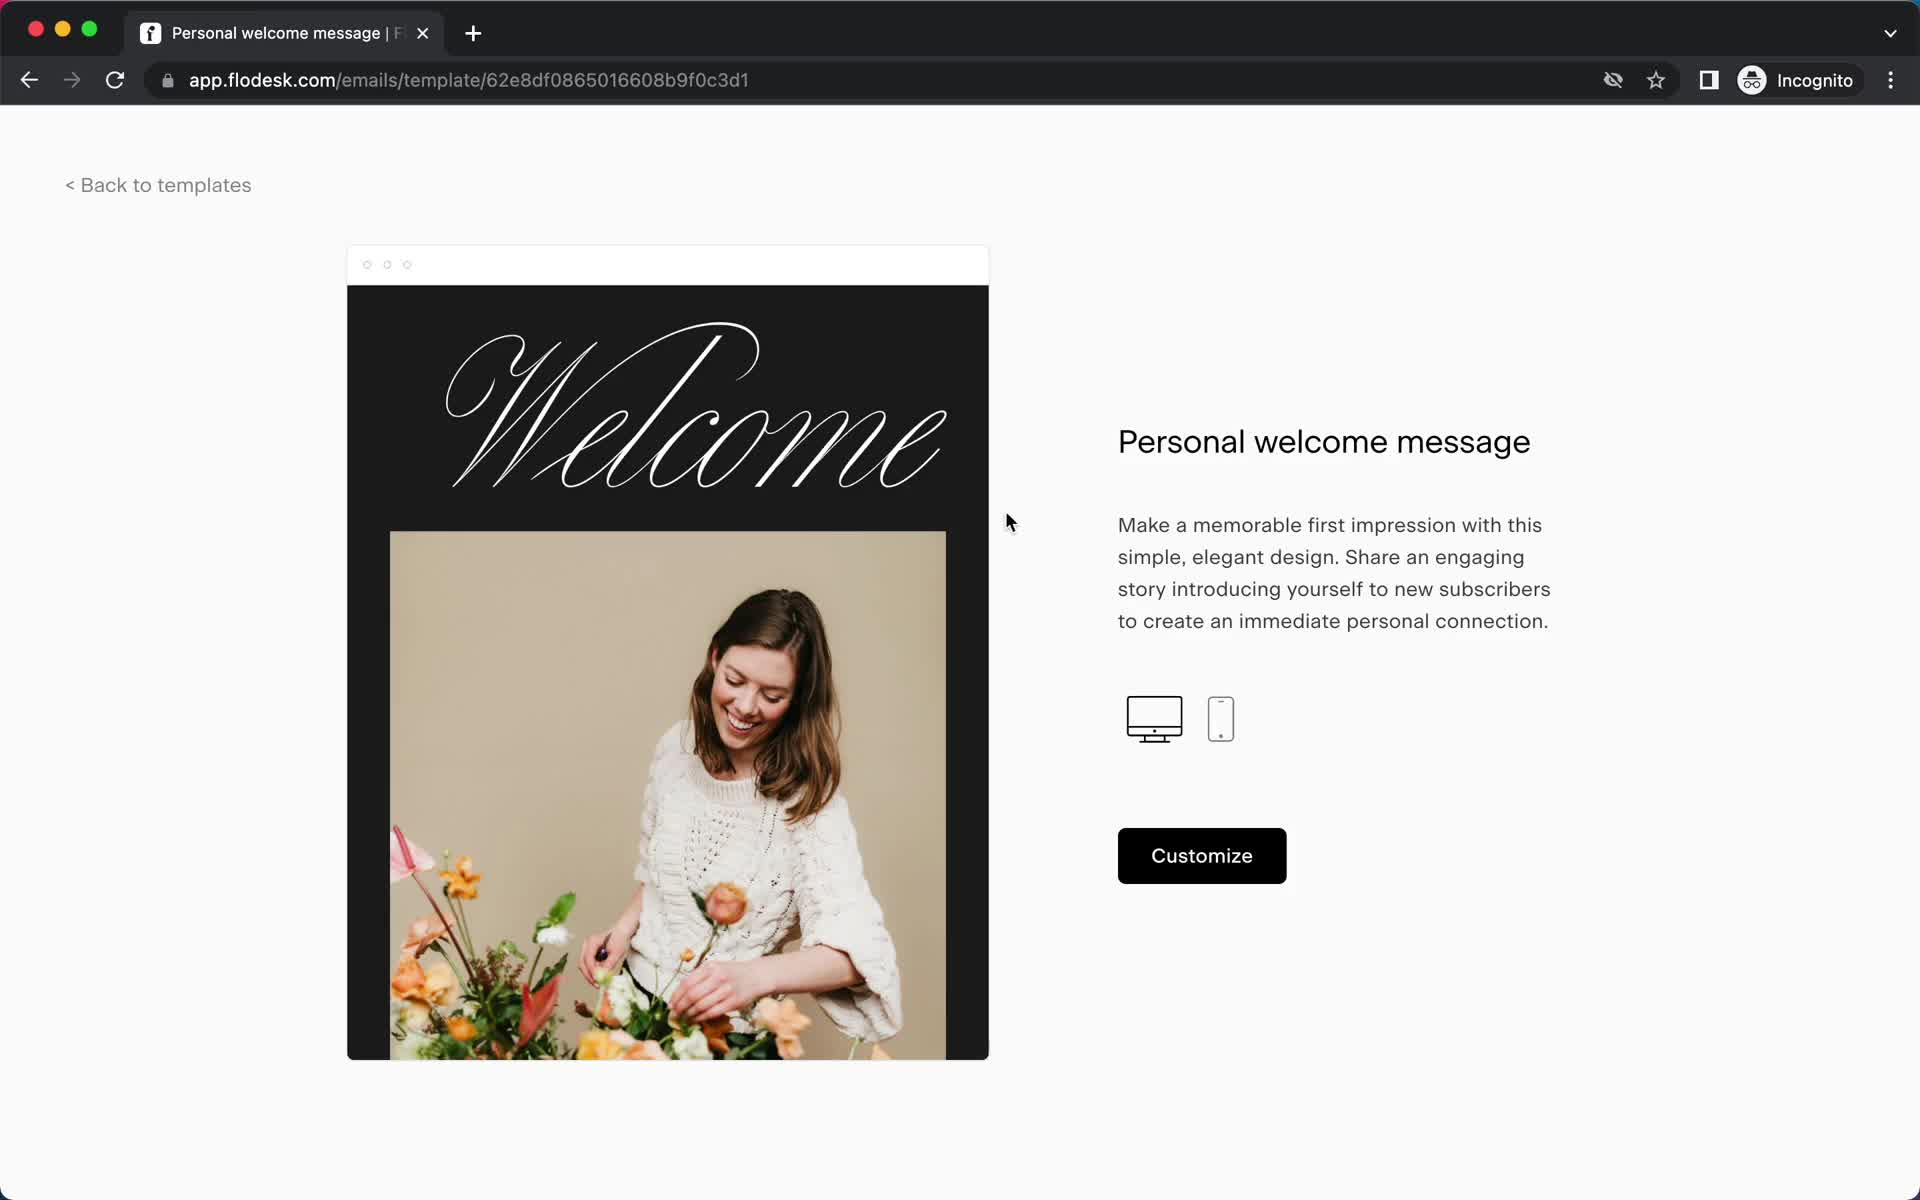
Template preview
this is title
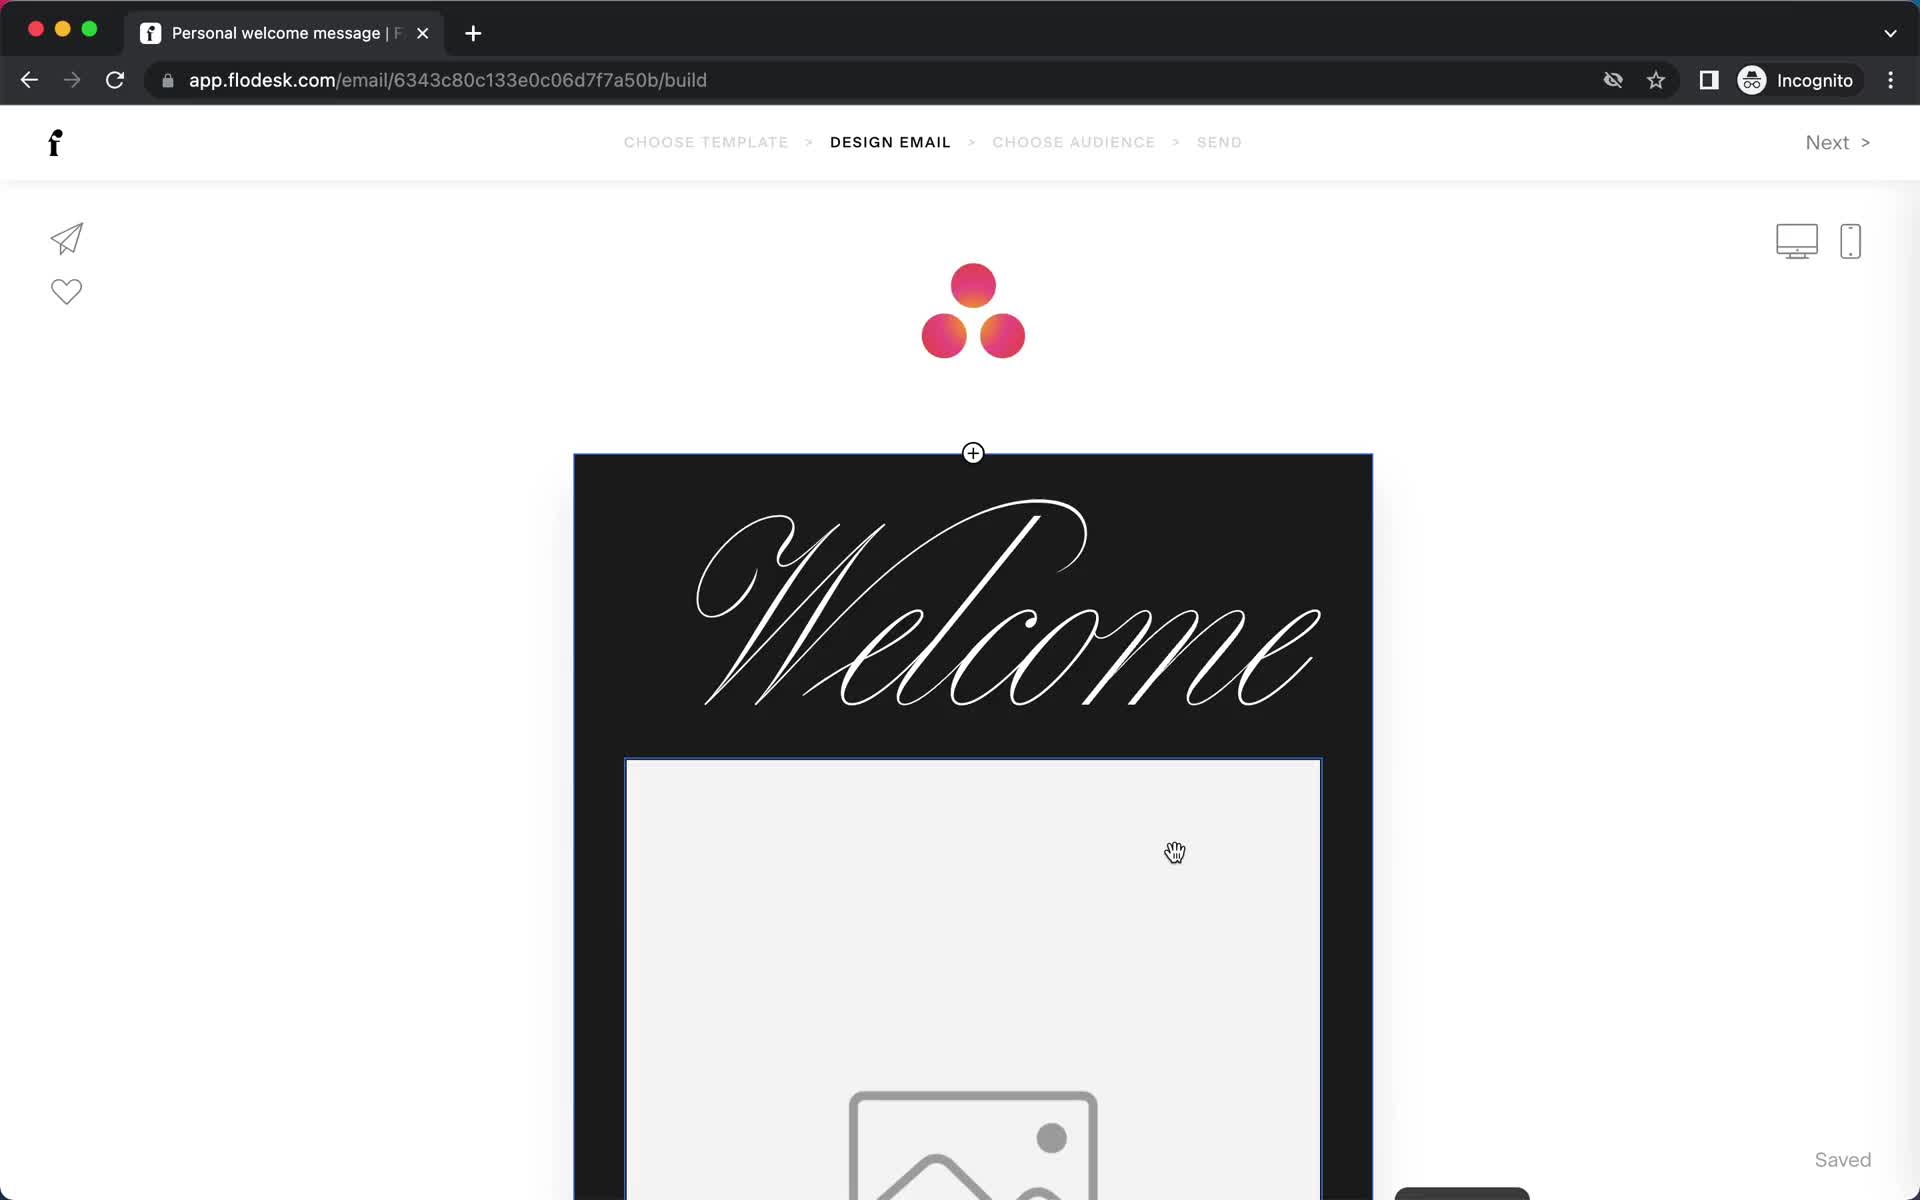
Editor
this is title
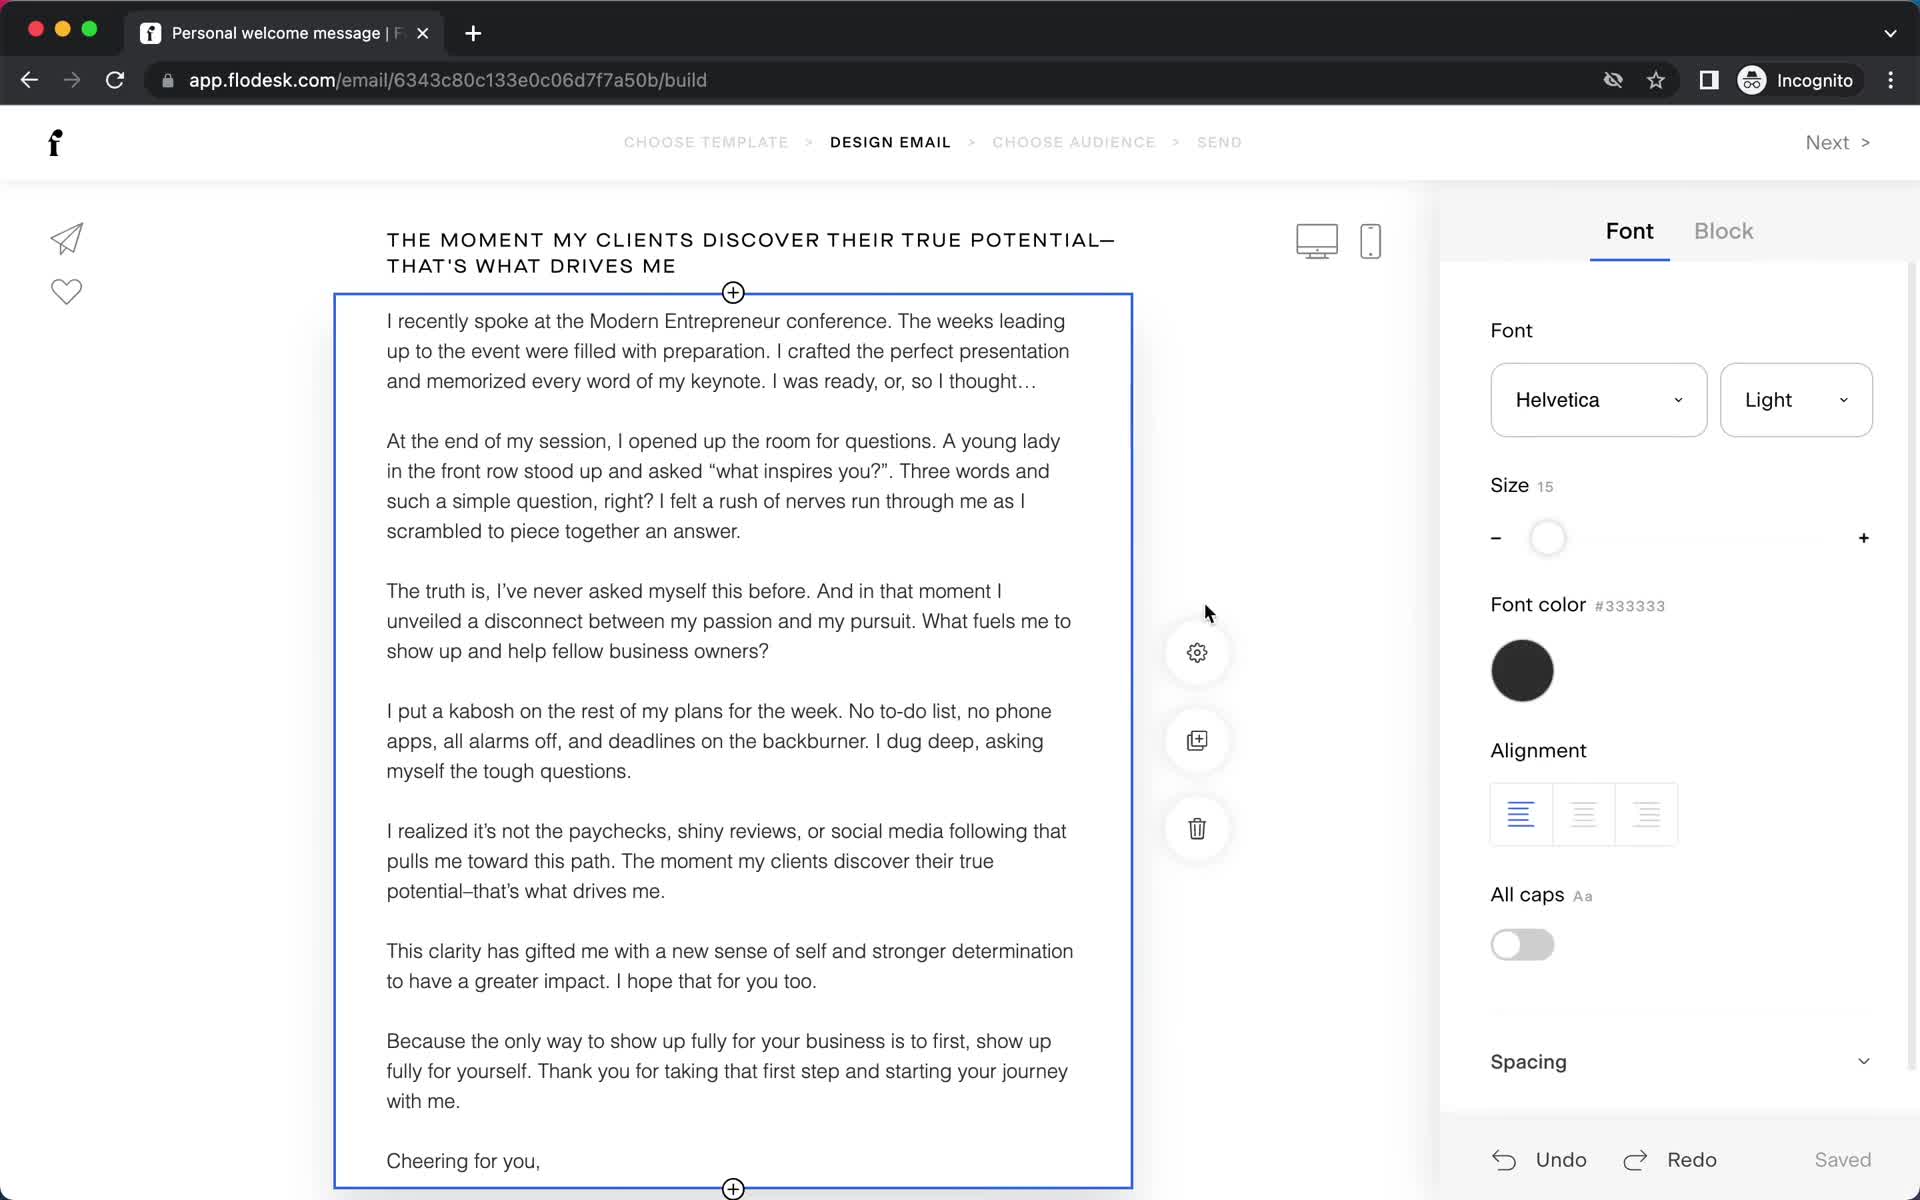
Editor
this is title
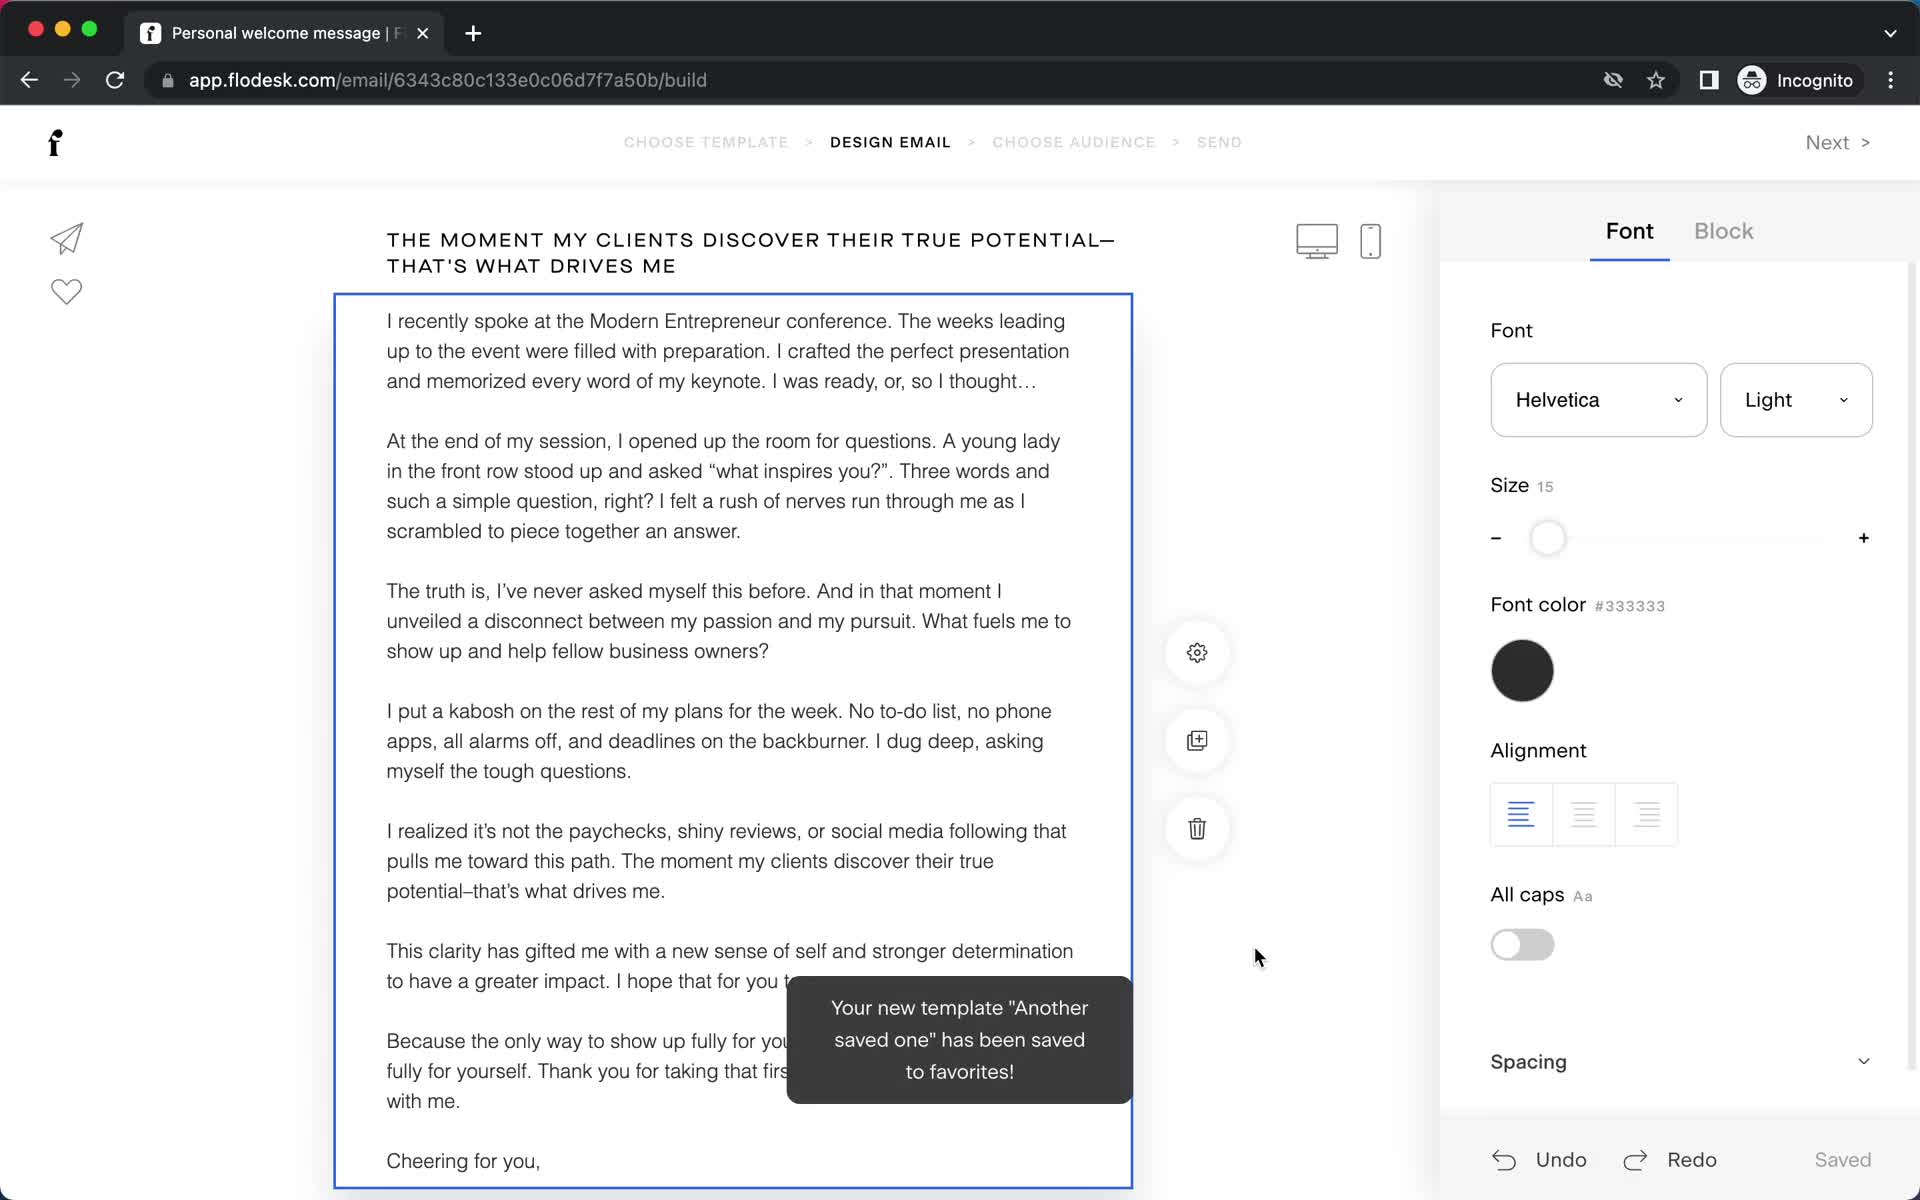
Save
this is title
Editor
this is title
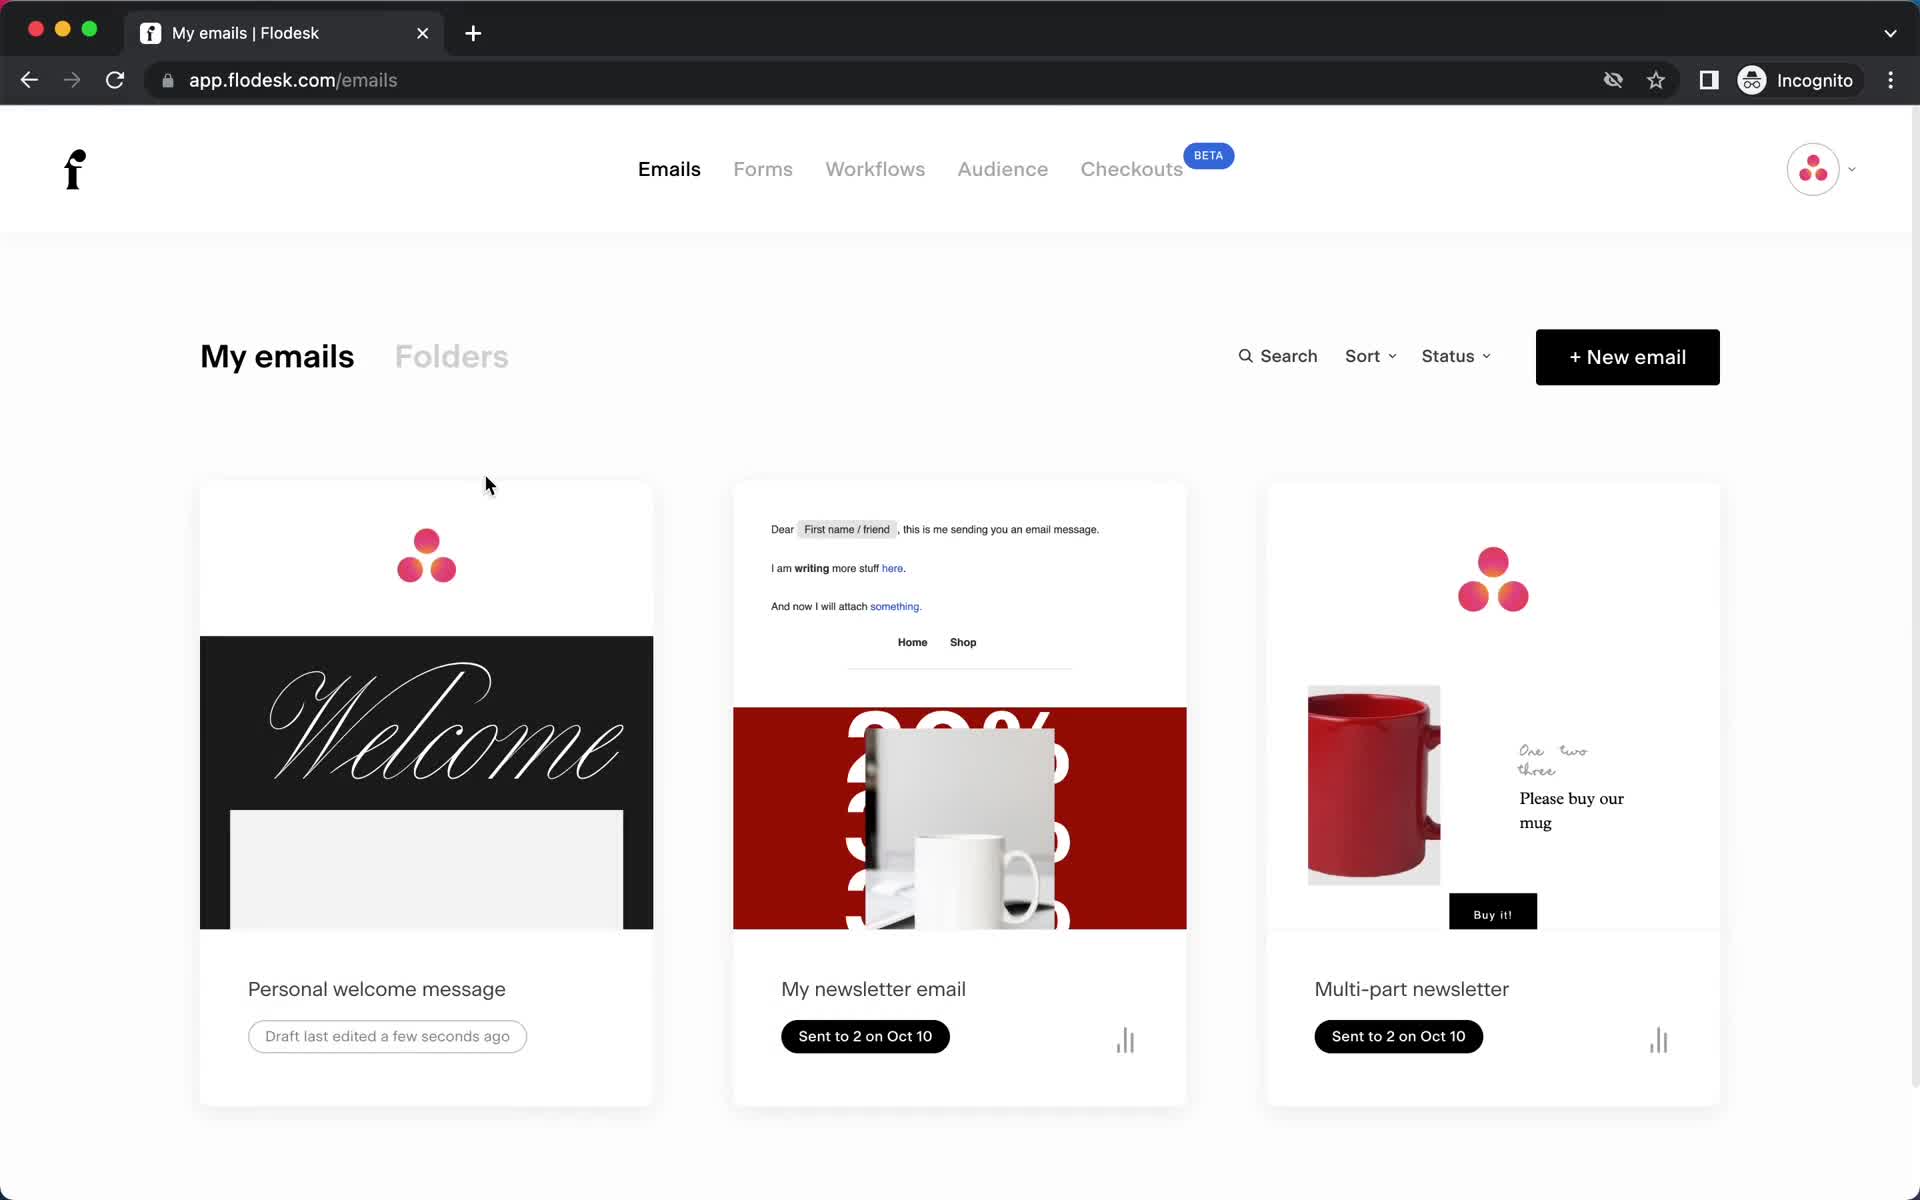
Email campaigns
this is title
Forms
this is title
Form builder
this is title
Form builder
this is title
Customize appearance
this is title
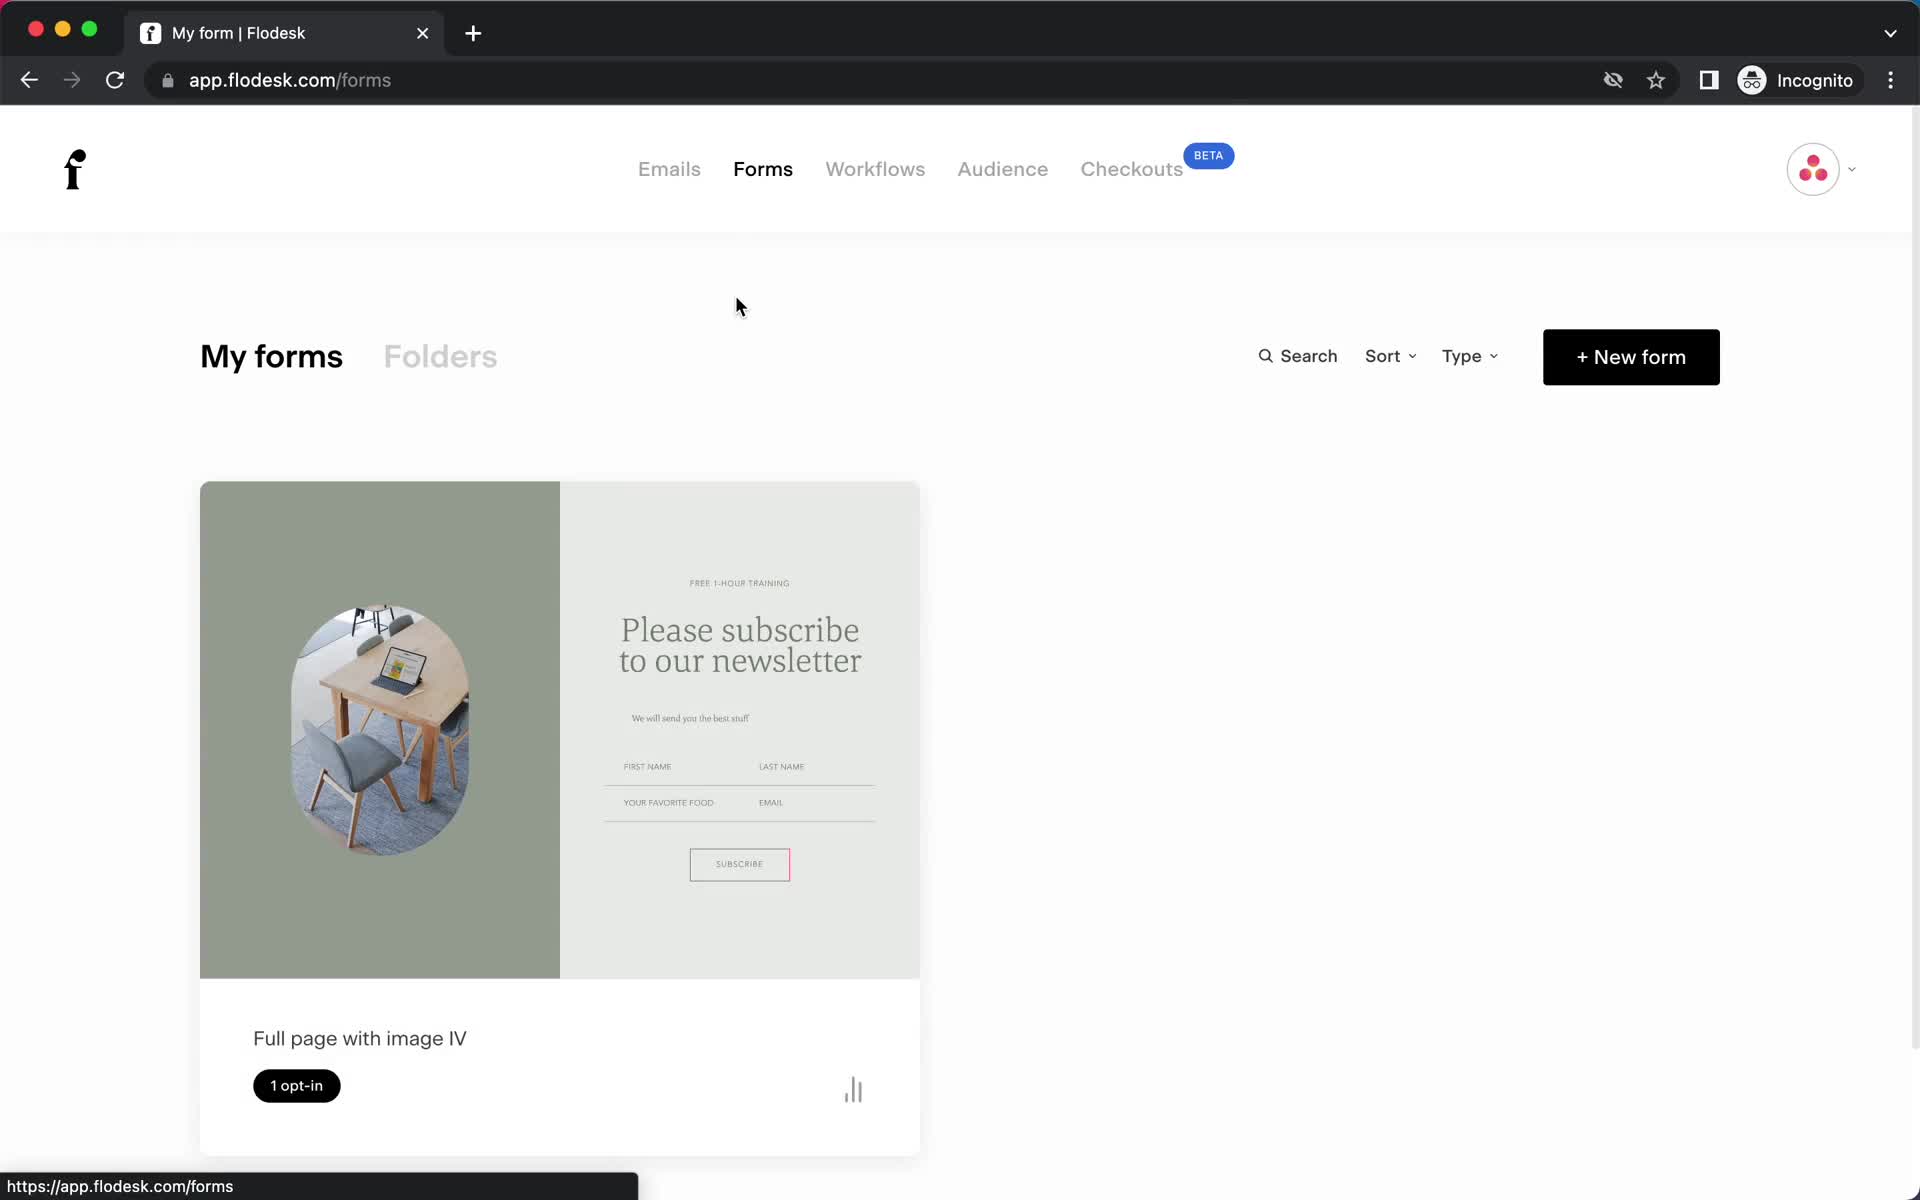
Forms
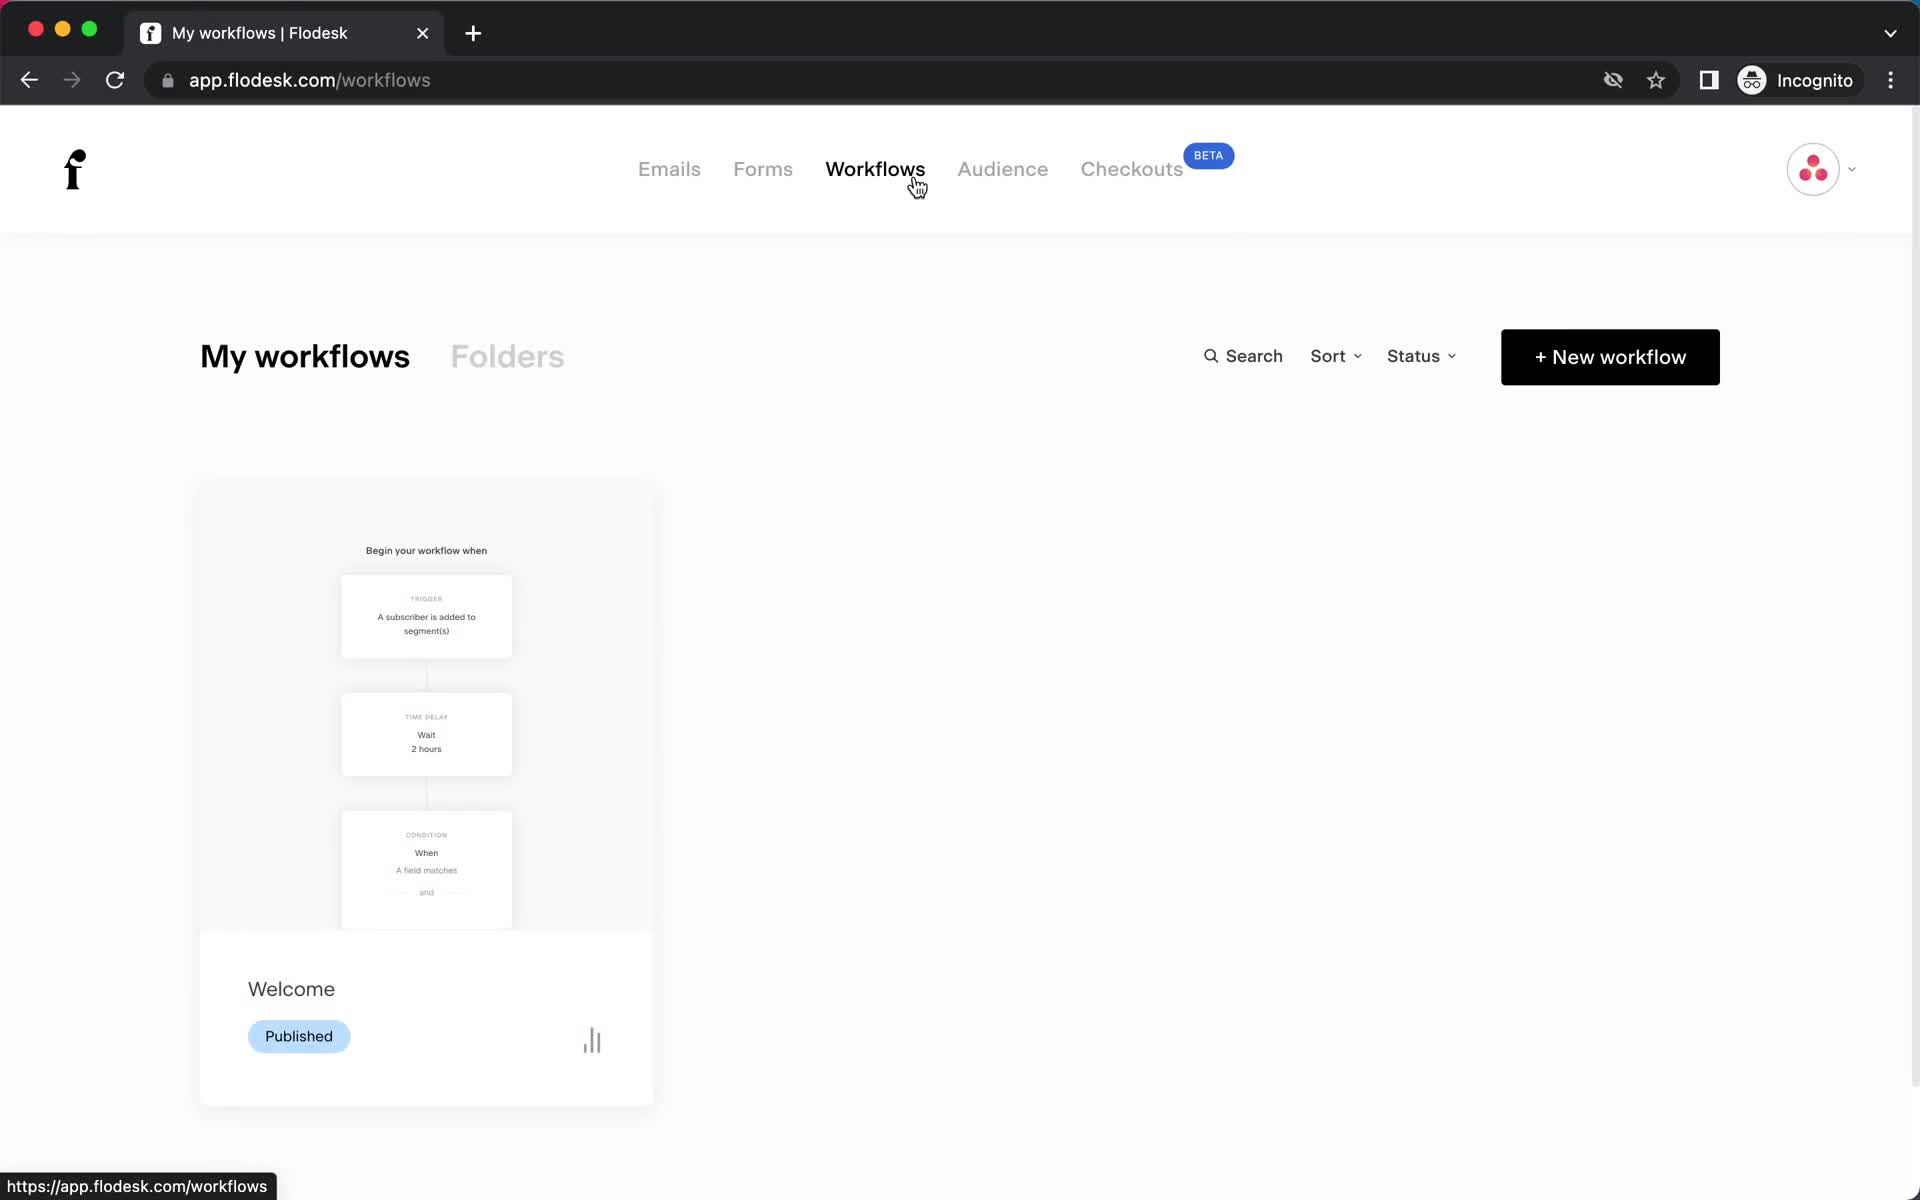
this is title
Workflows
this is title
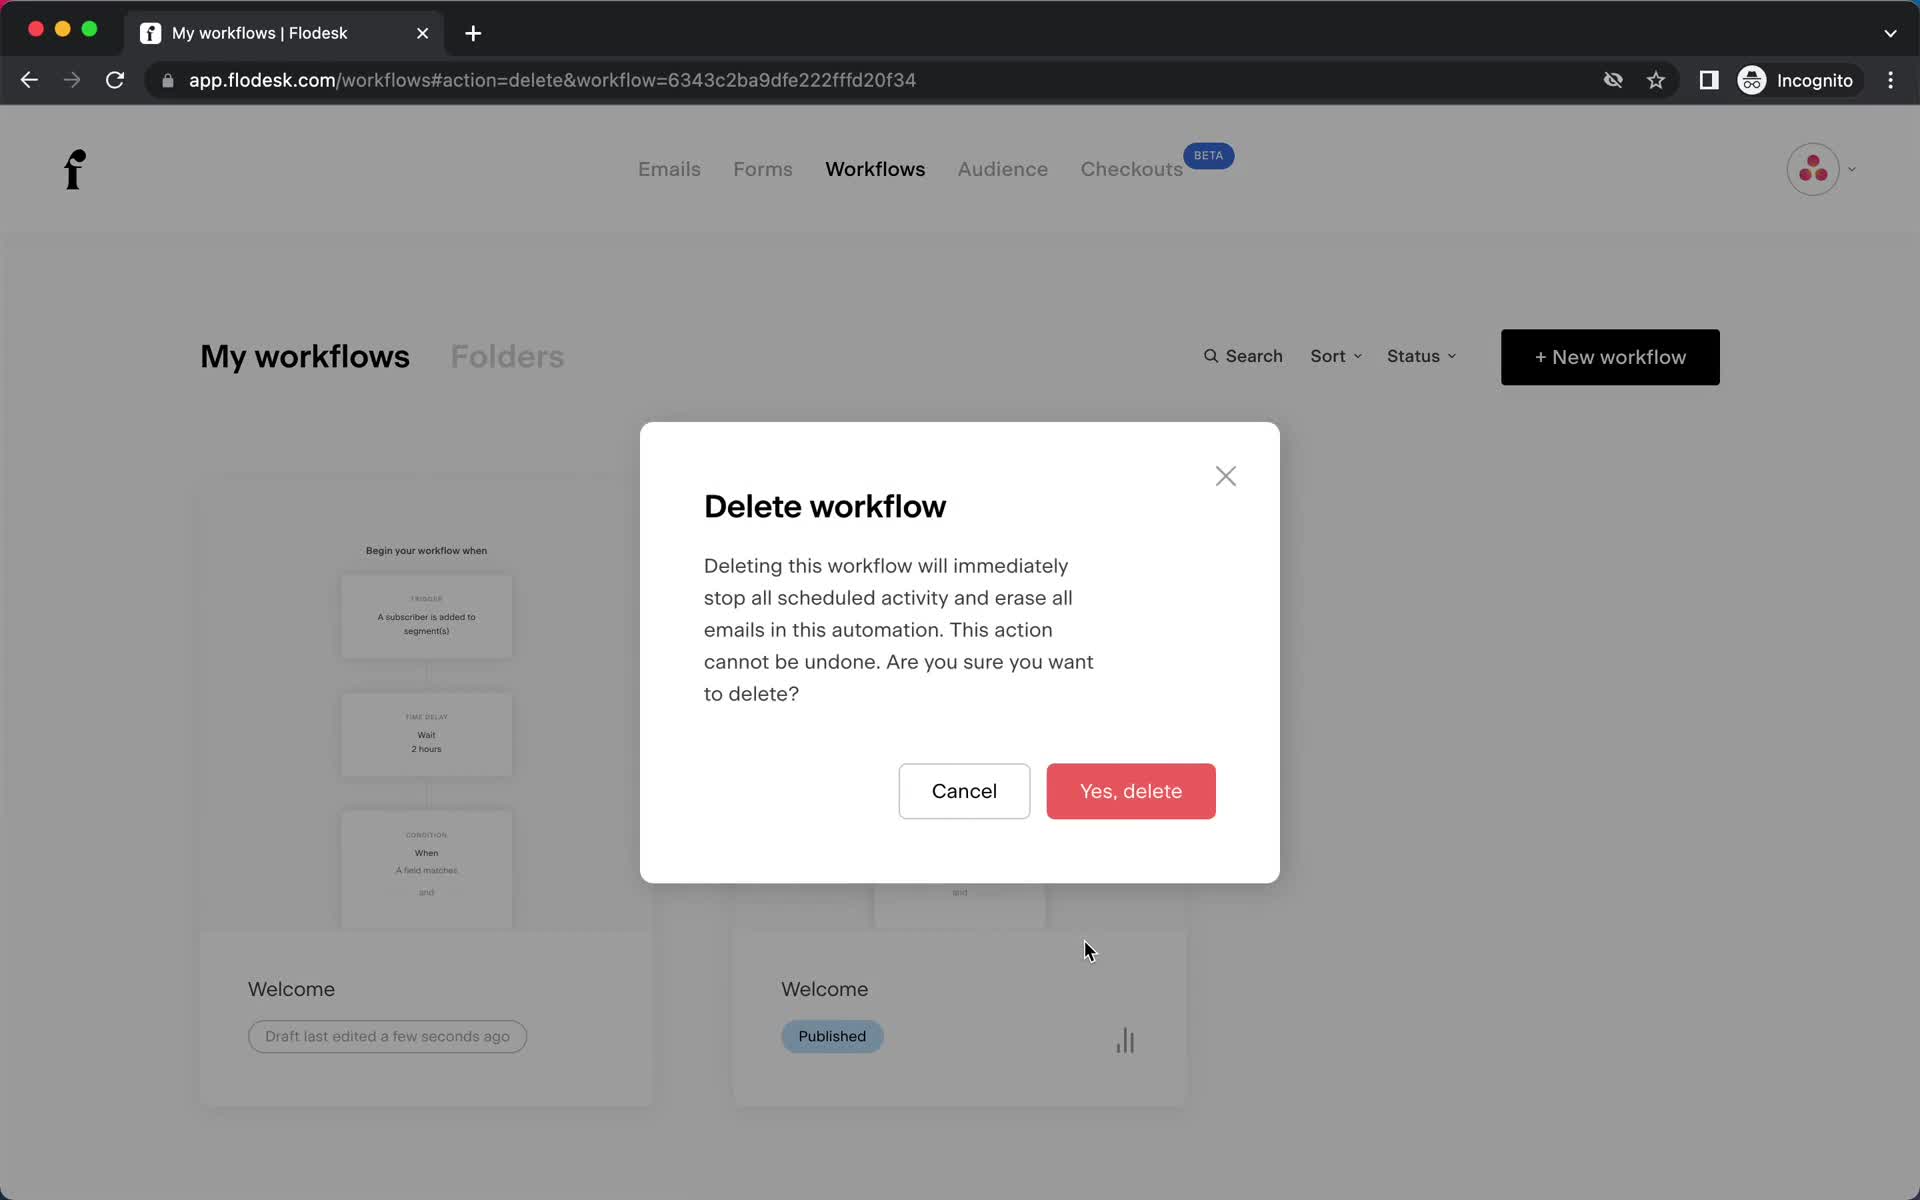
Confirm delete
this is title
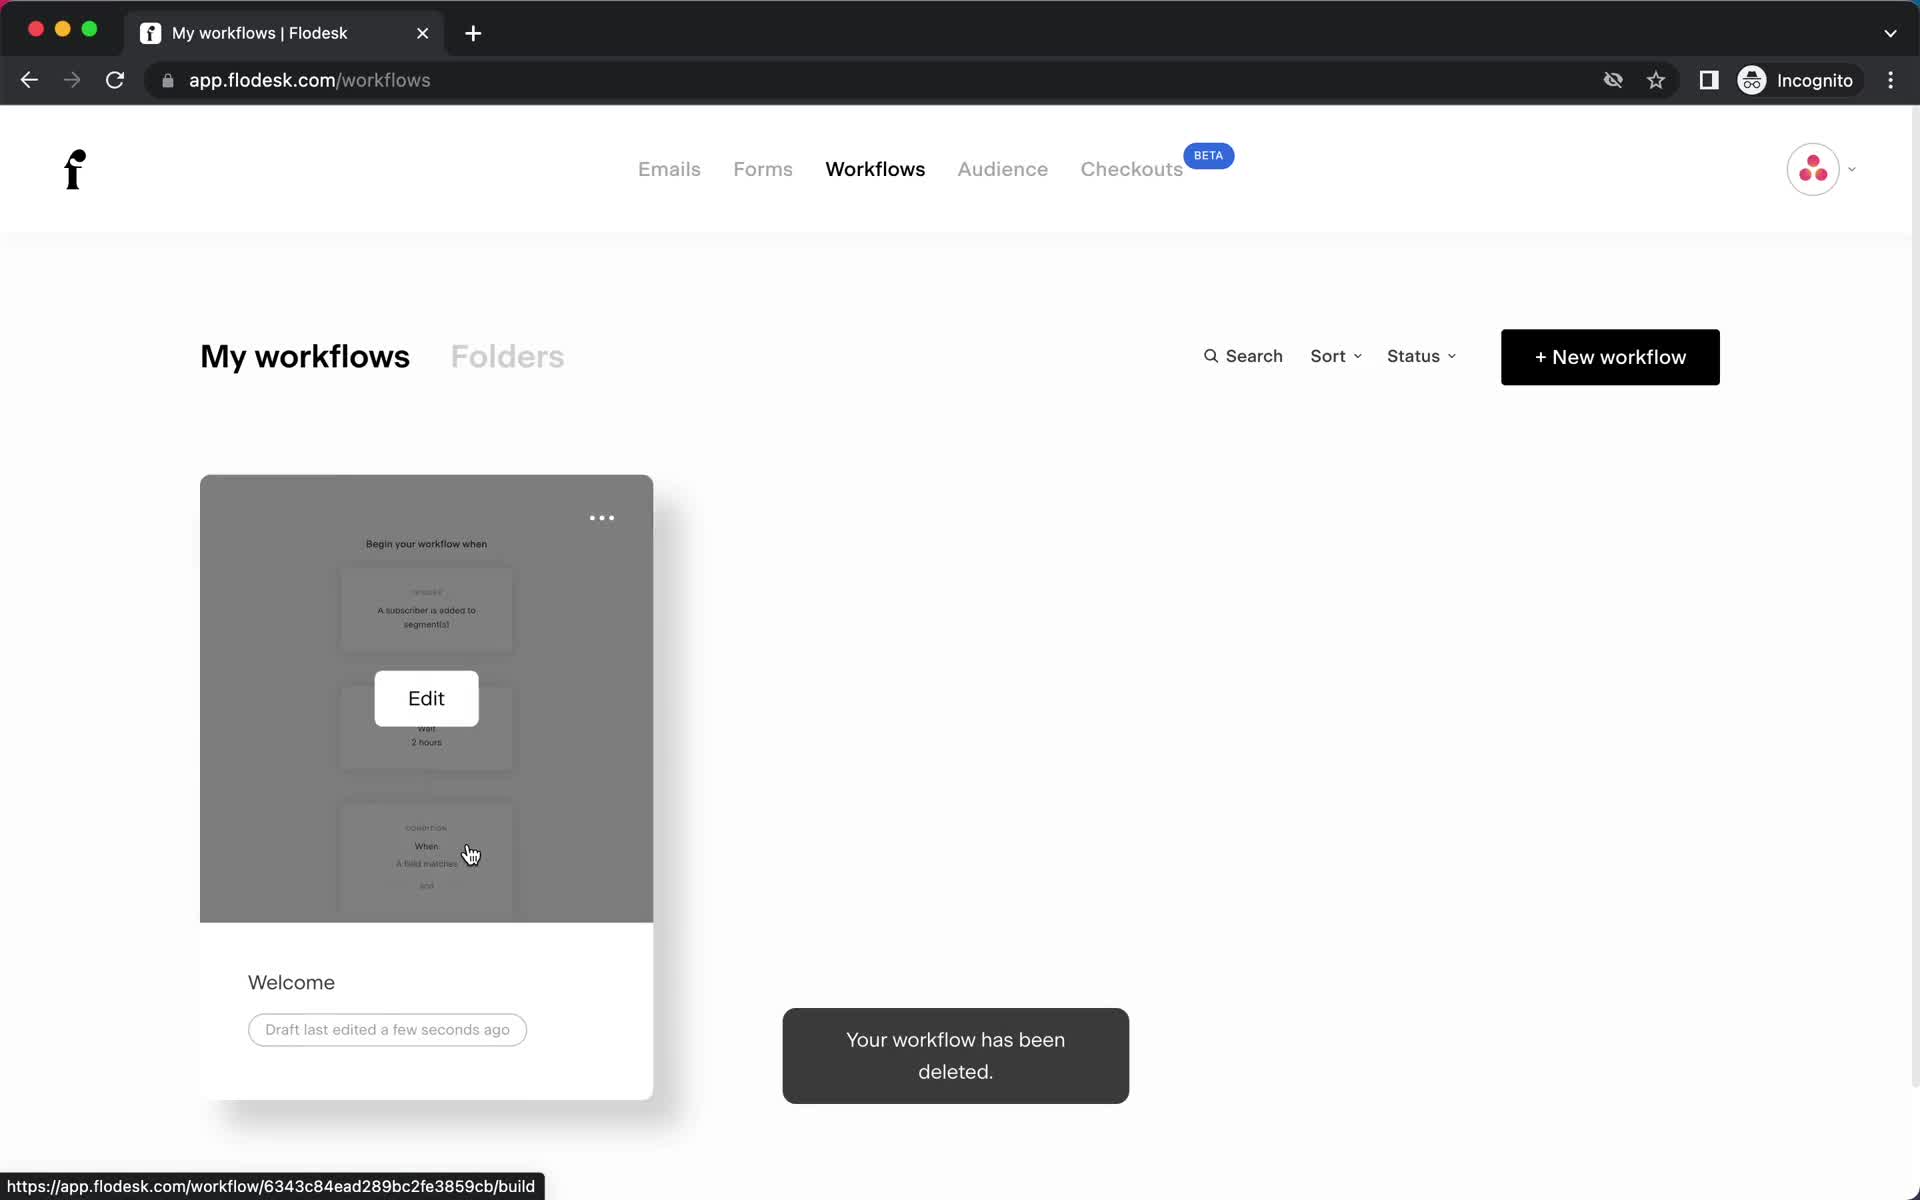
Item deleted
this is title
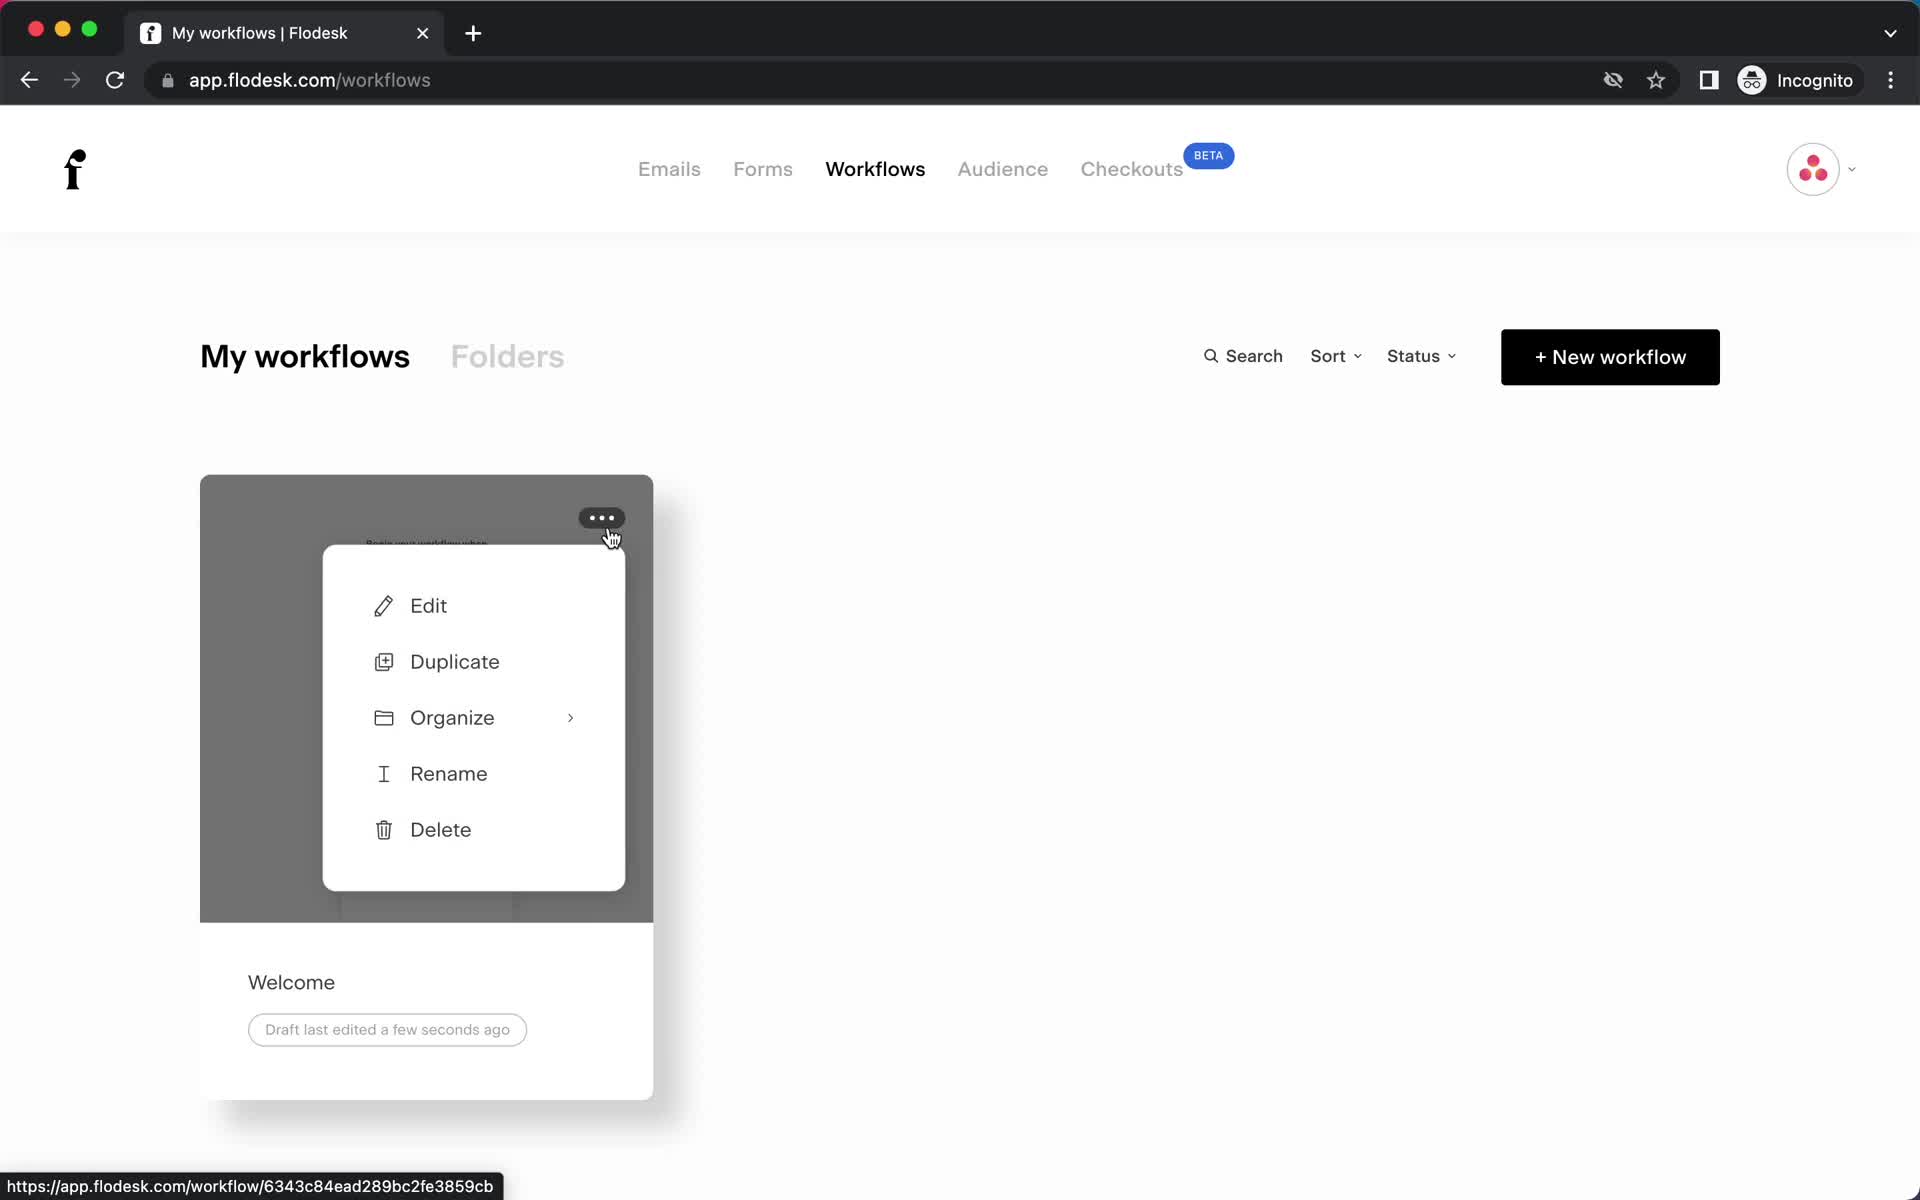
Action menu
this is title
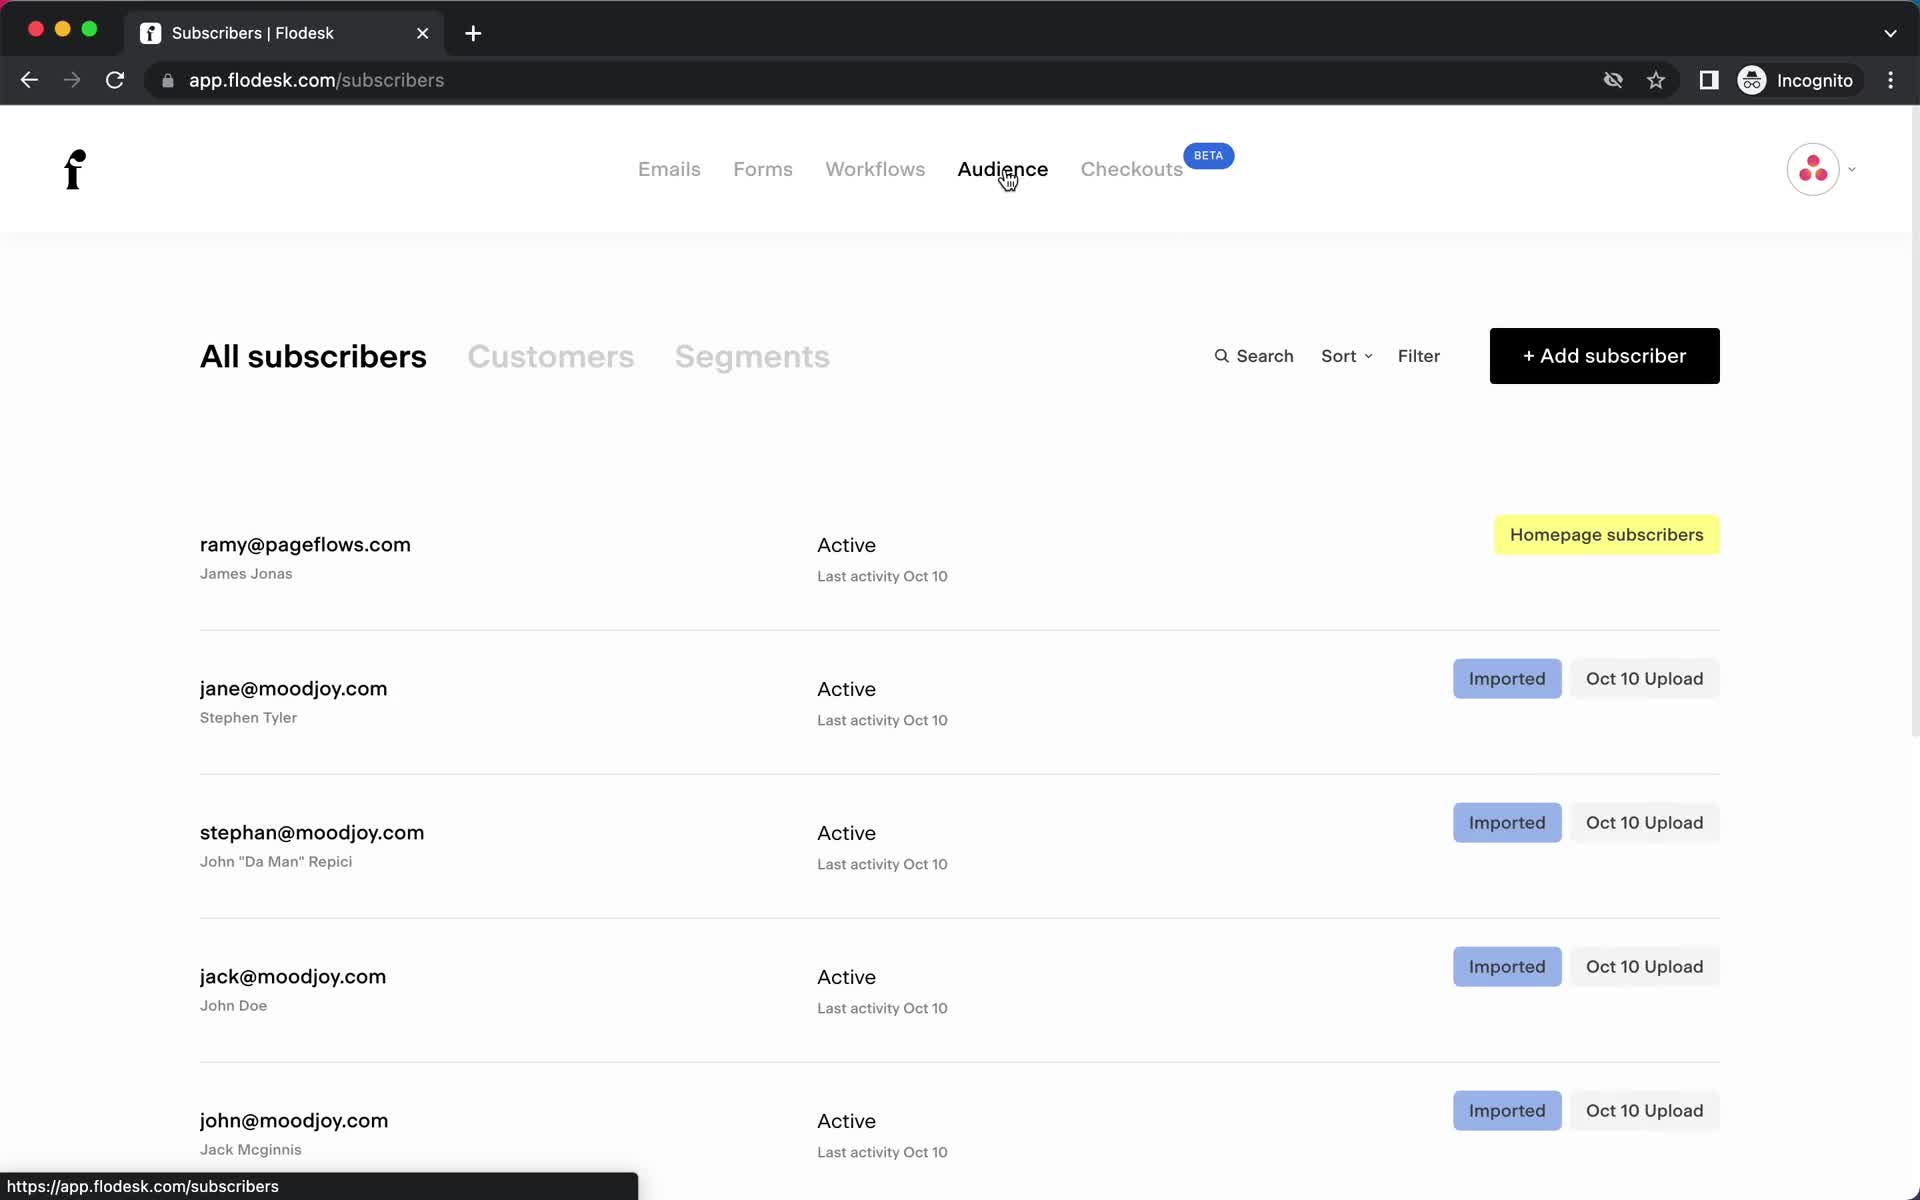
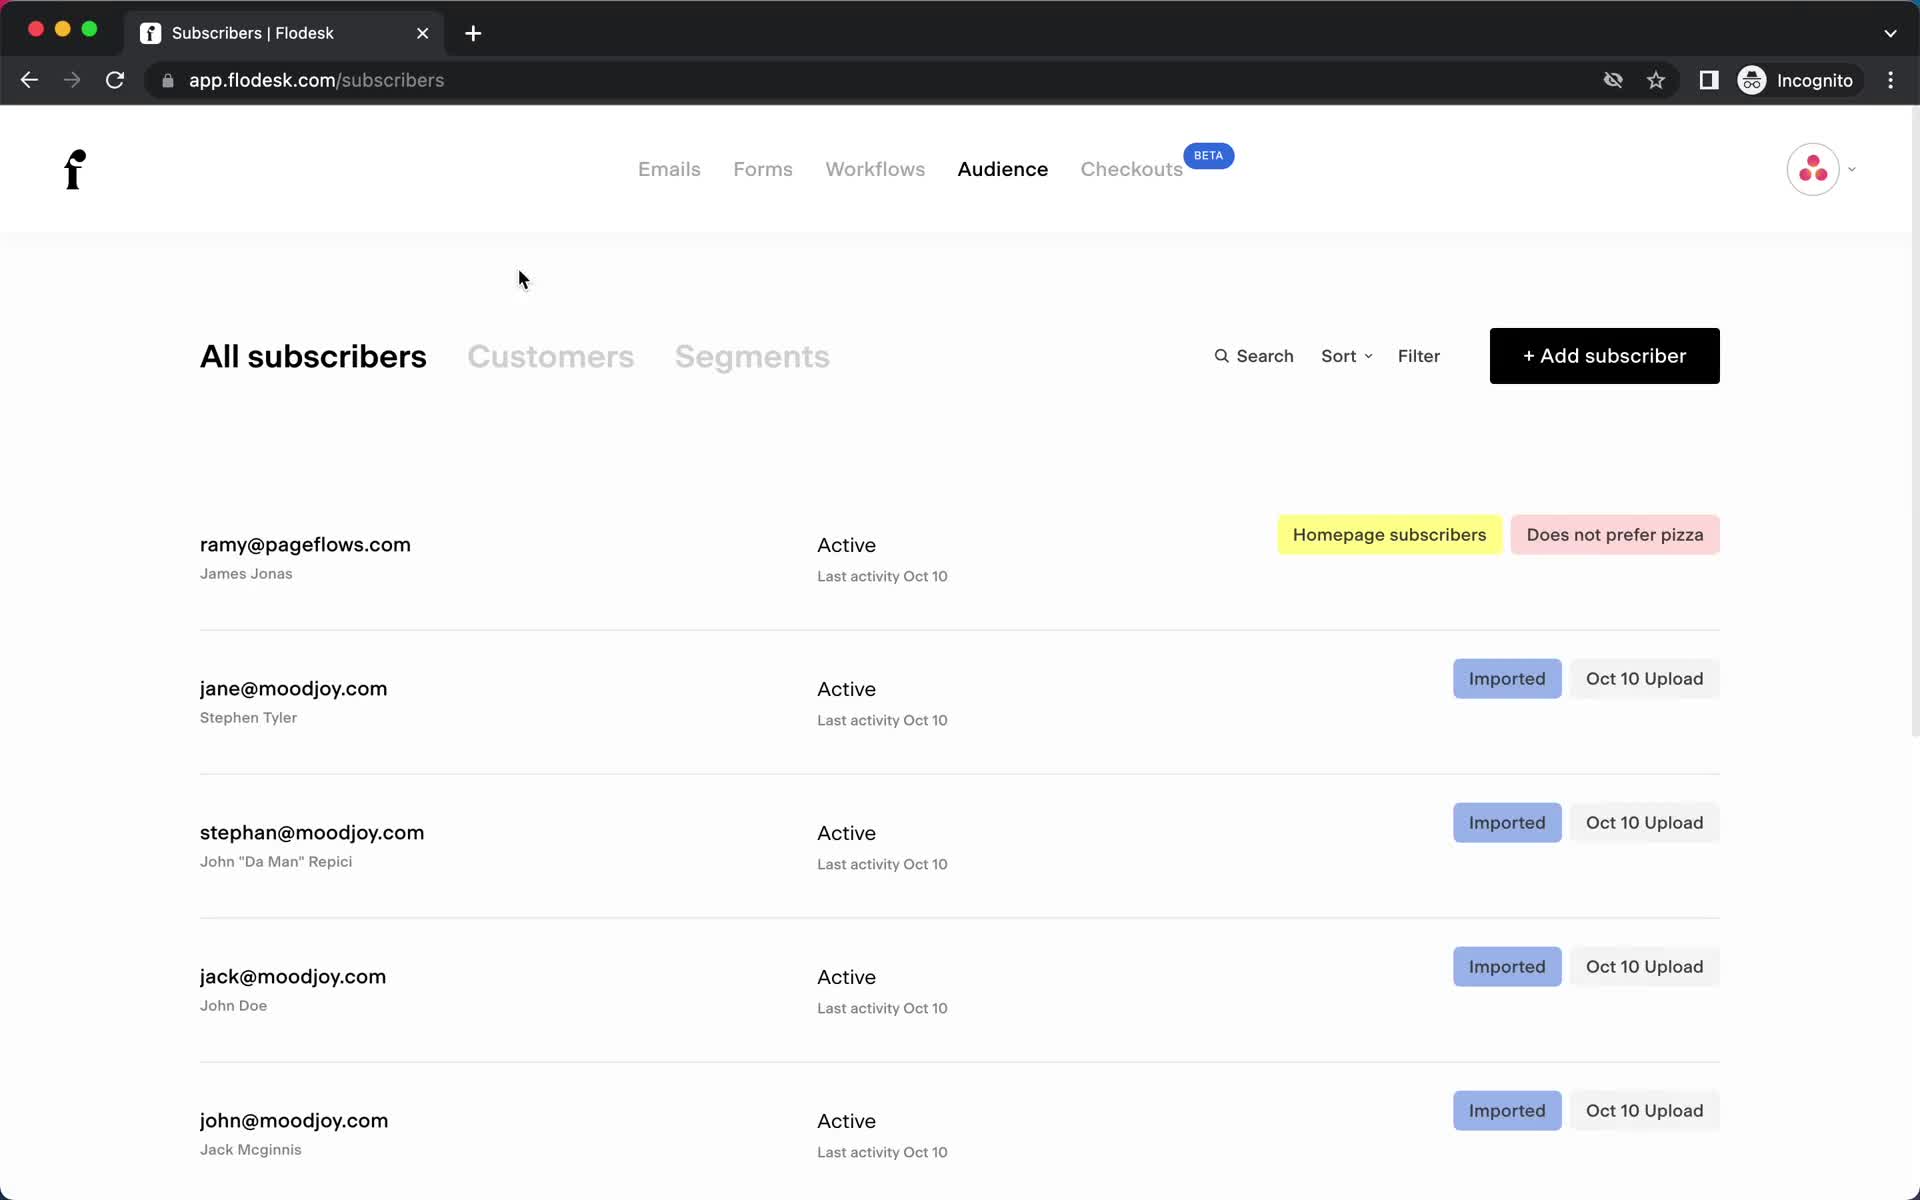
Subscribers
this is title
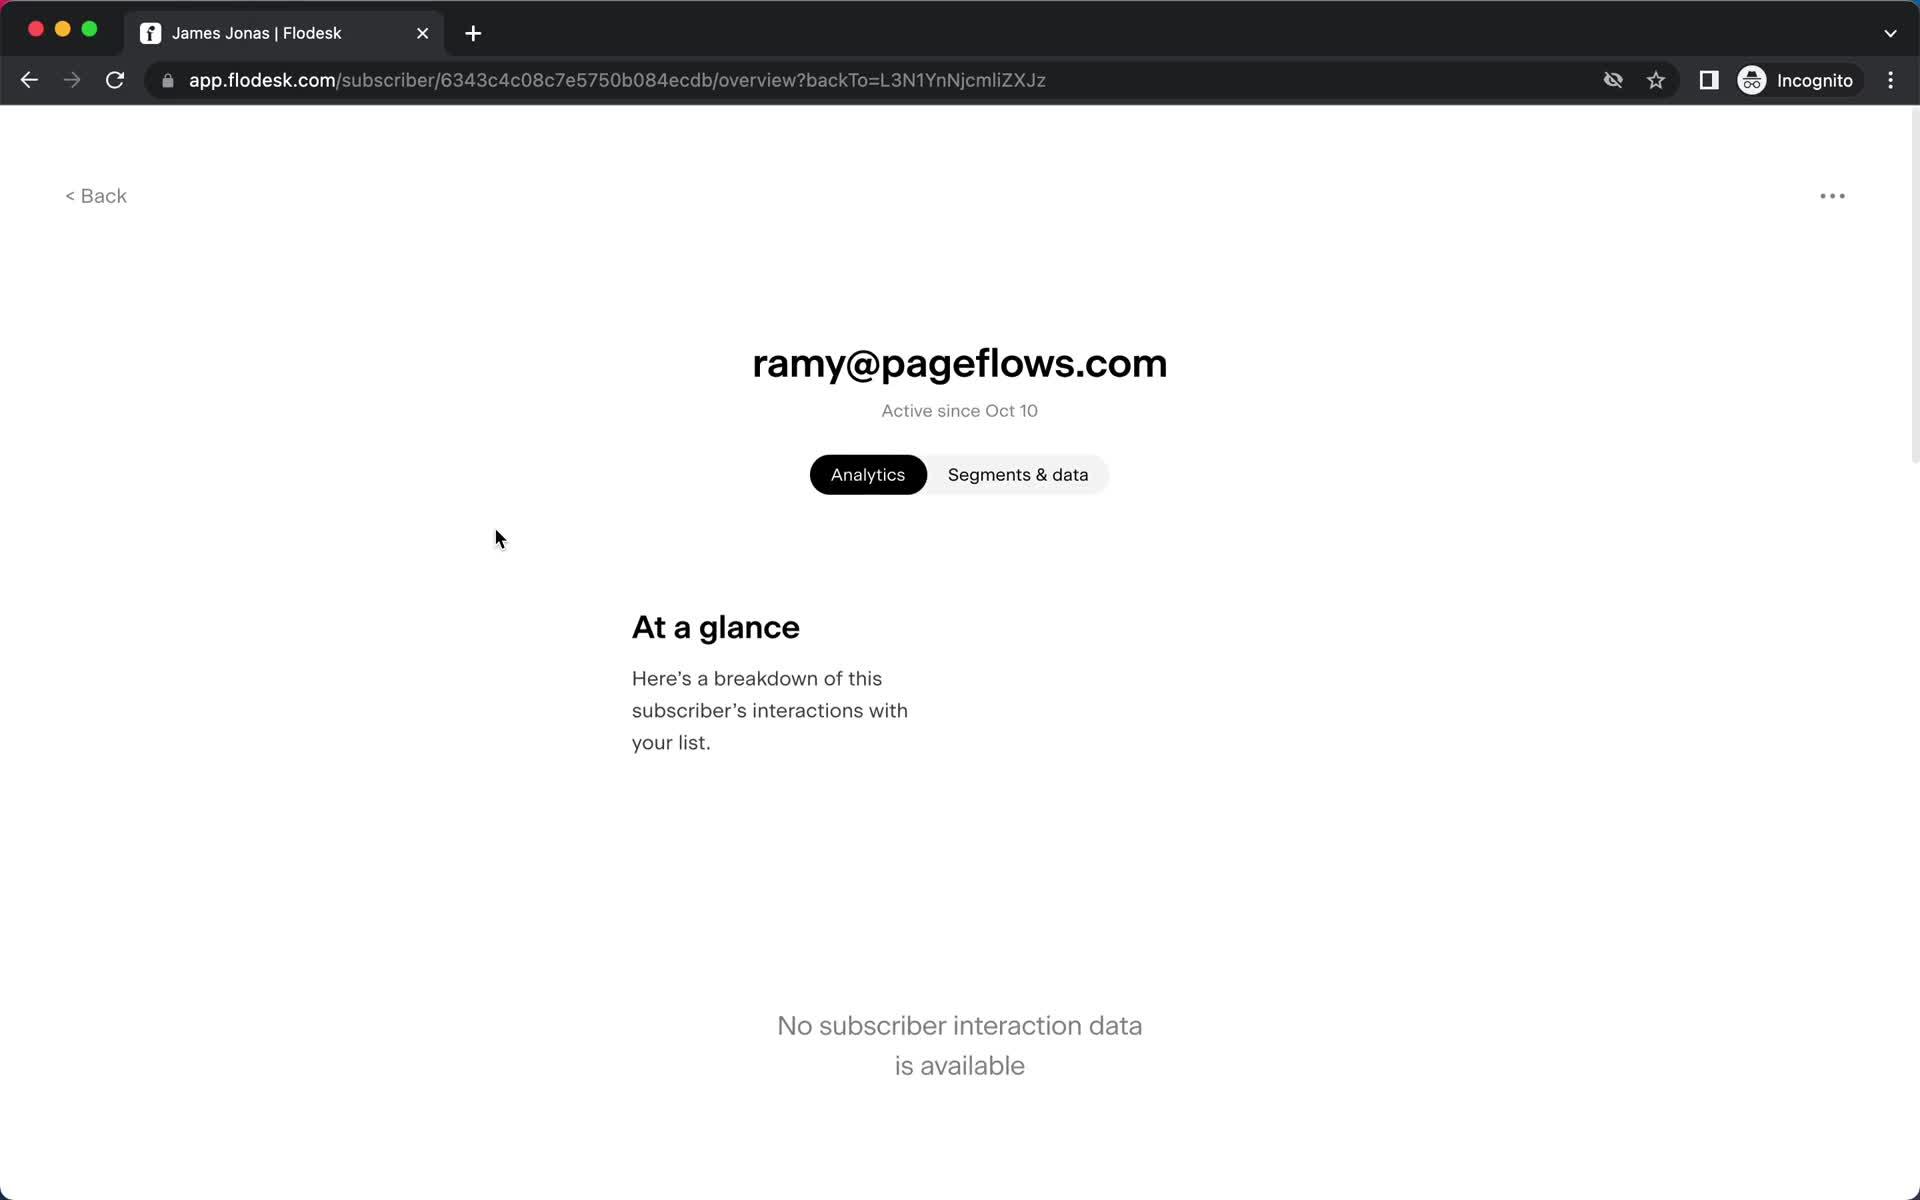
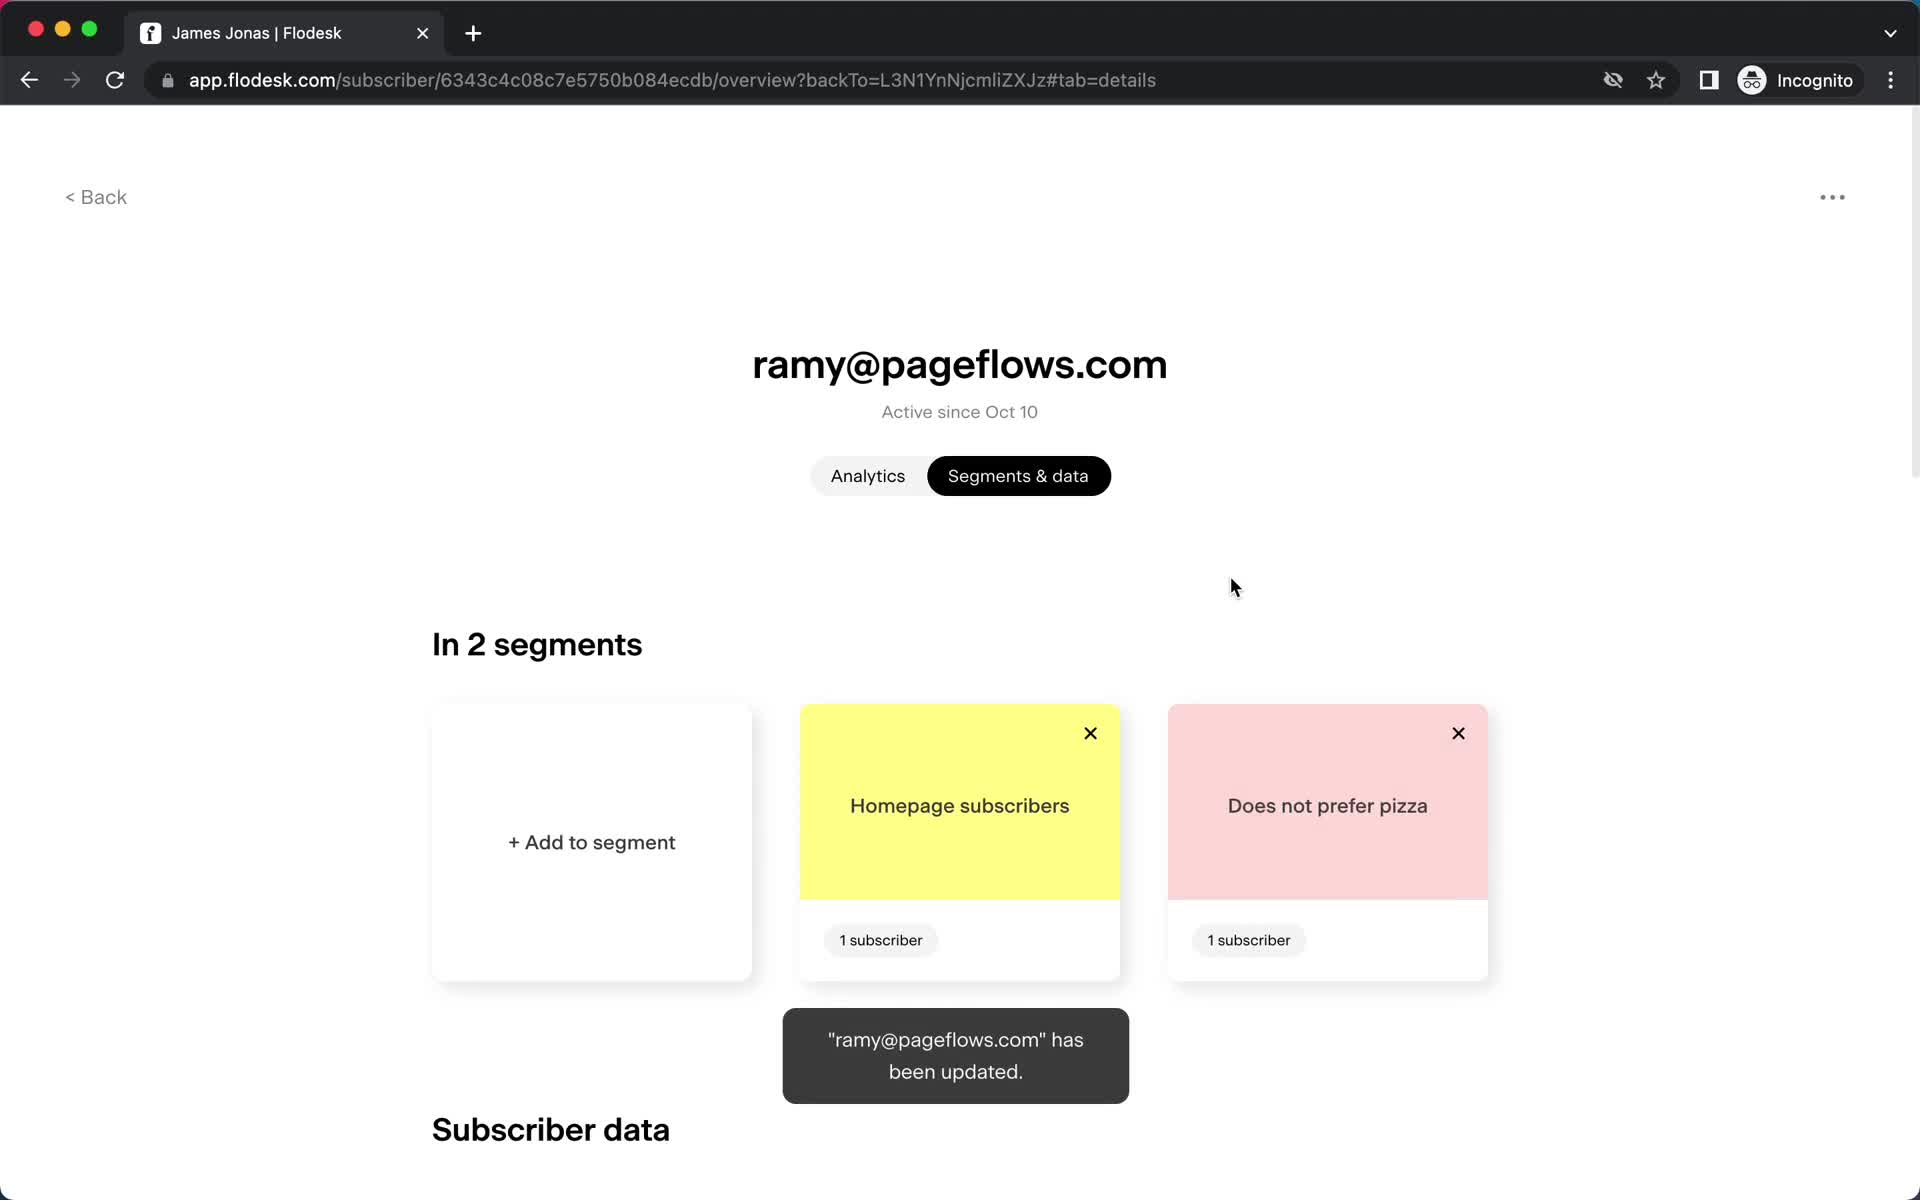
Contact details
this is title
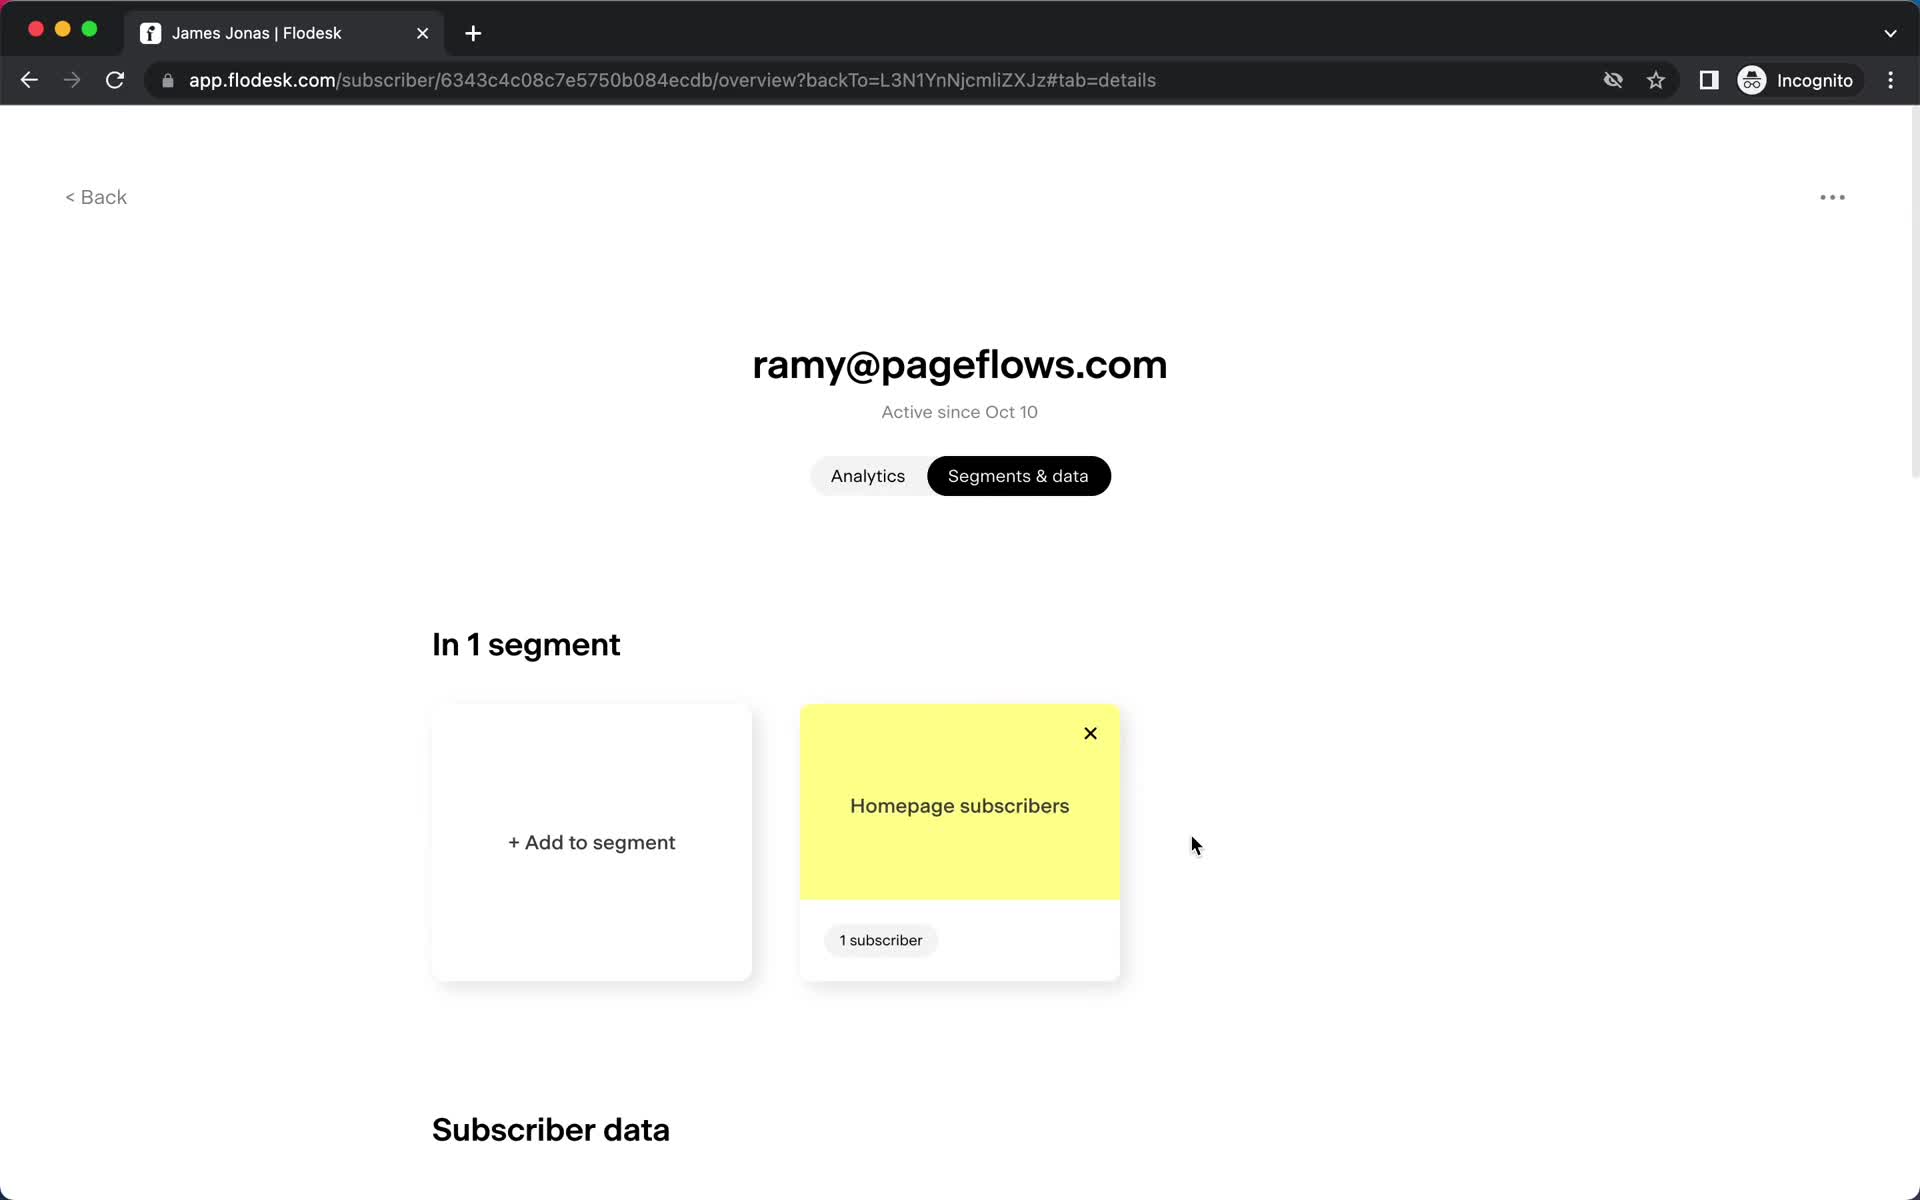
Segments
this is title
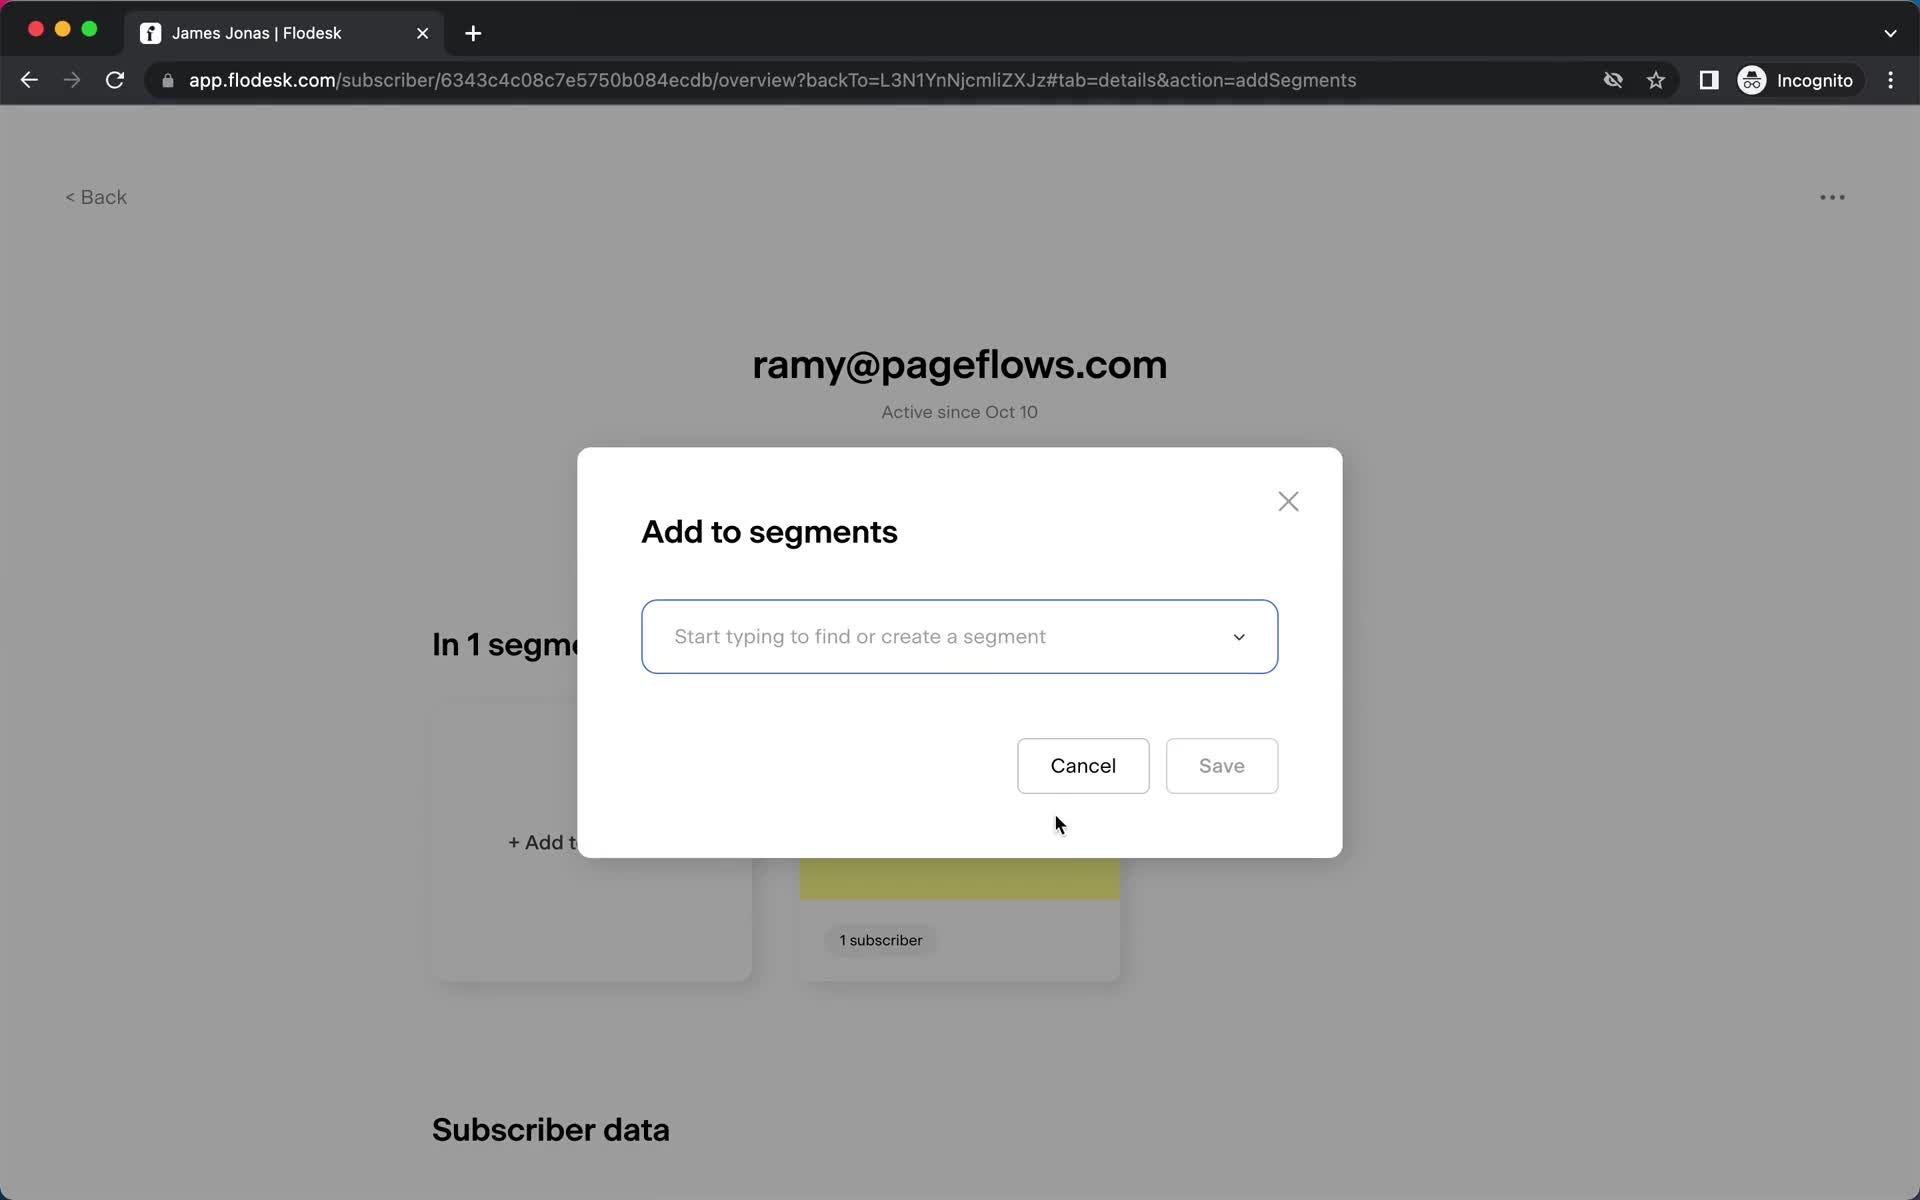
Add to segment
this is title
Changes saved
this is title
Subscribers
this is title
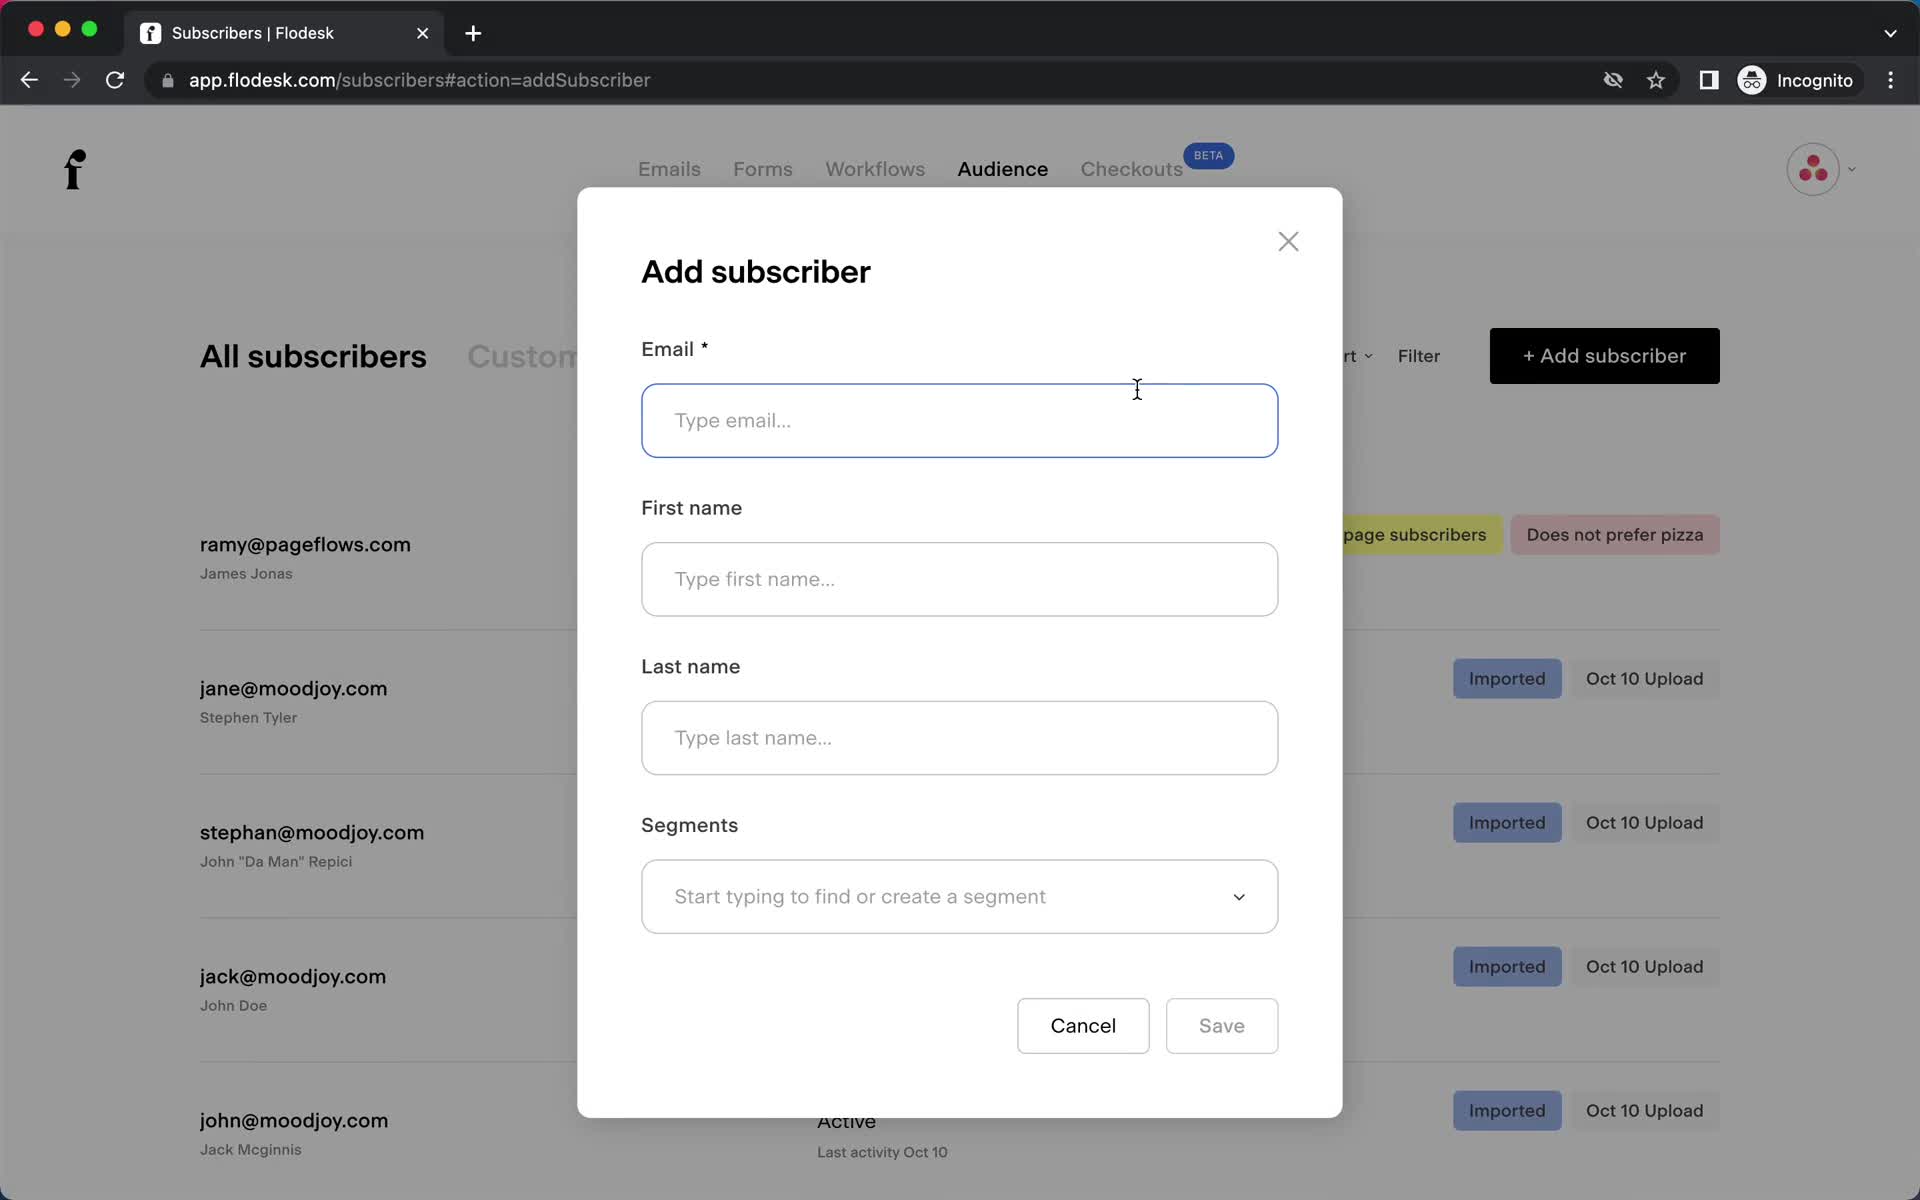
Add subscriber
this is title
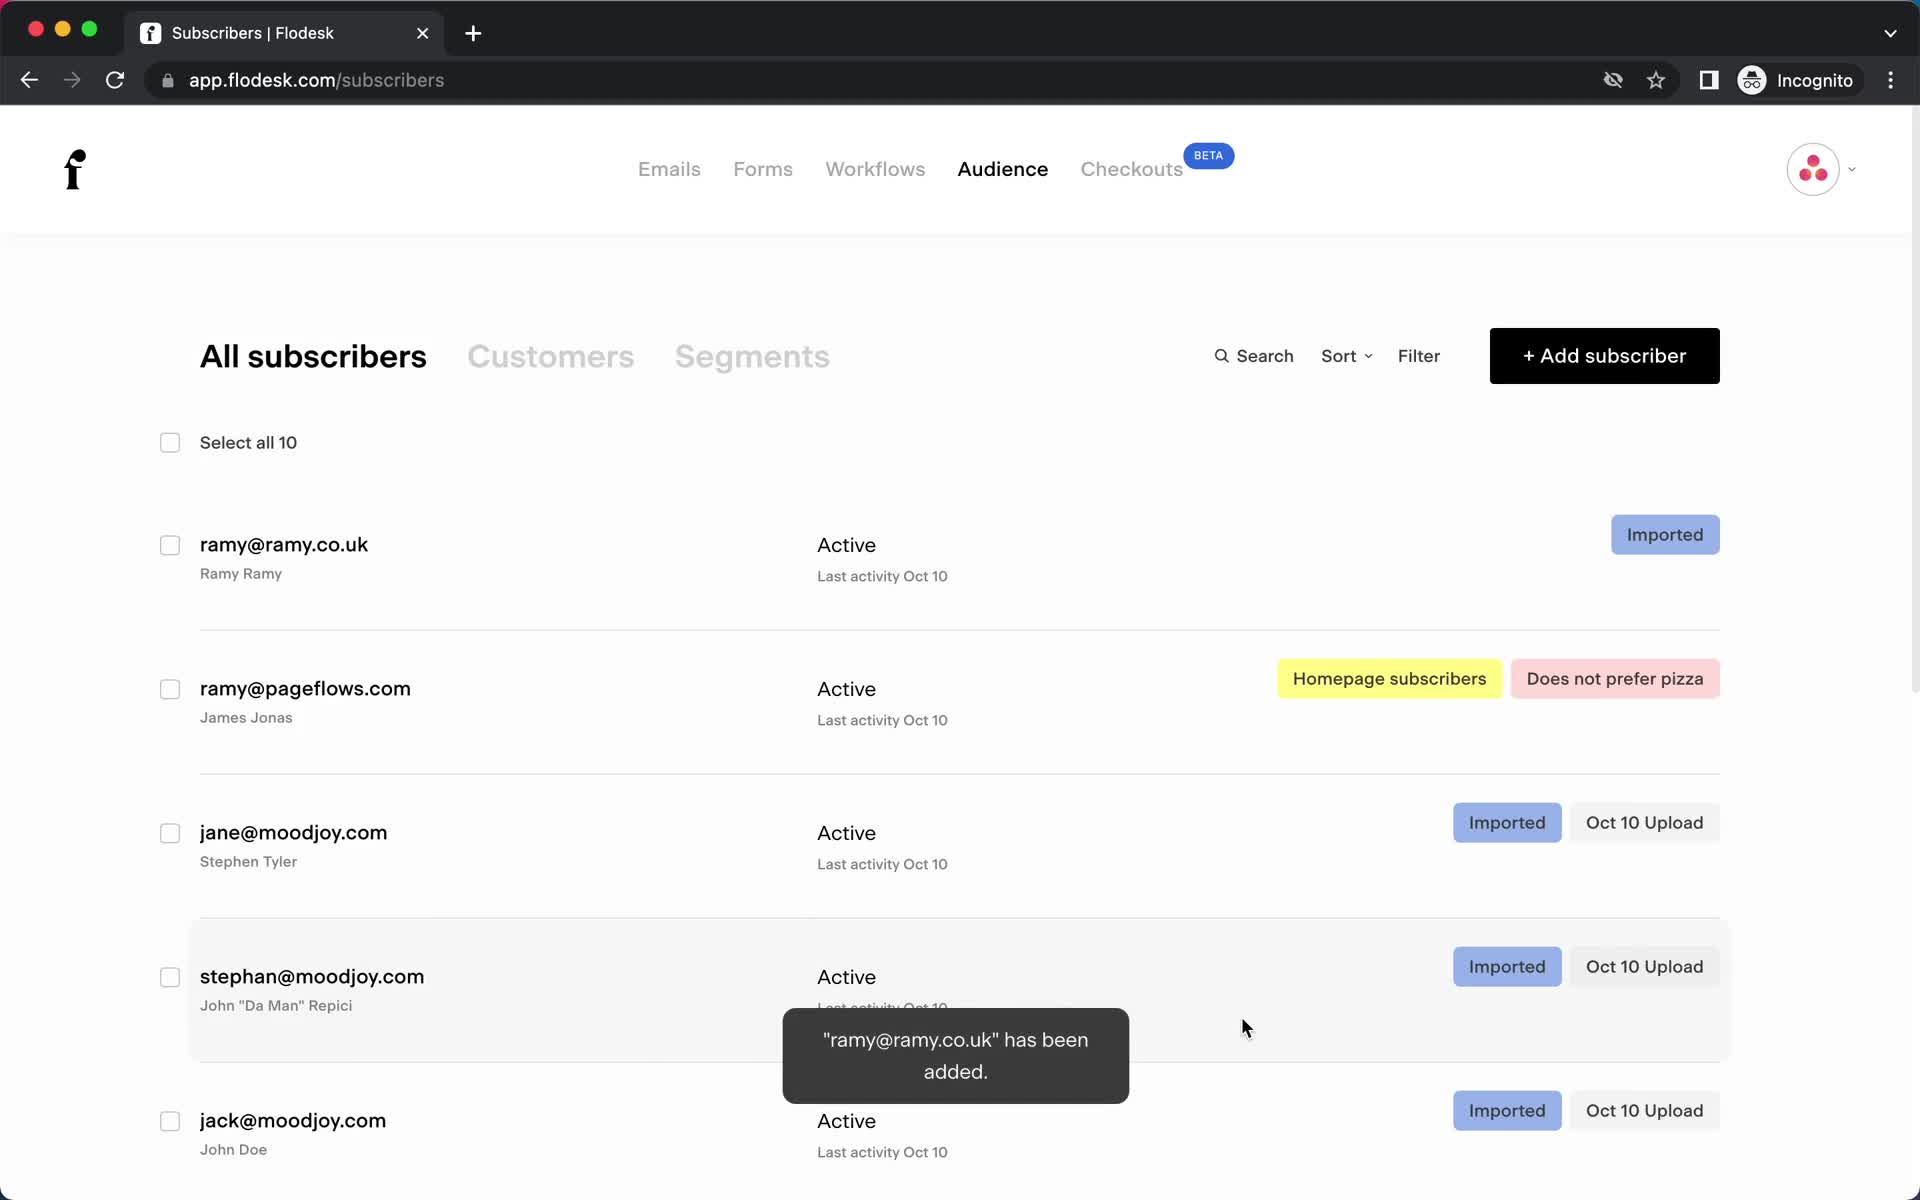
Changes saved
this is title
Confirm change
this is title
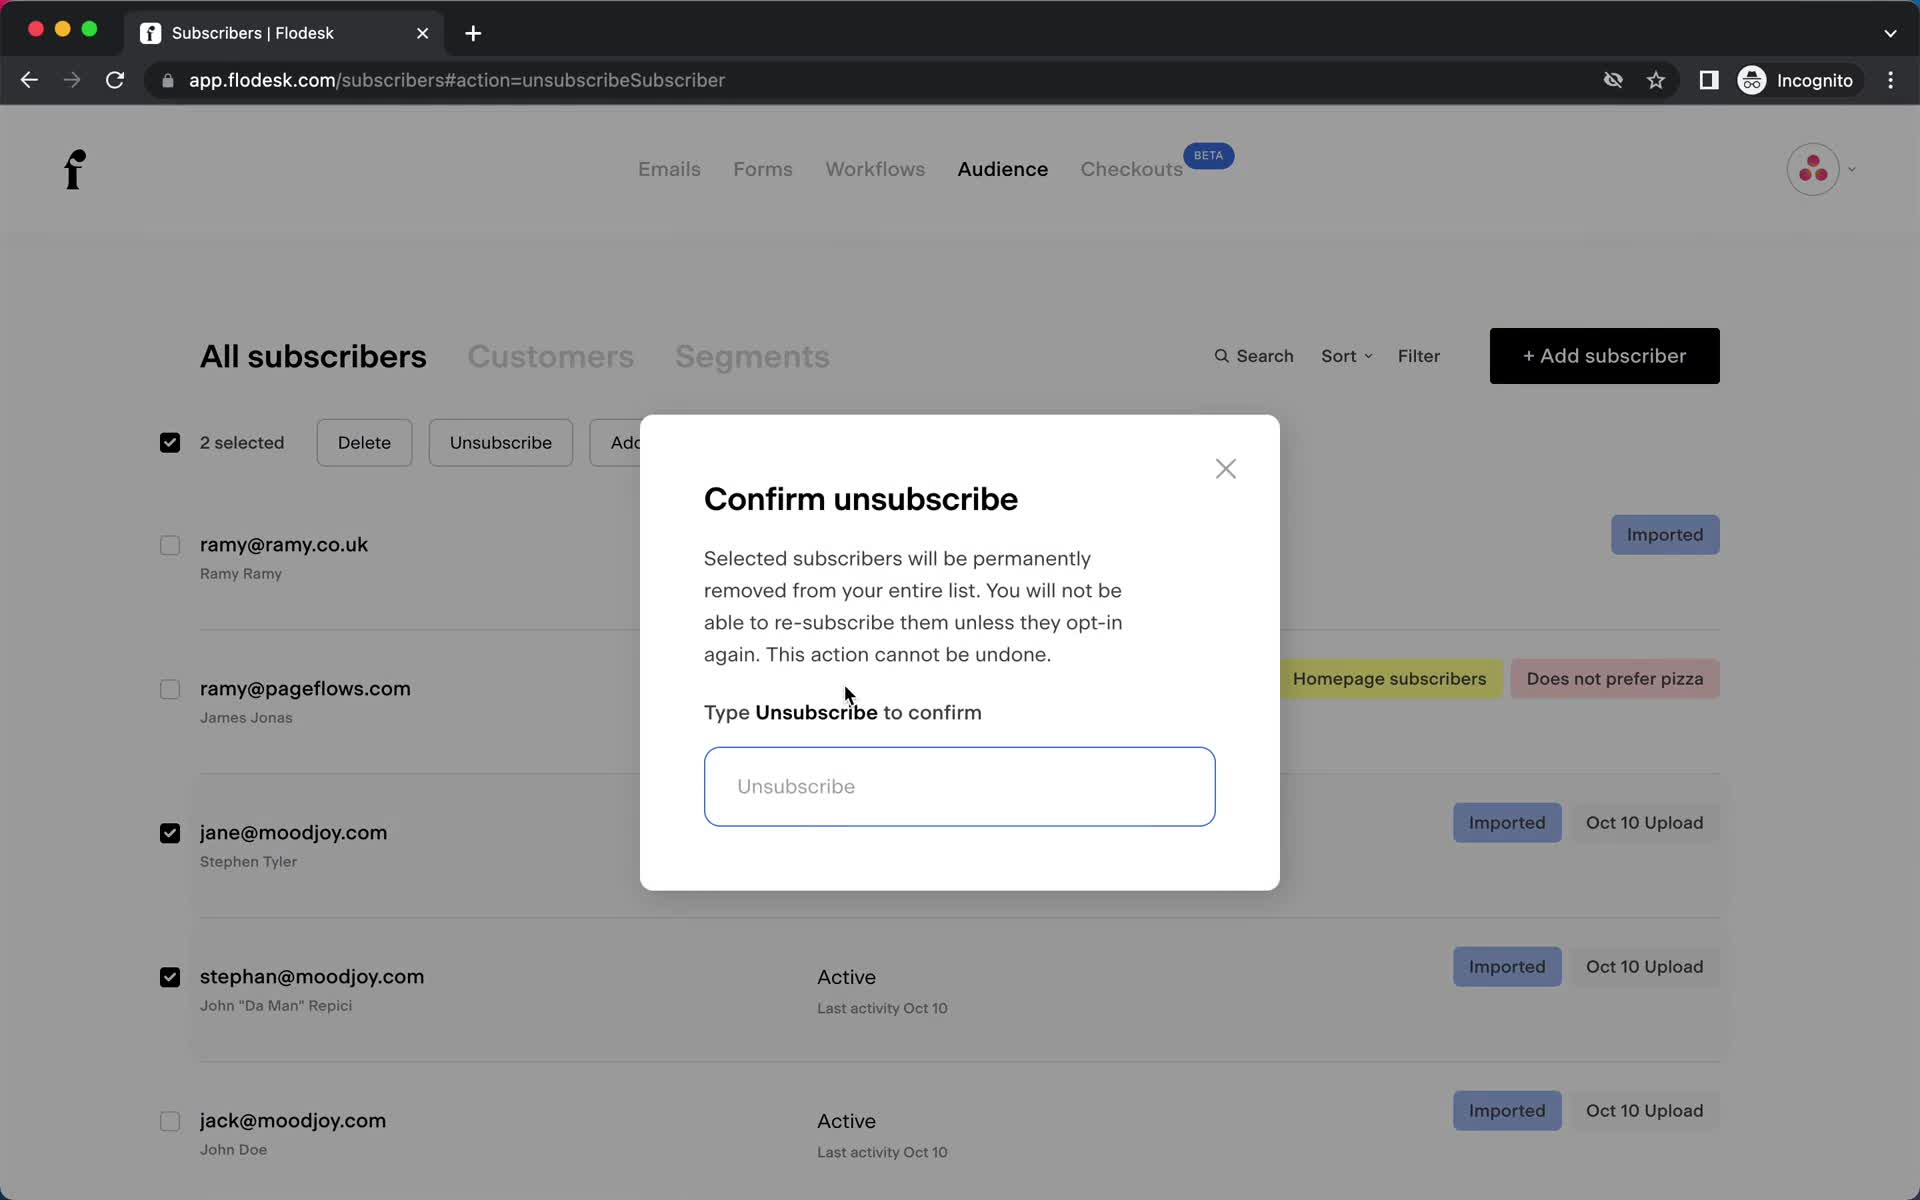
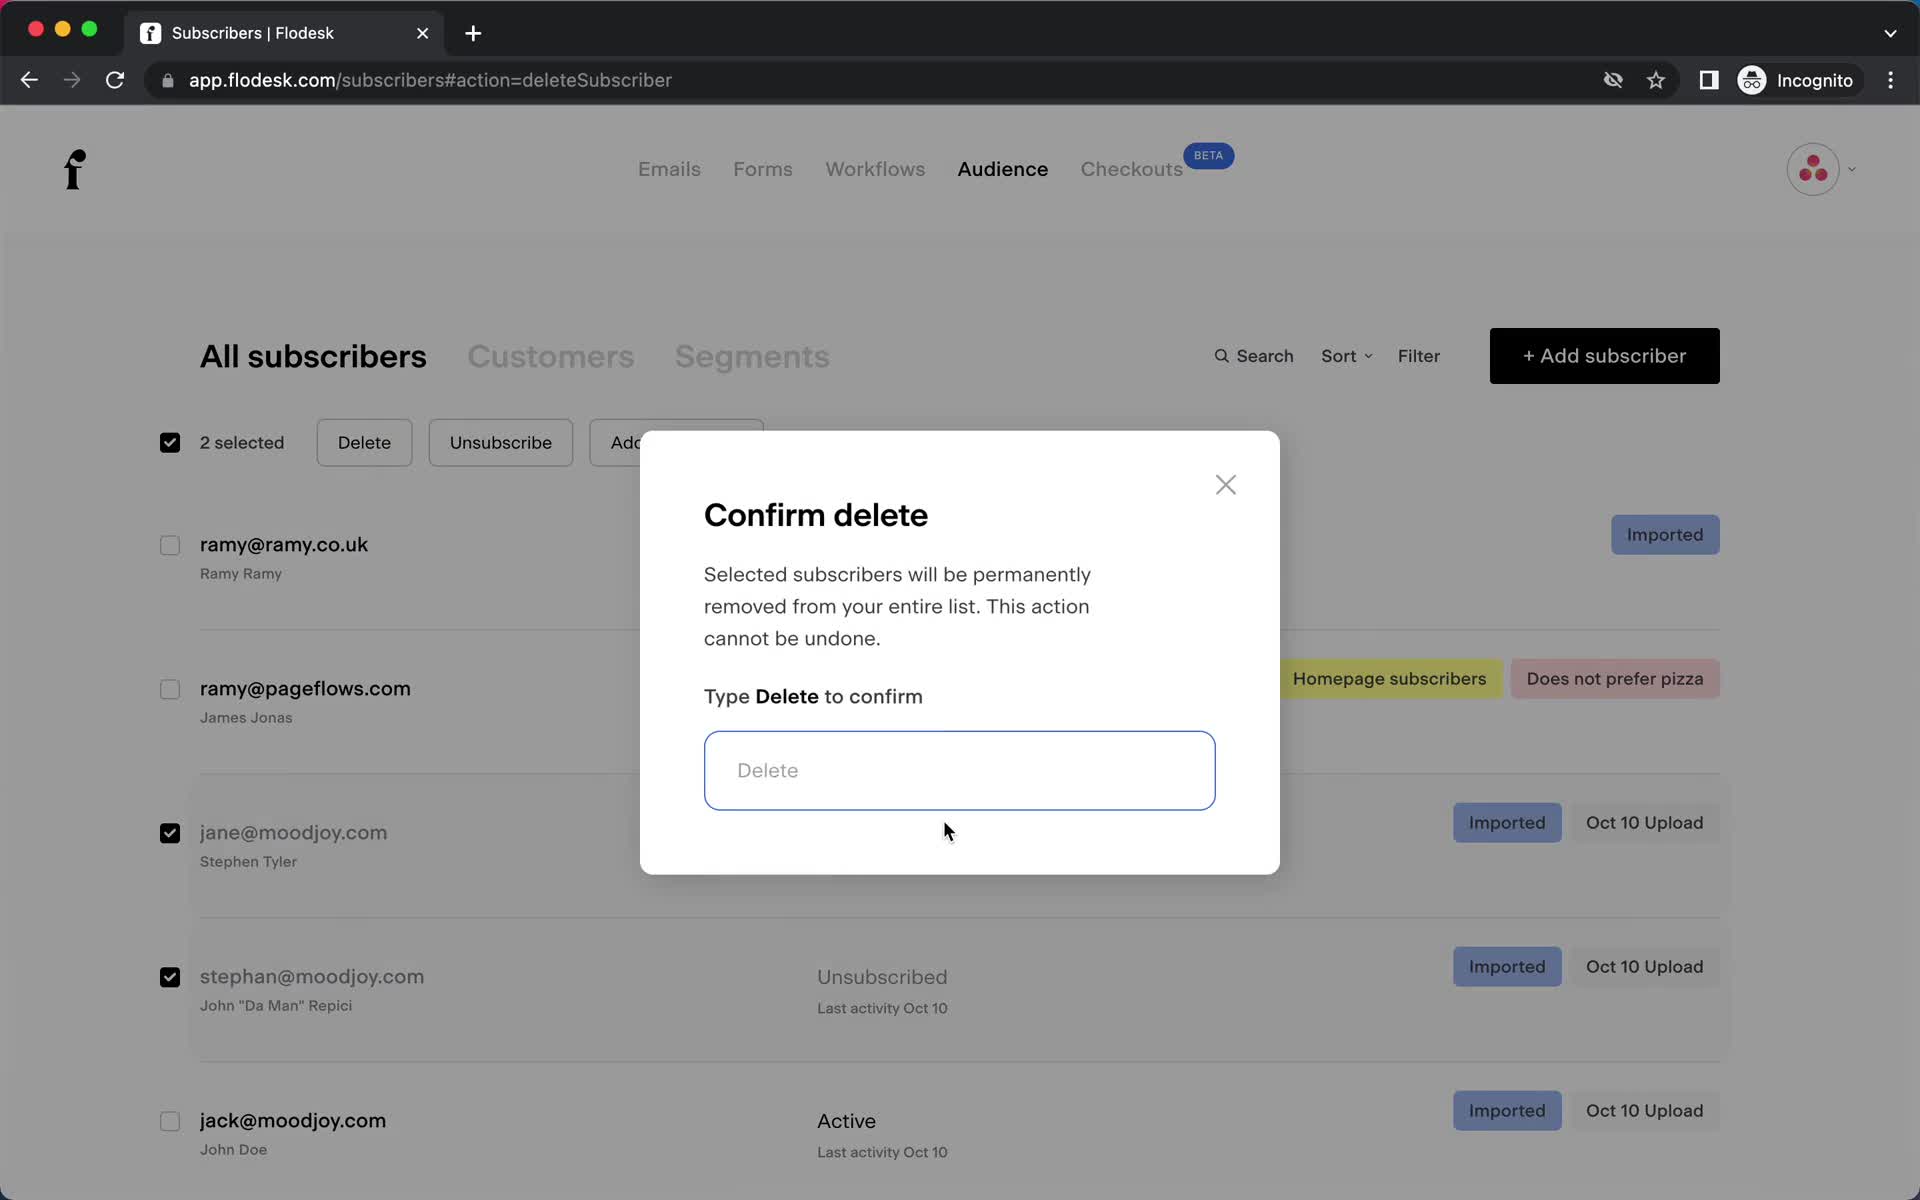
Confirm delete
this is title
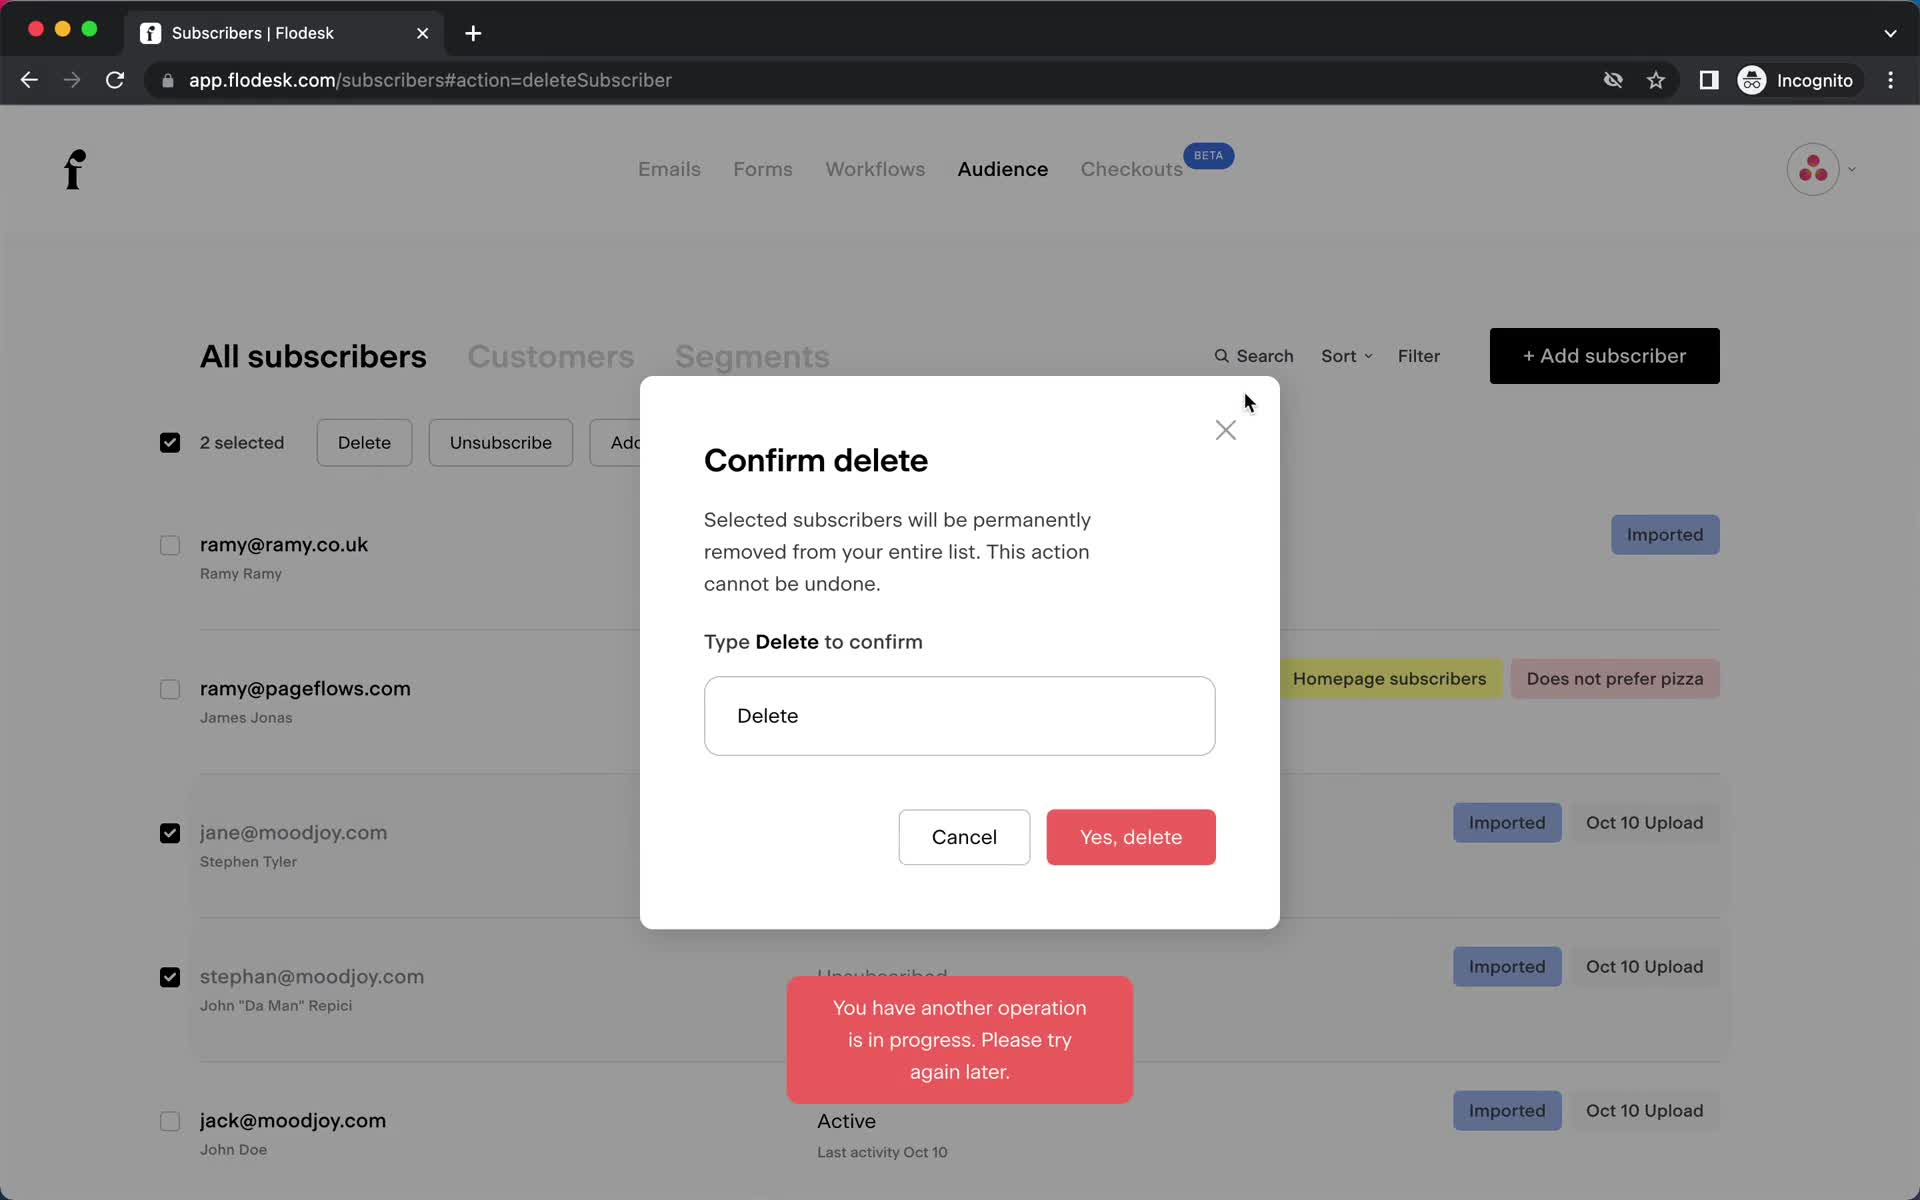
Error
this is title
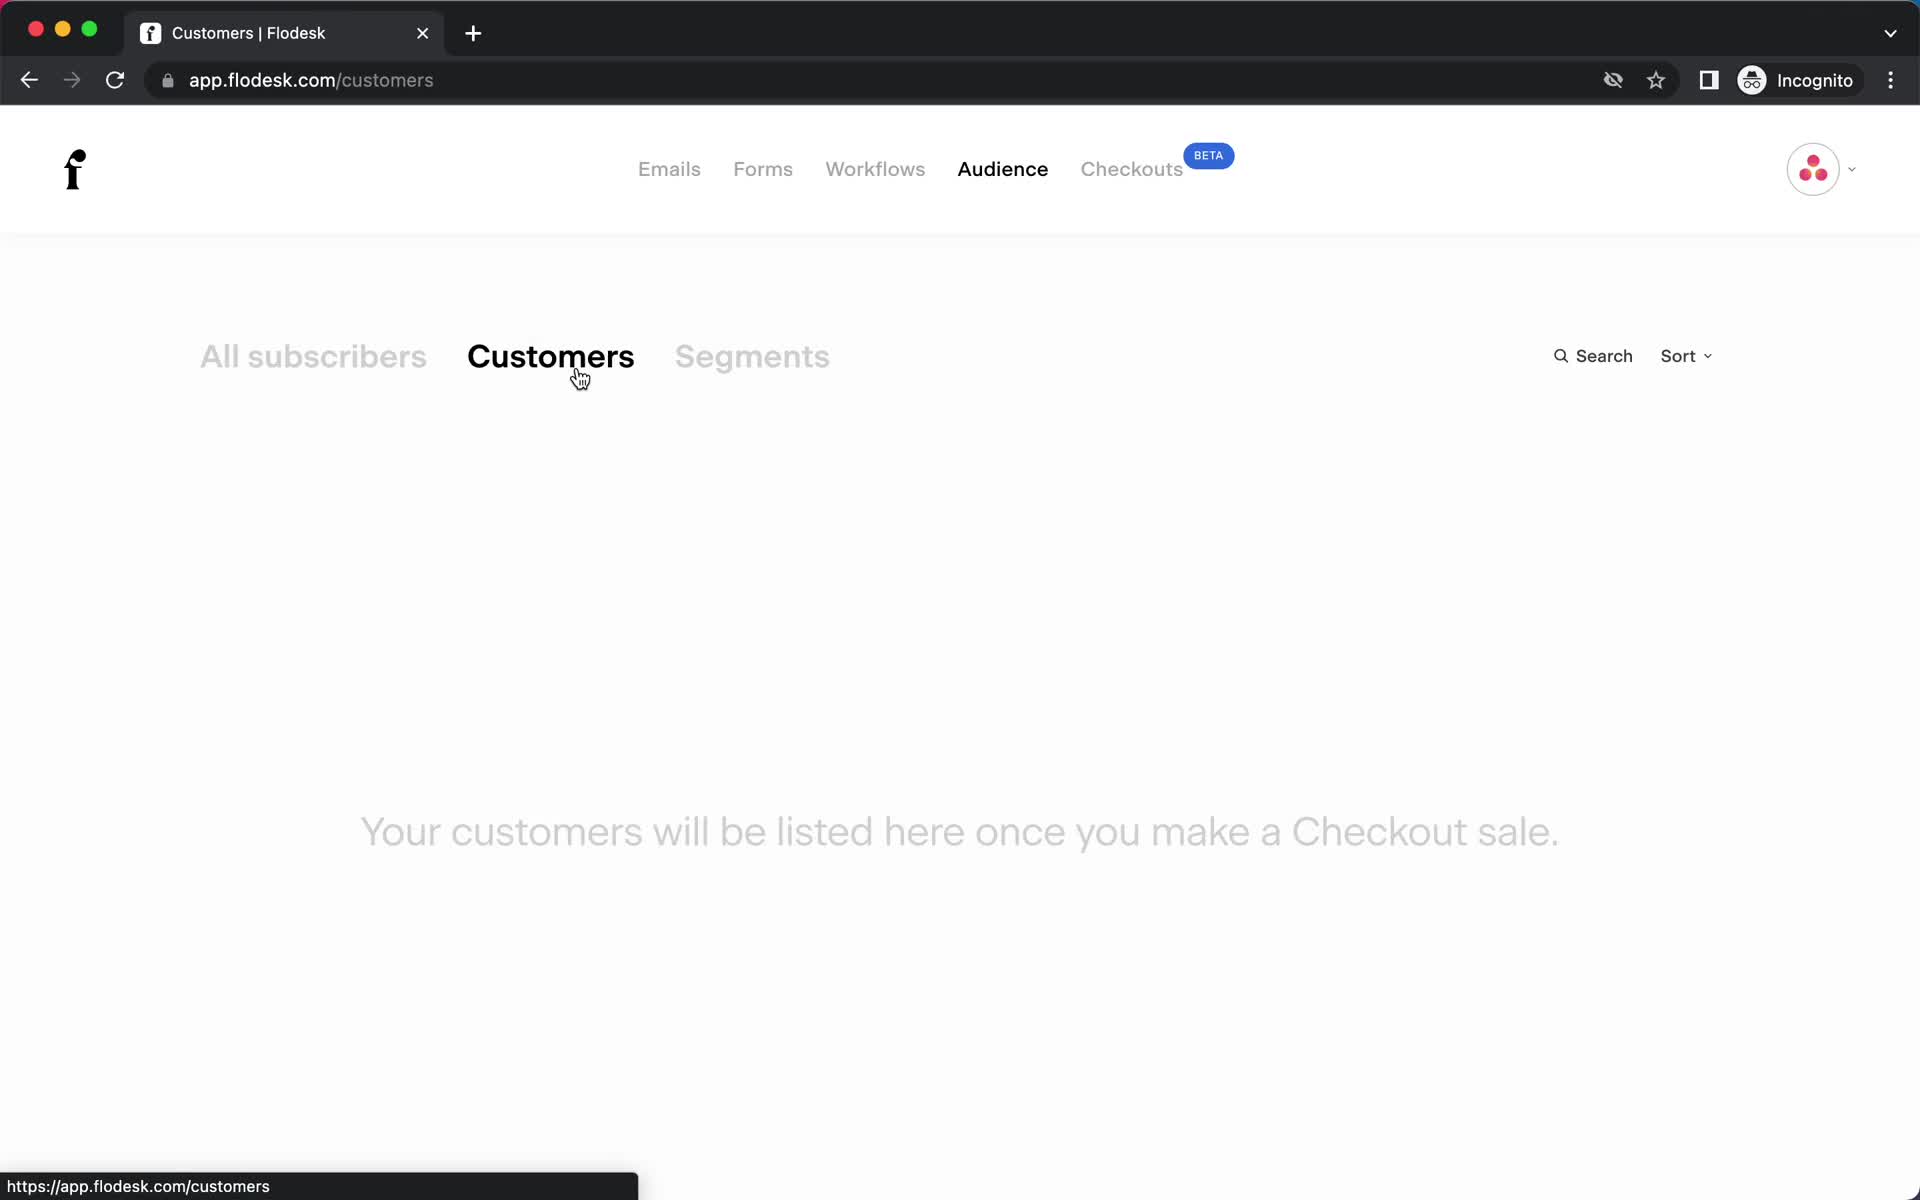
Customers
this is title
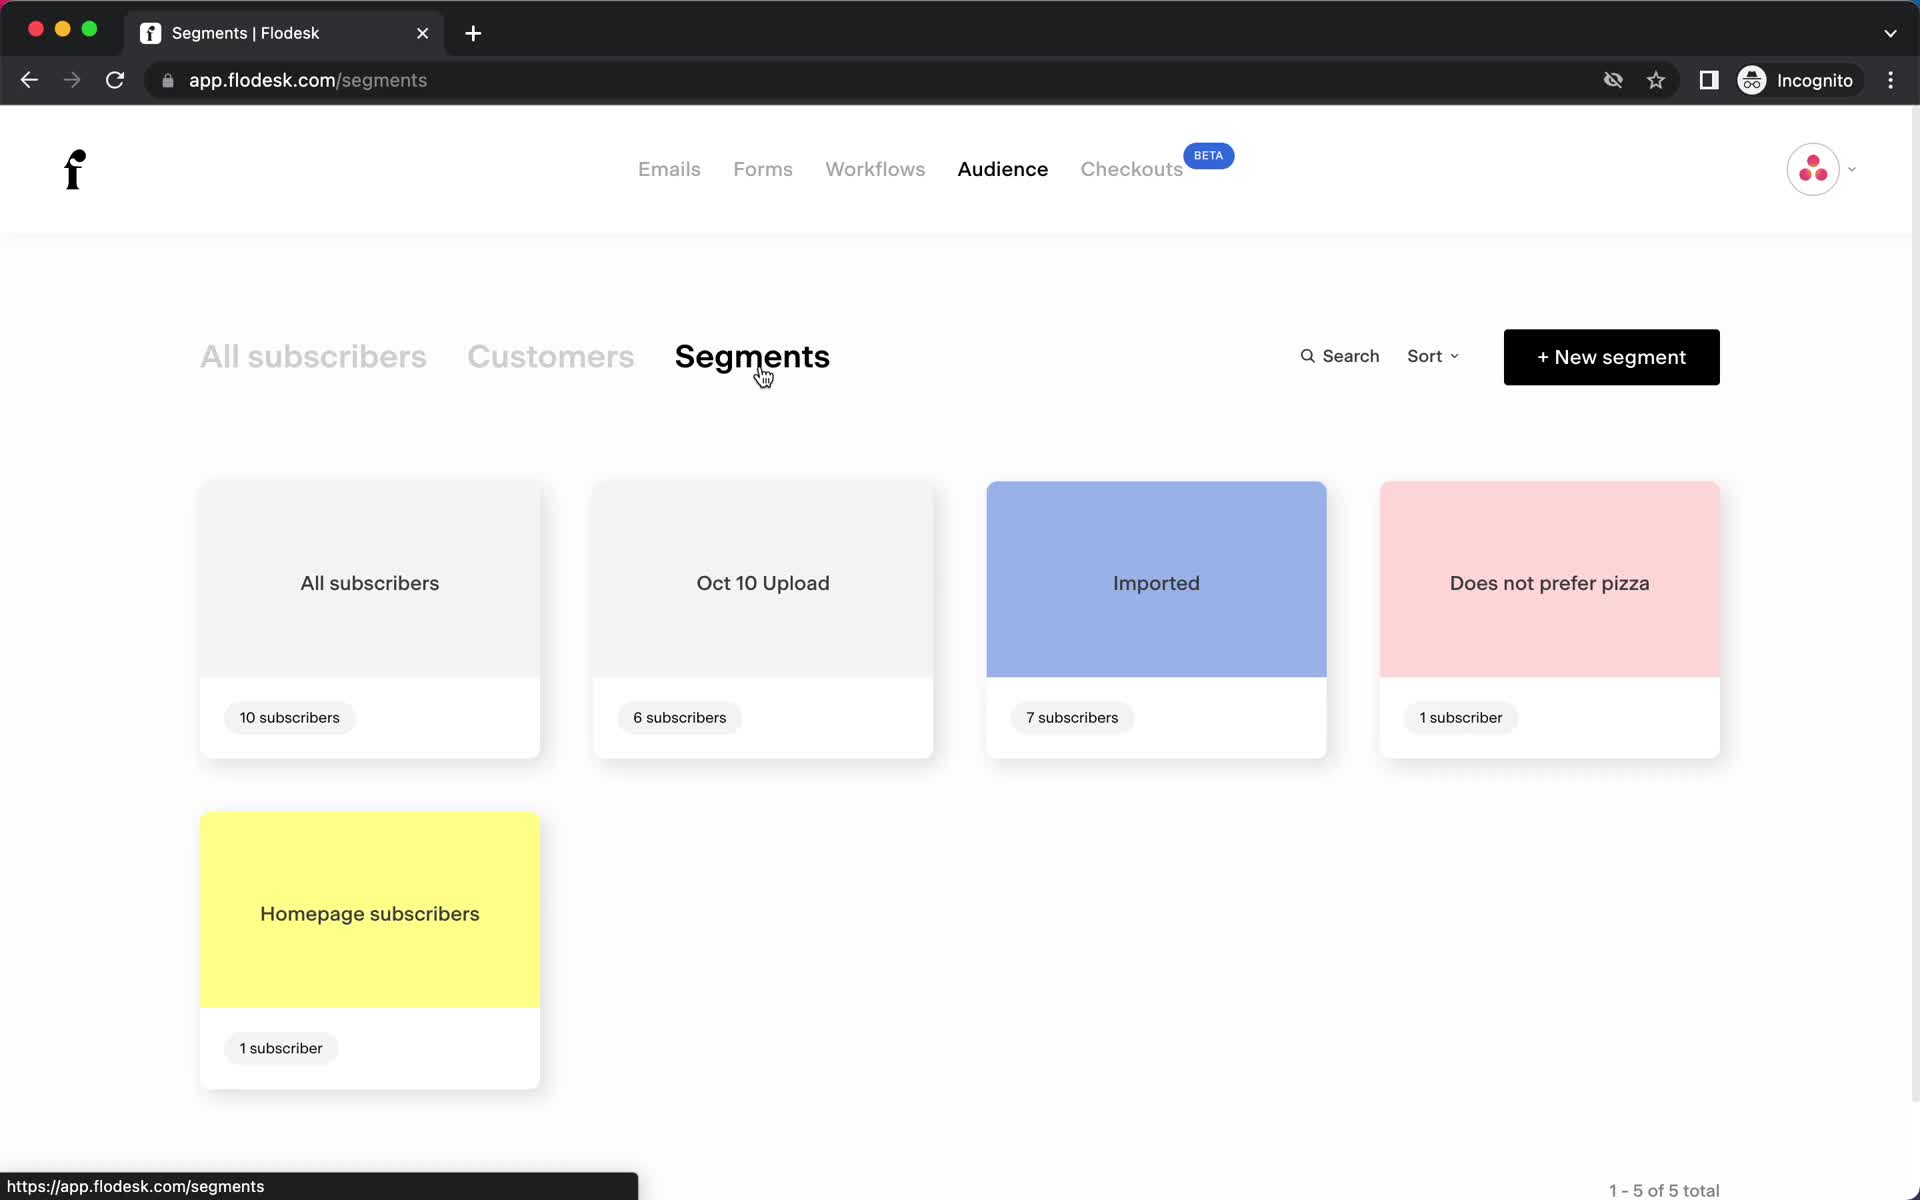
Segments
this is title
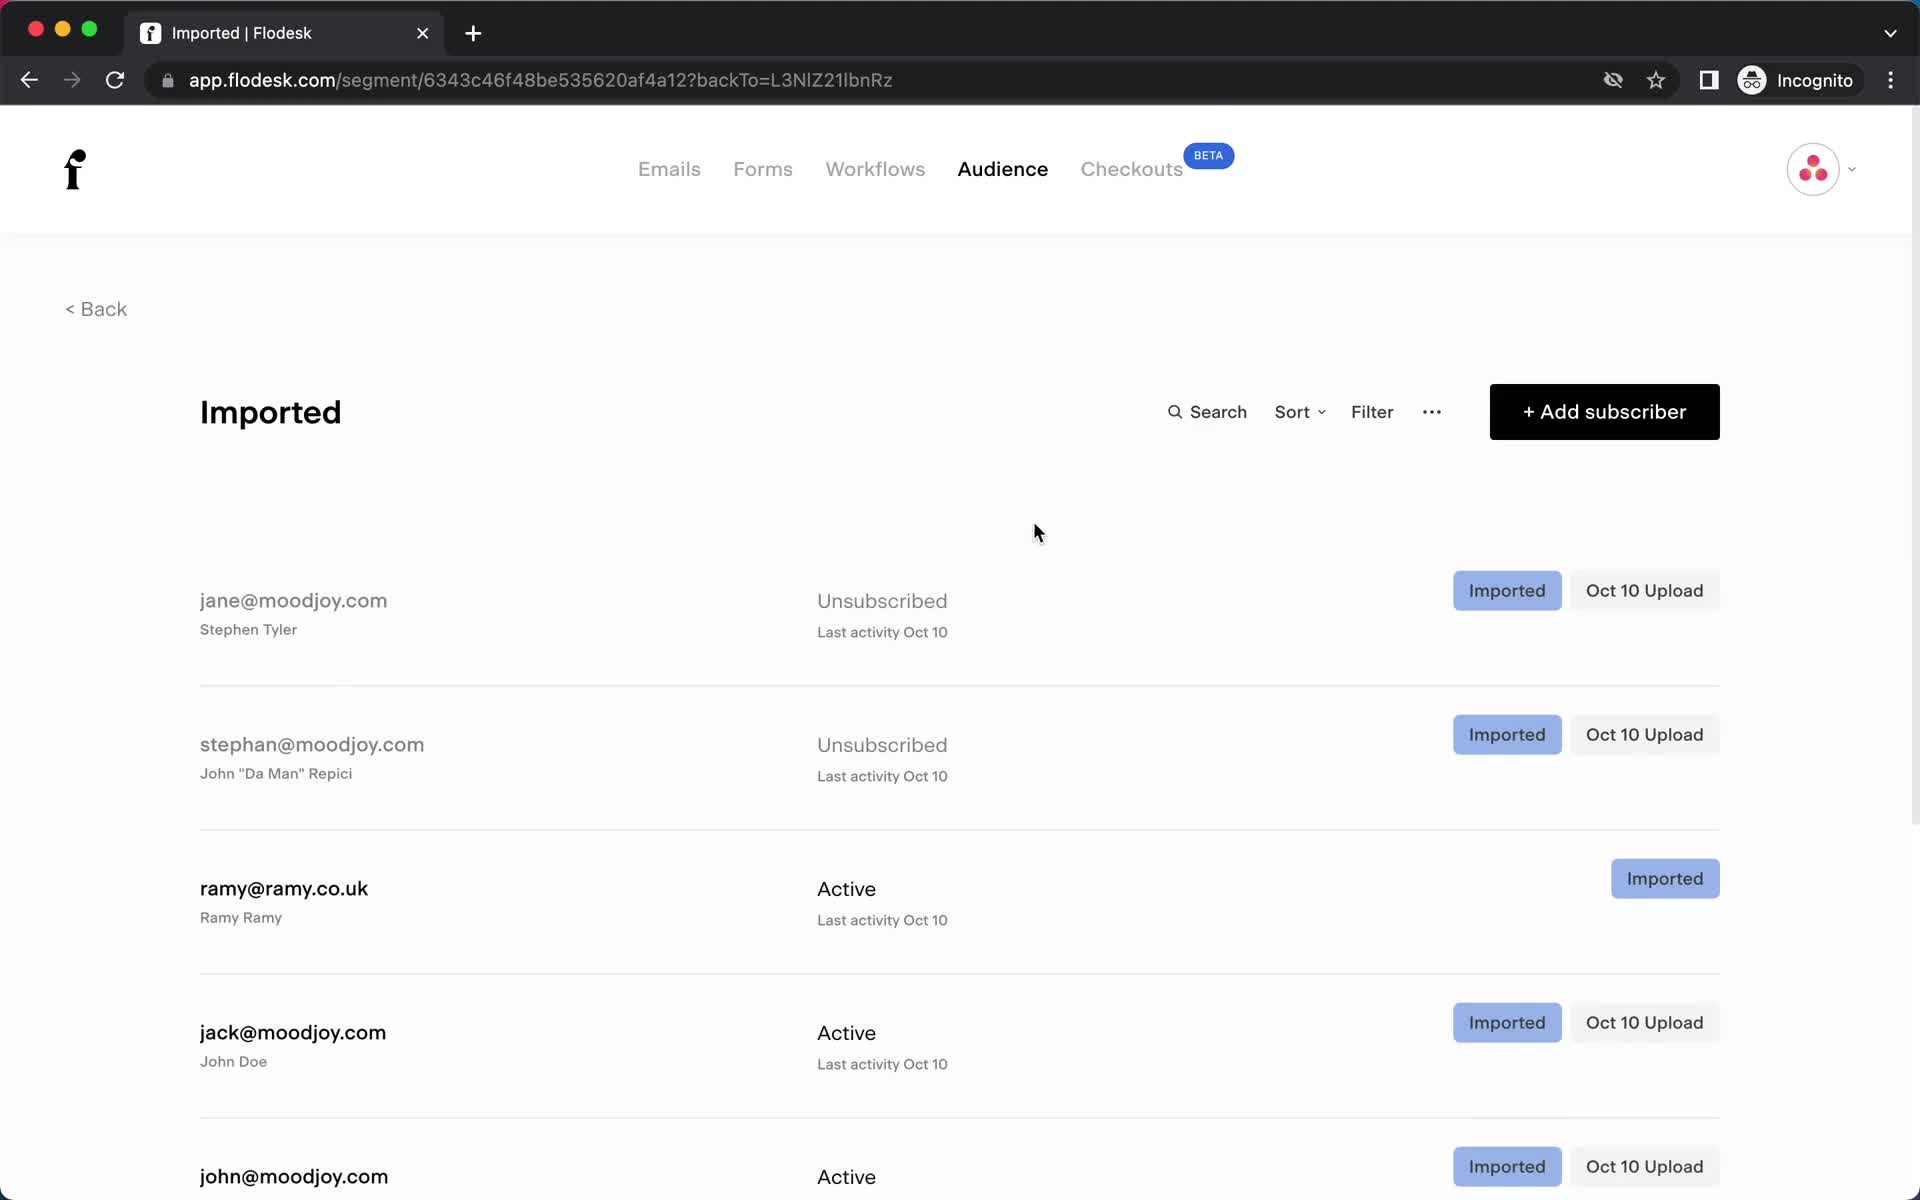
Segment
this is title
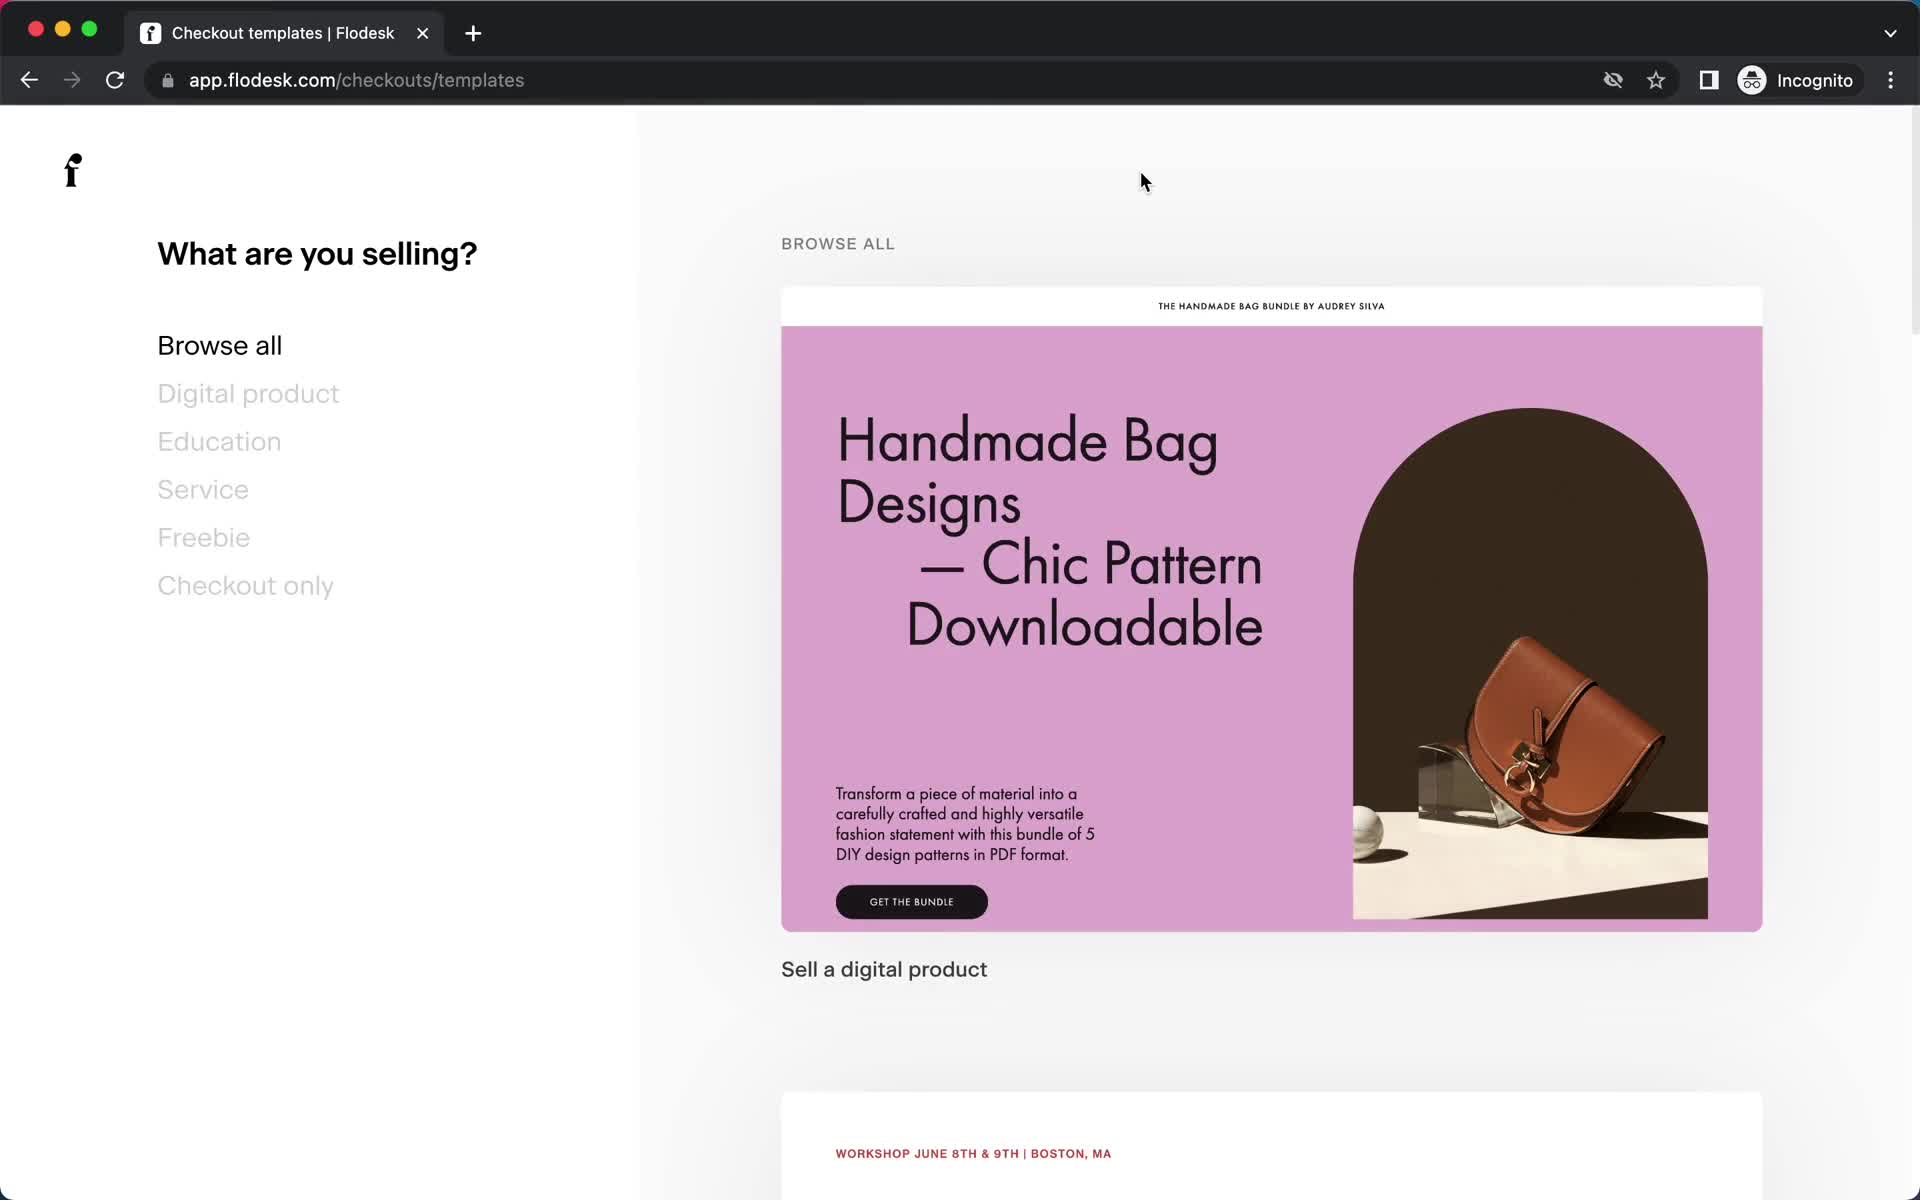
Create checkout
this is title
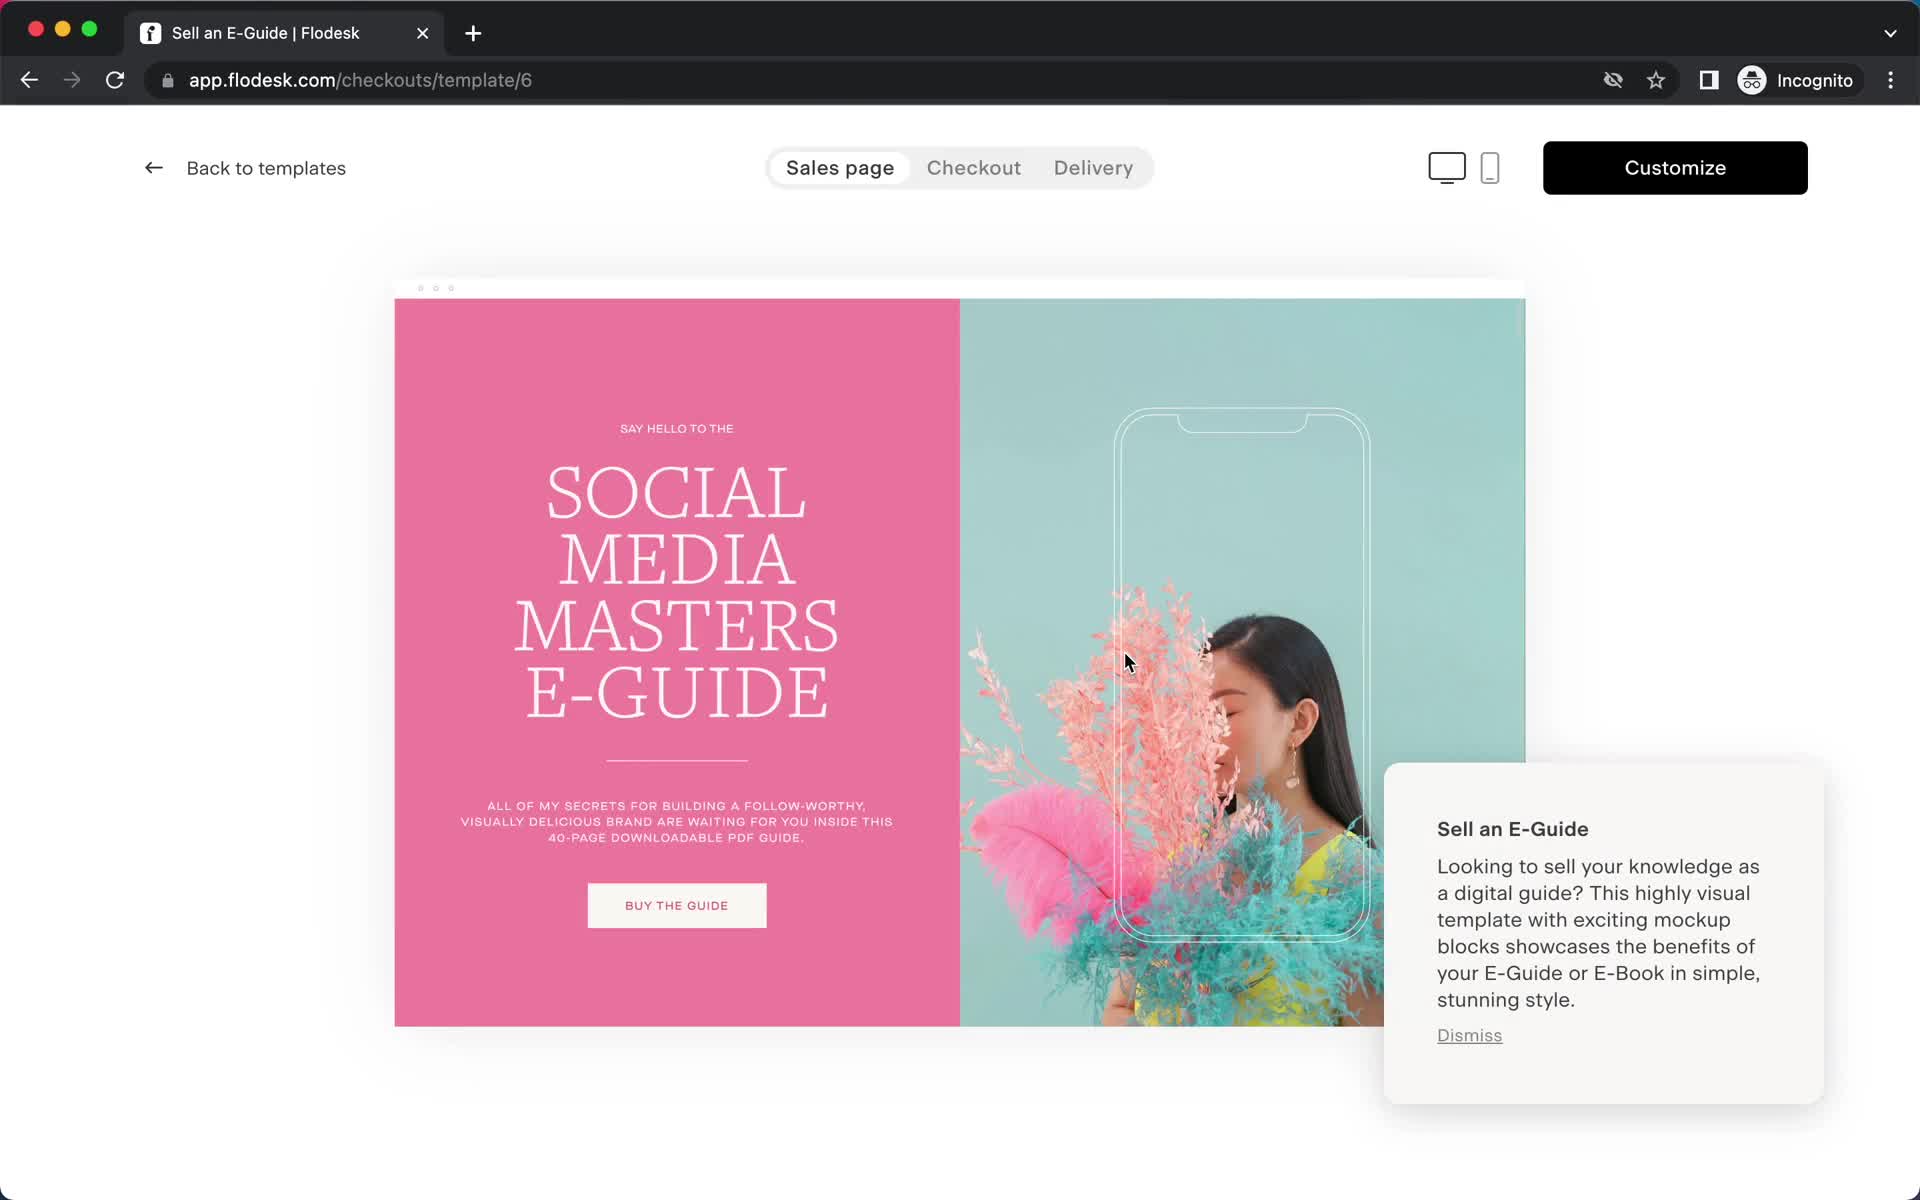
Guide popover
this is title
Guide tooltip
this is title
Editor
this is title
Select image
this is title
Editor
this is title
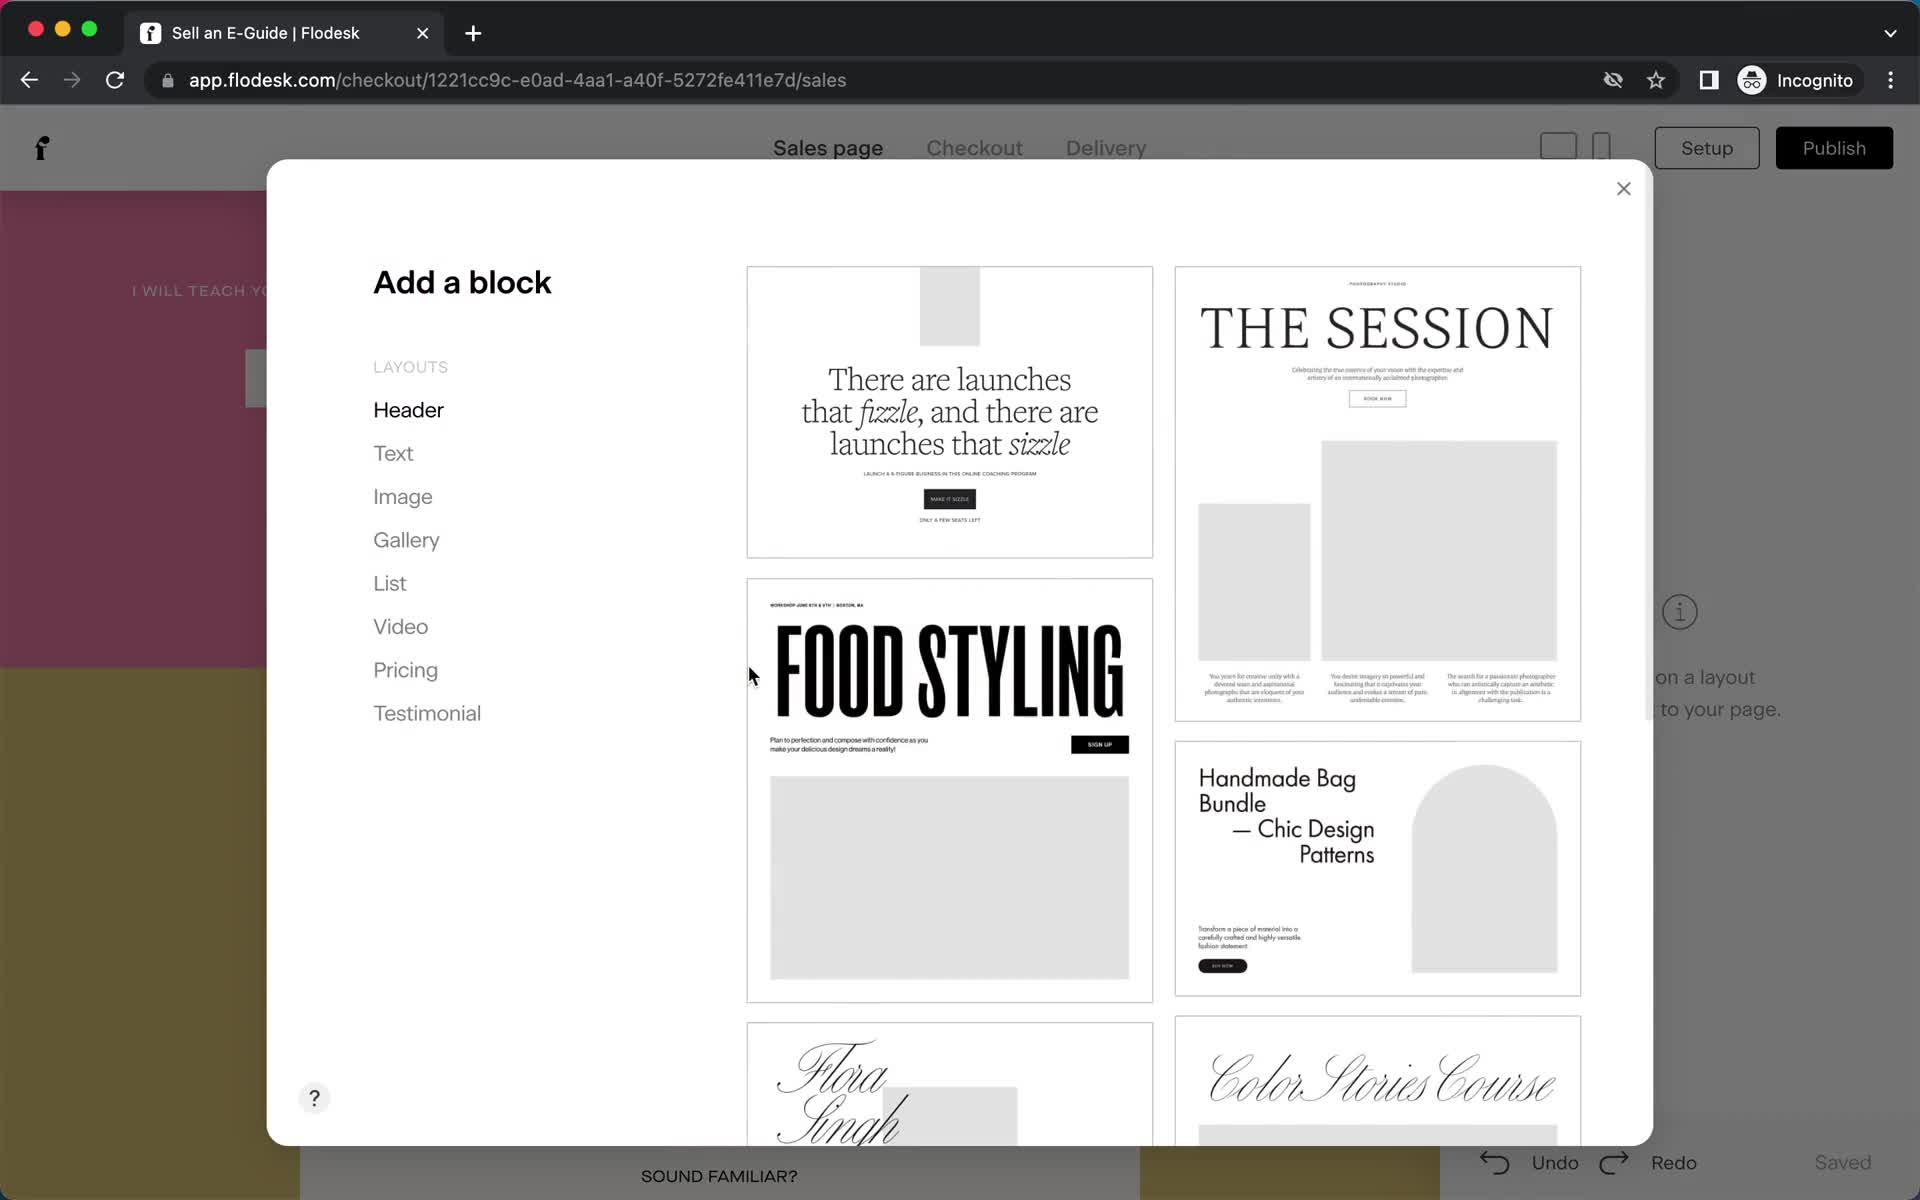
Add block
this is title
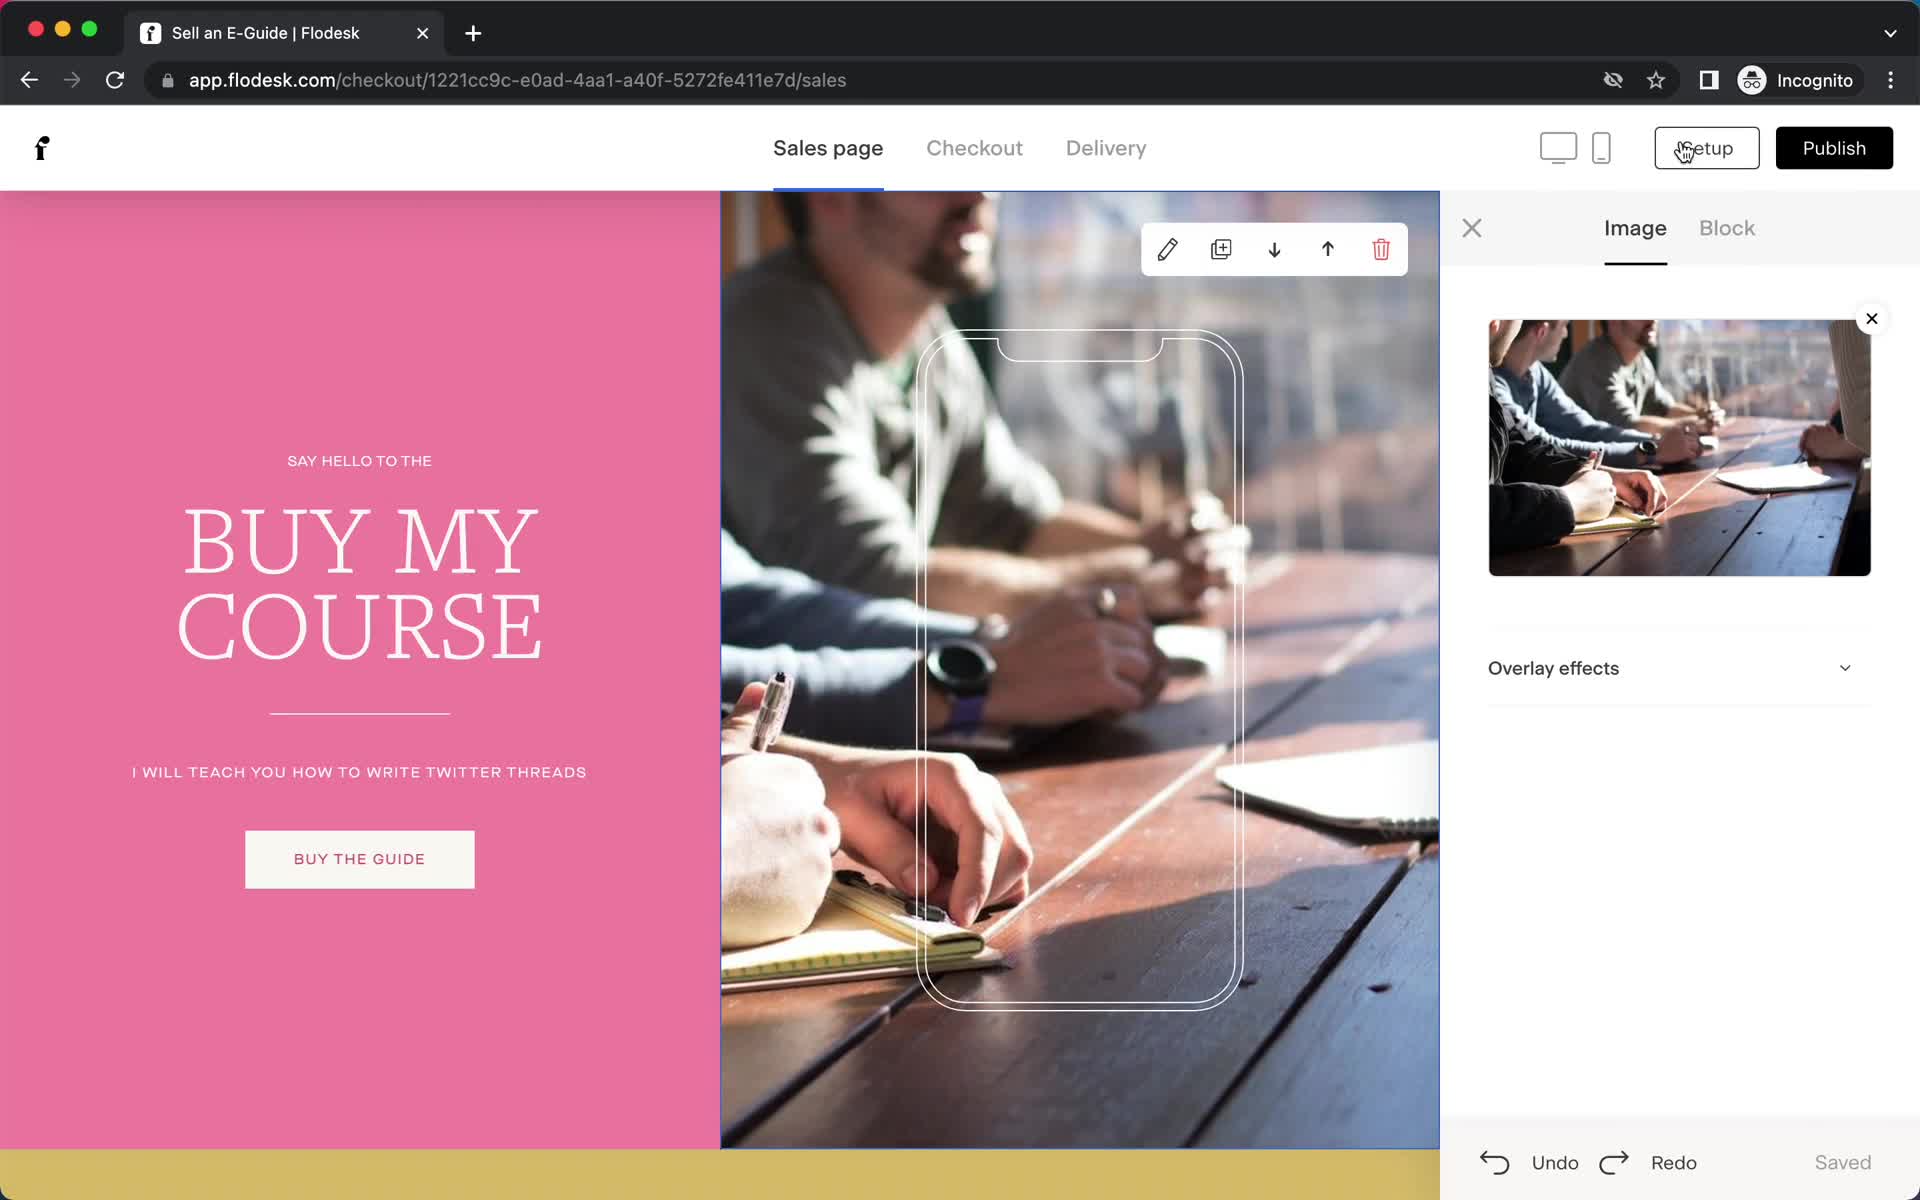
Editor
this is title
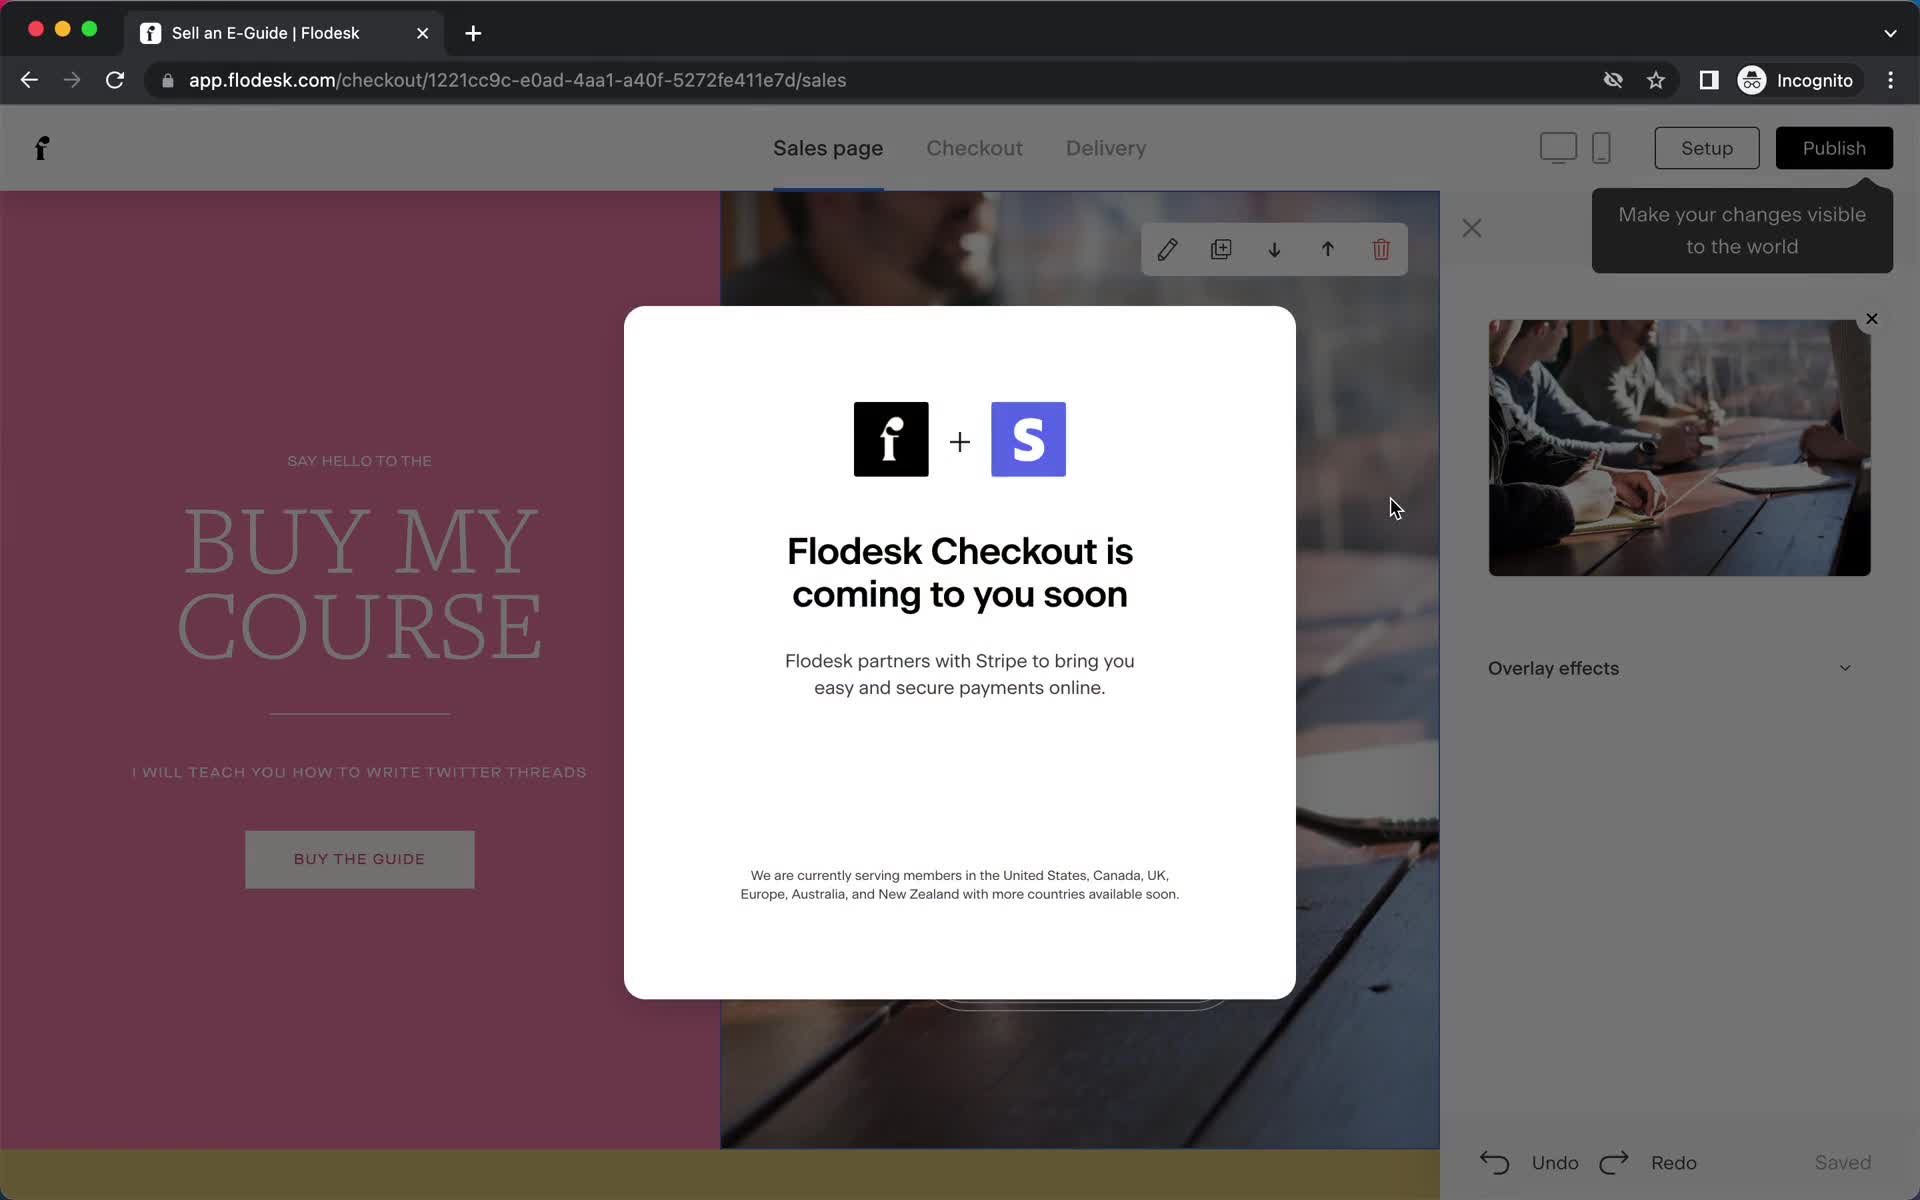
Coming soon
this is title
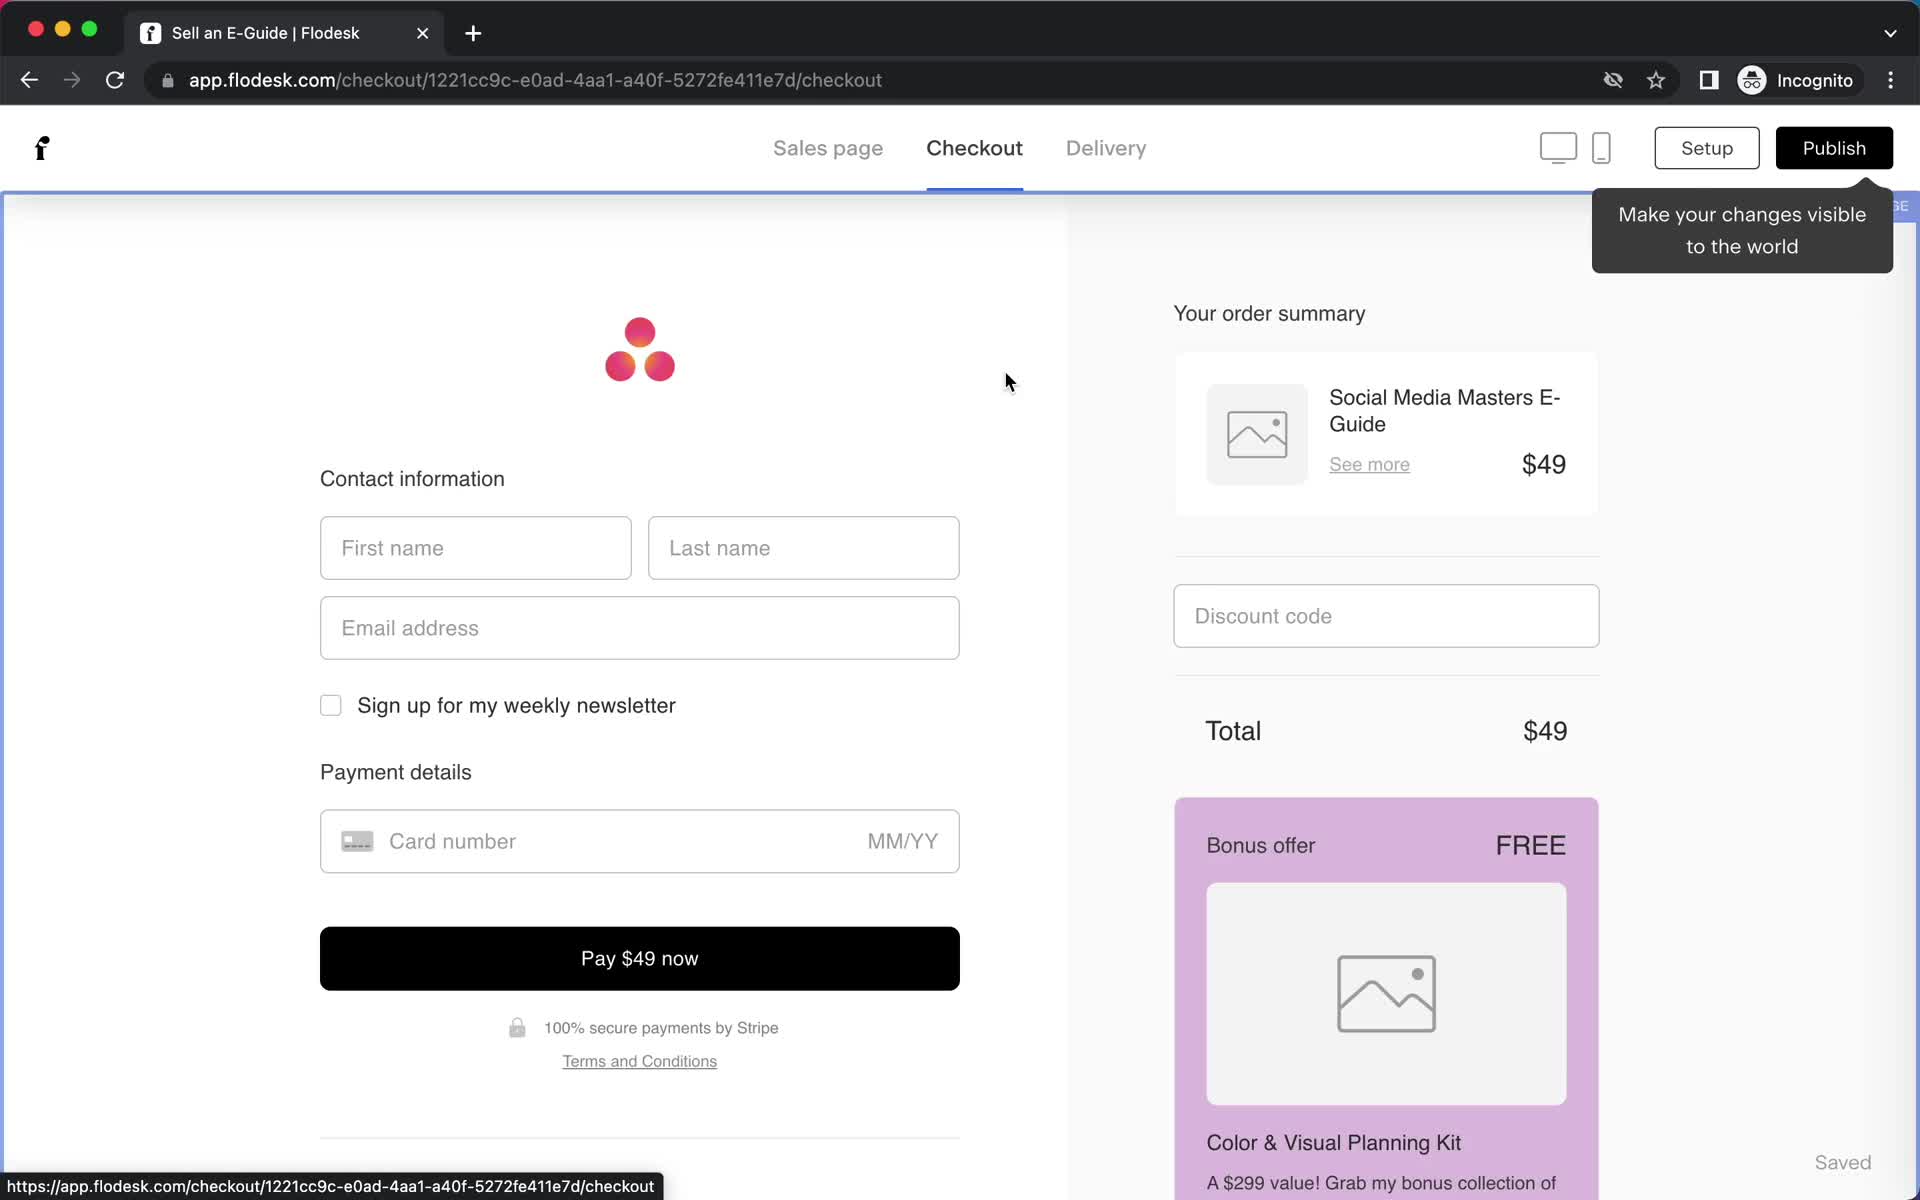
Checkout setup
this is title
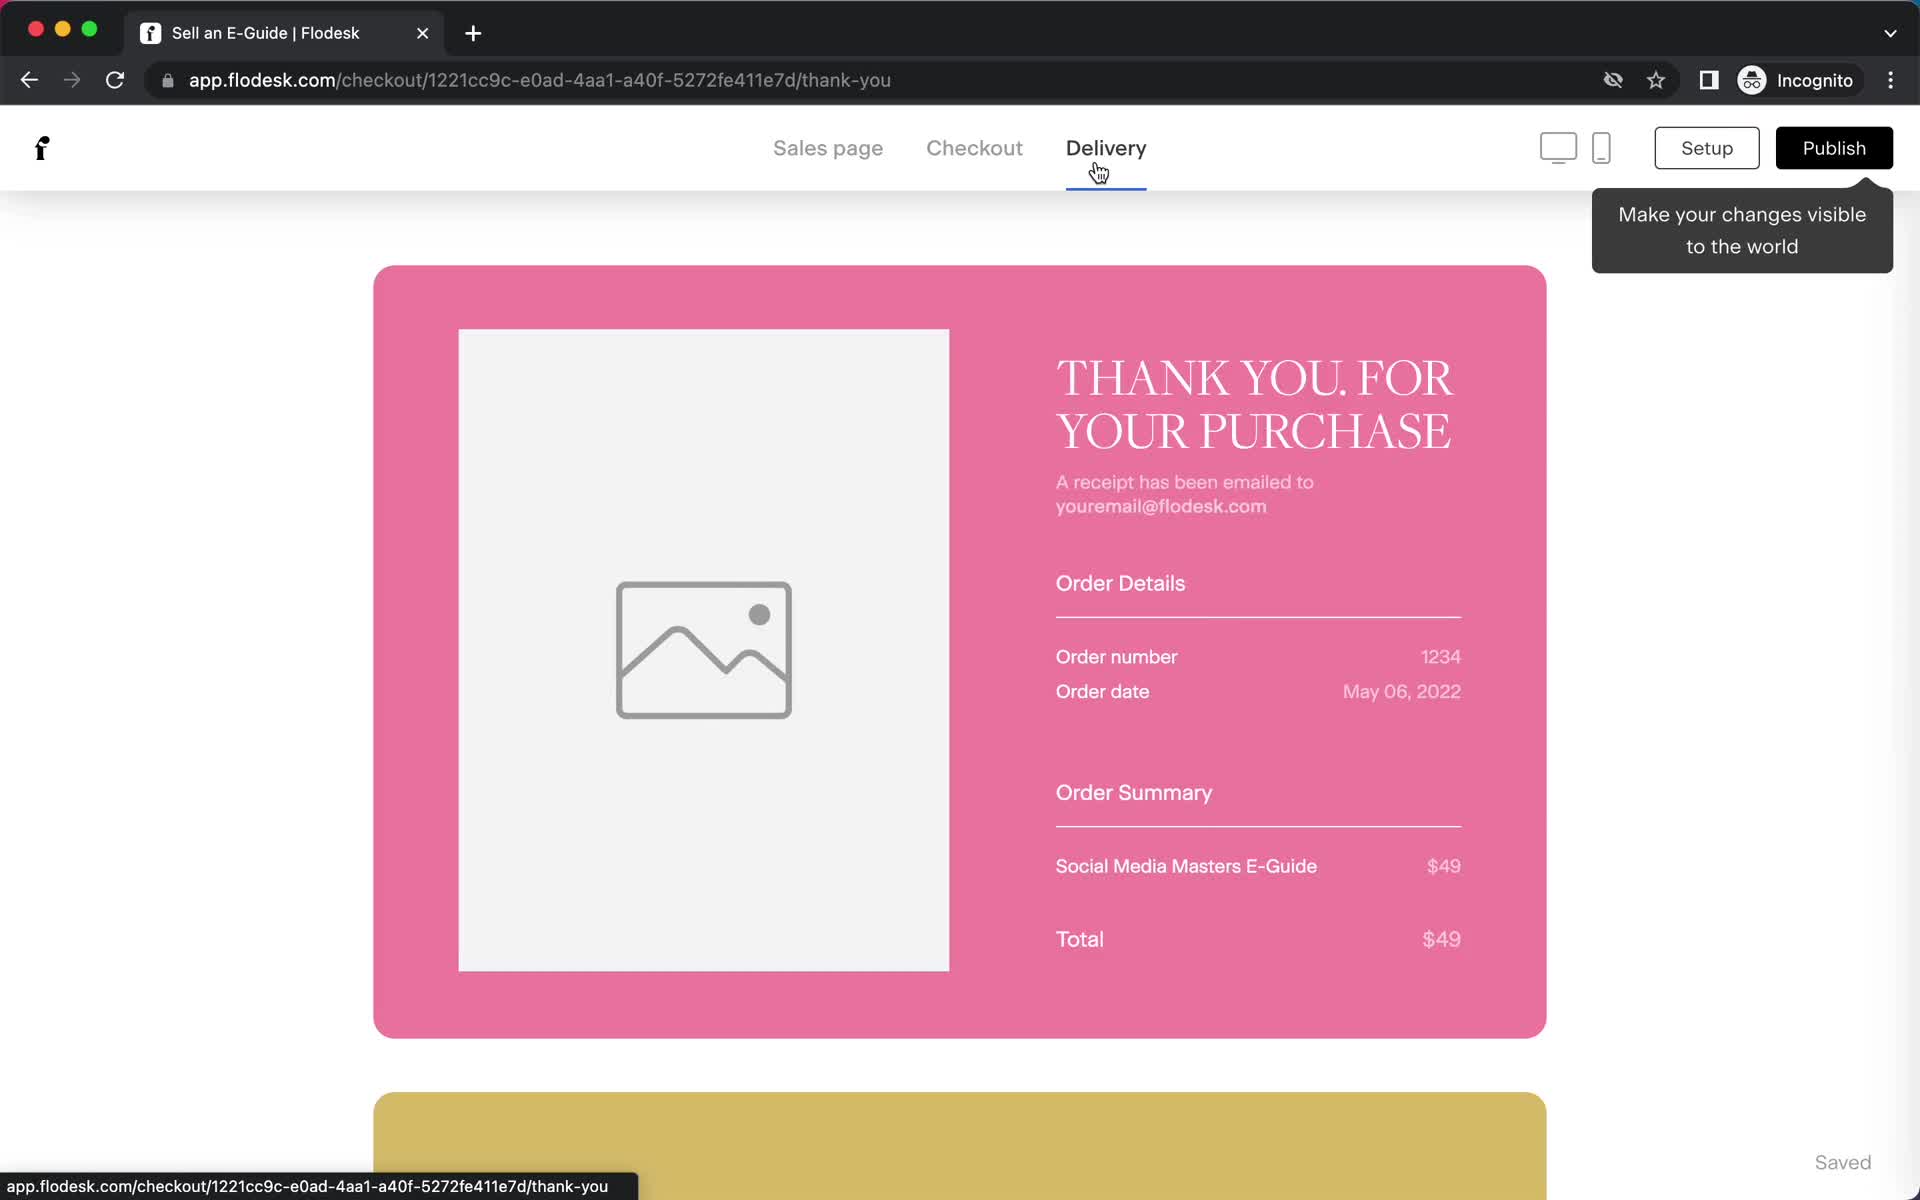
Delivery details
this is title
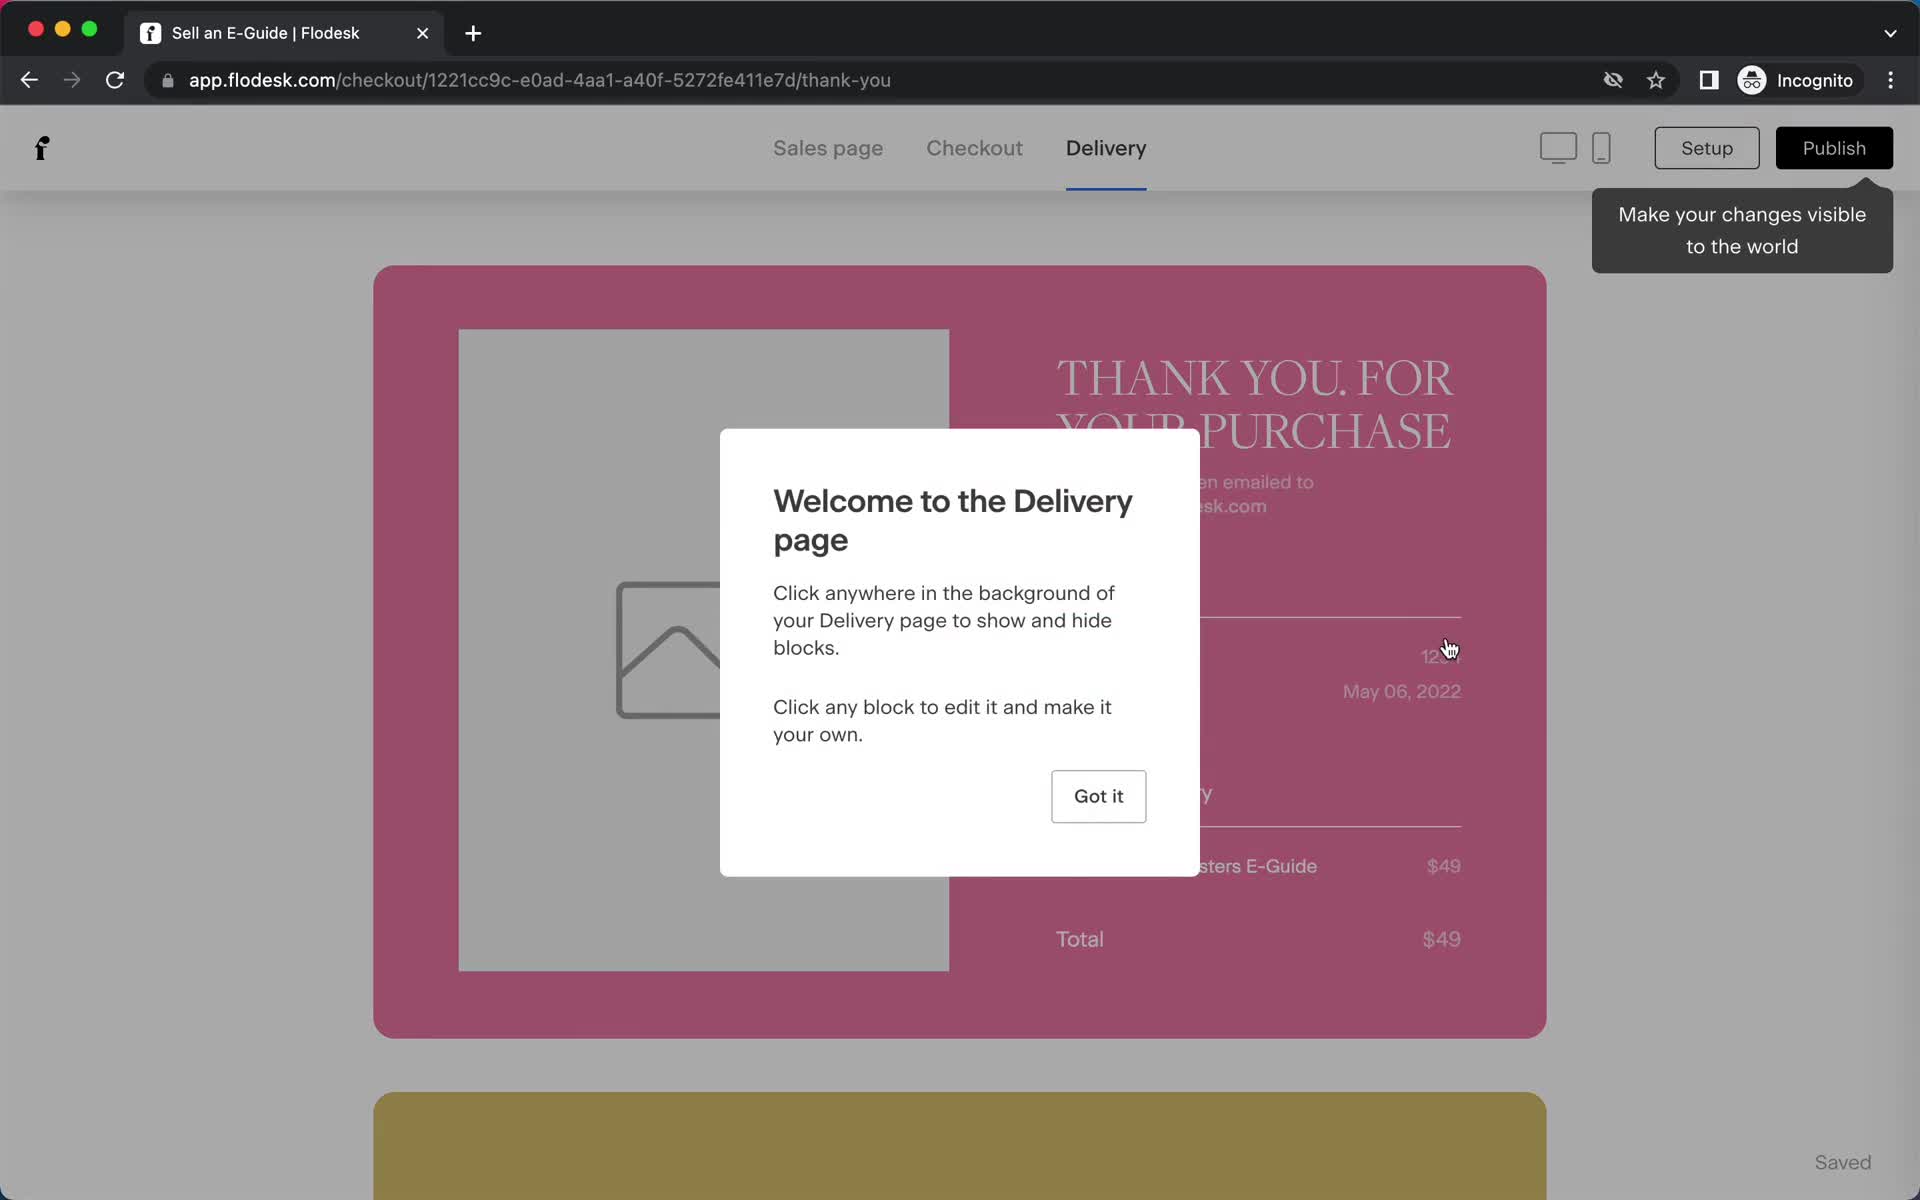
Guide modal
this is title
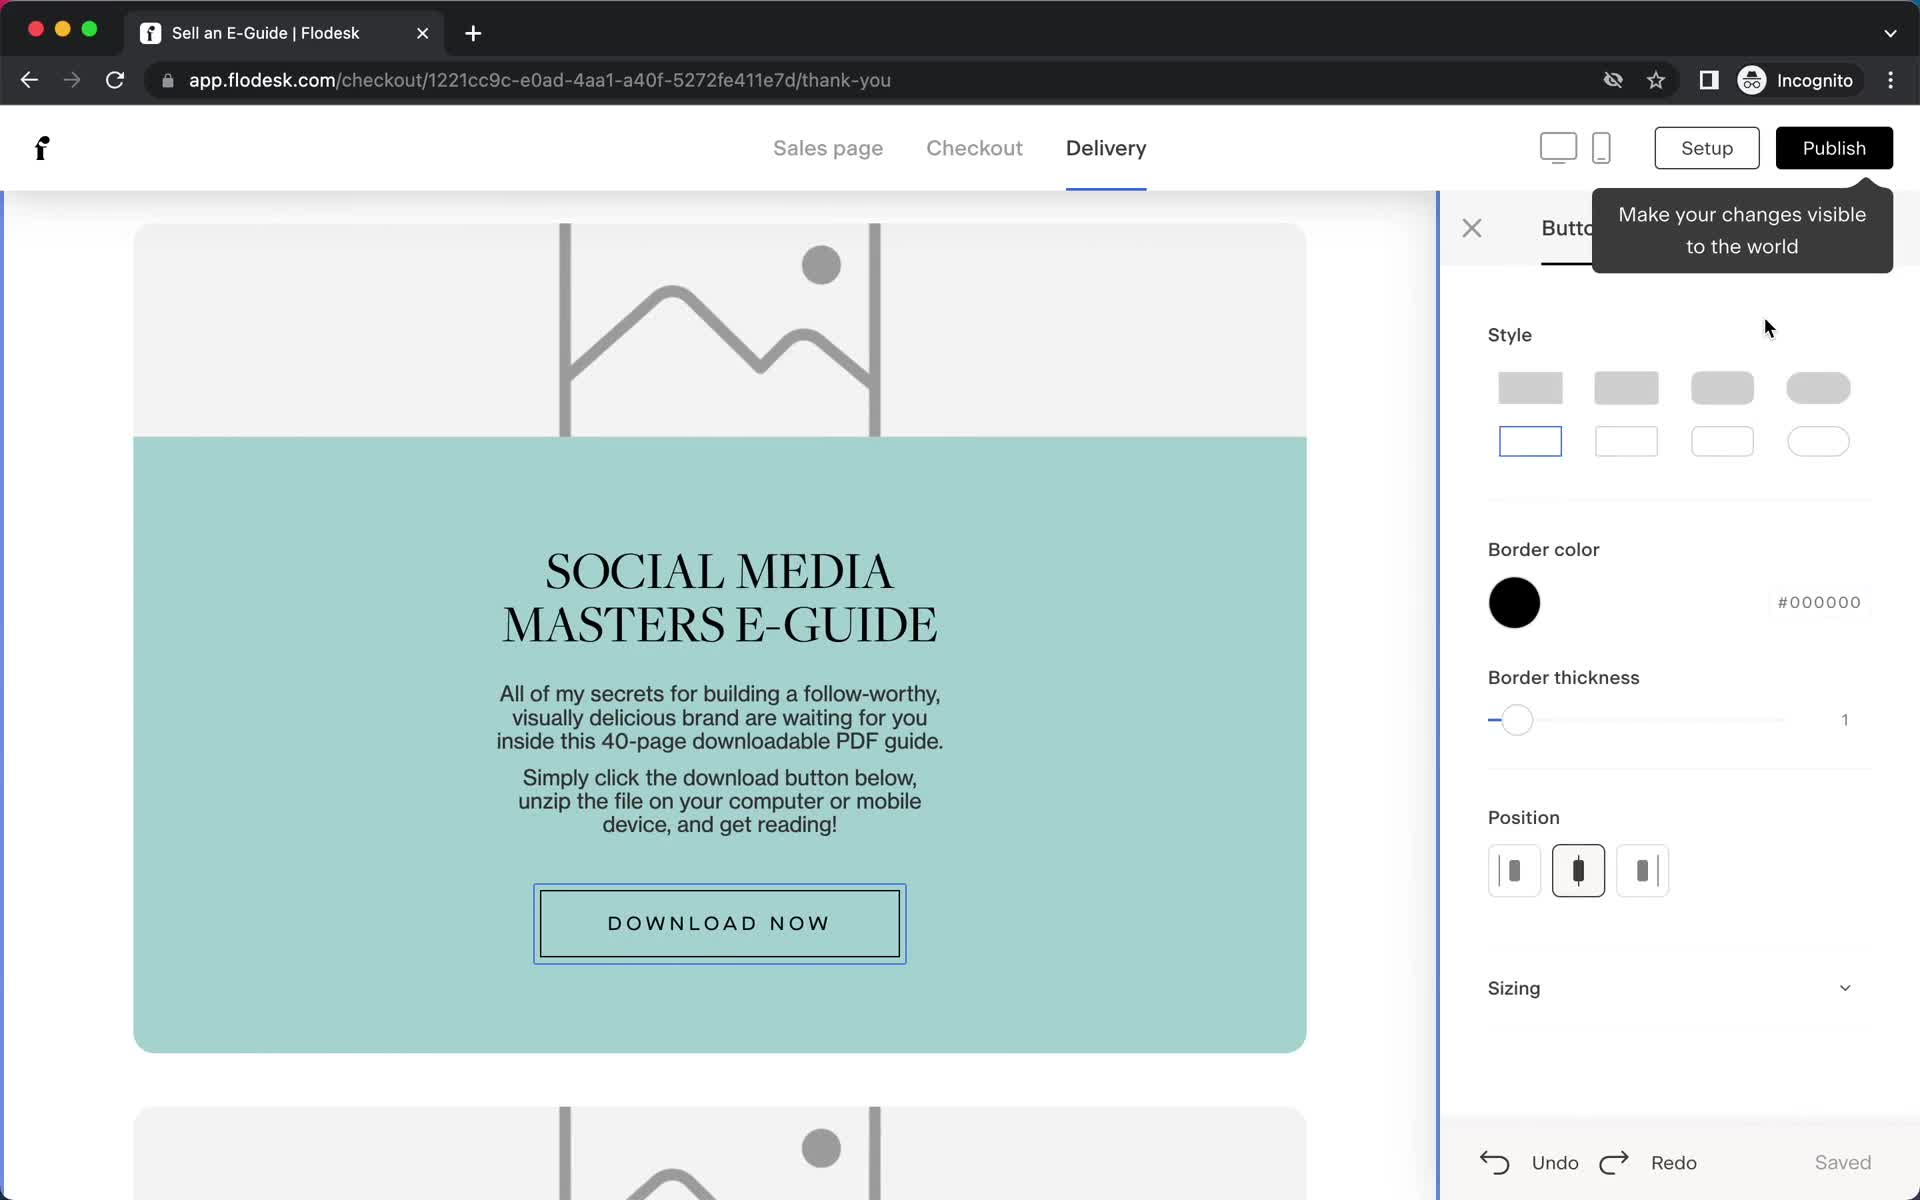
Editor
this is title
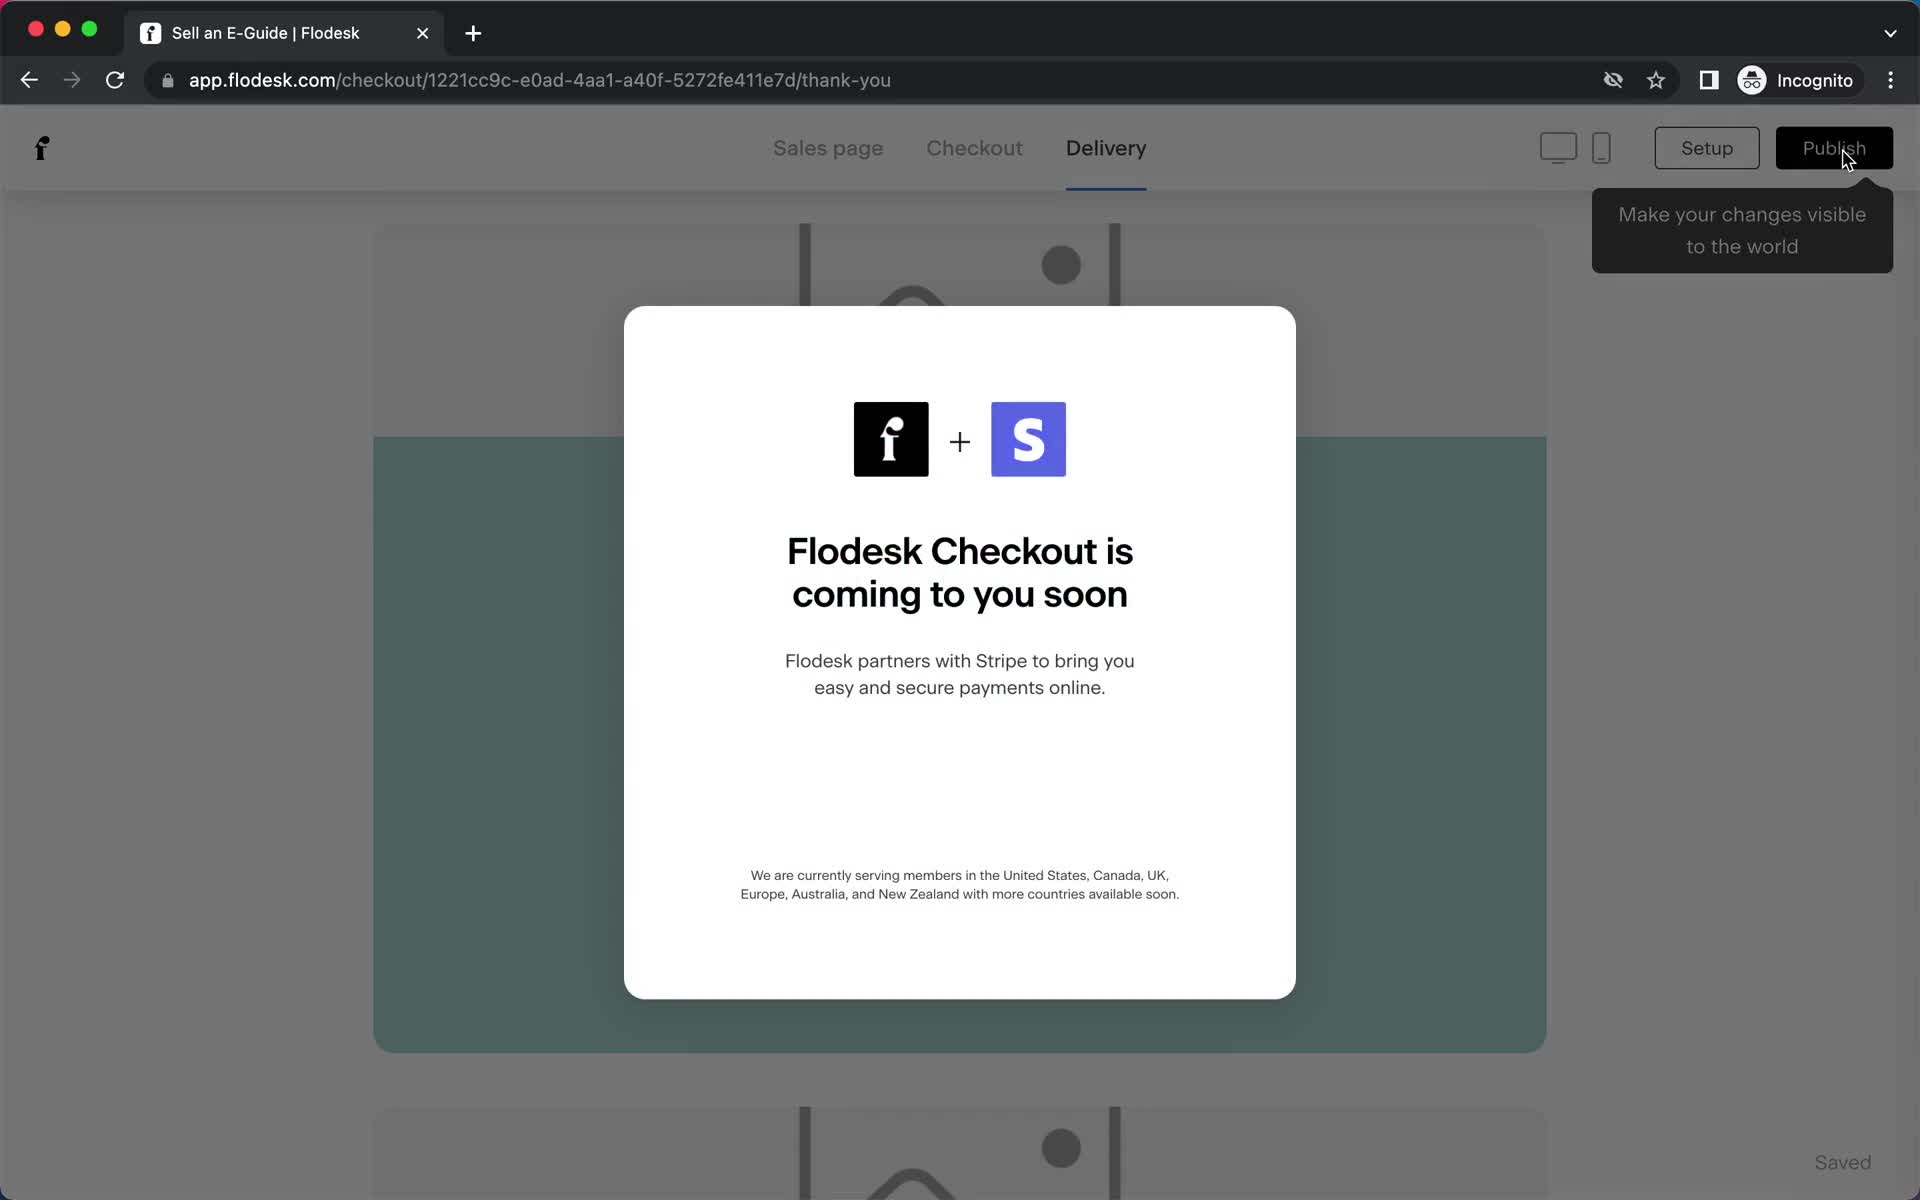
Coming soon
this is title
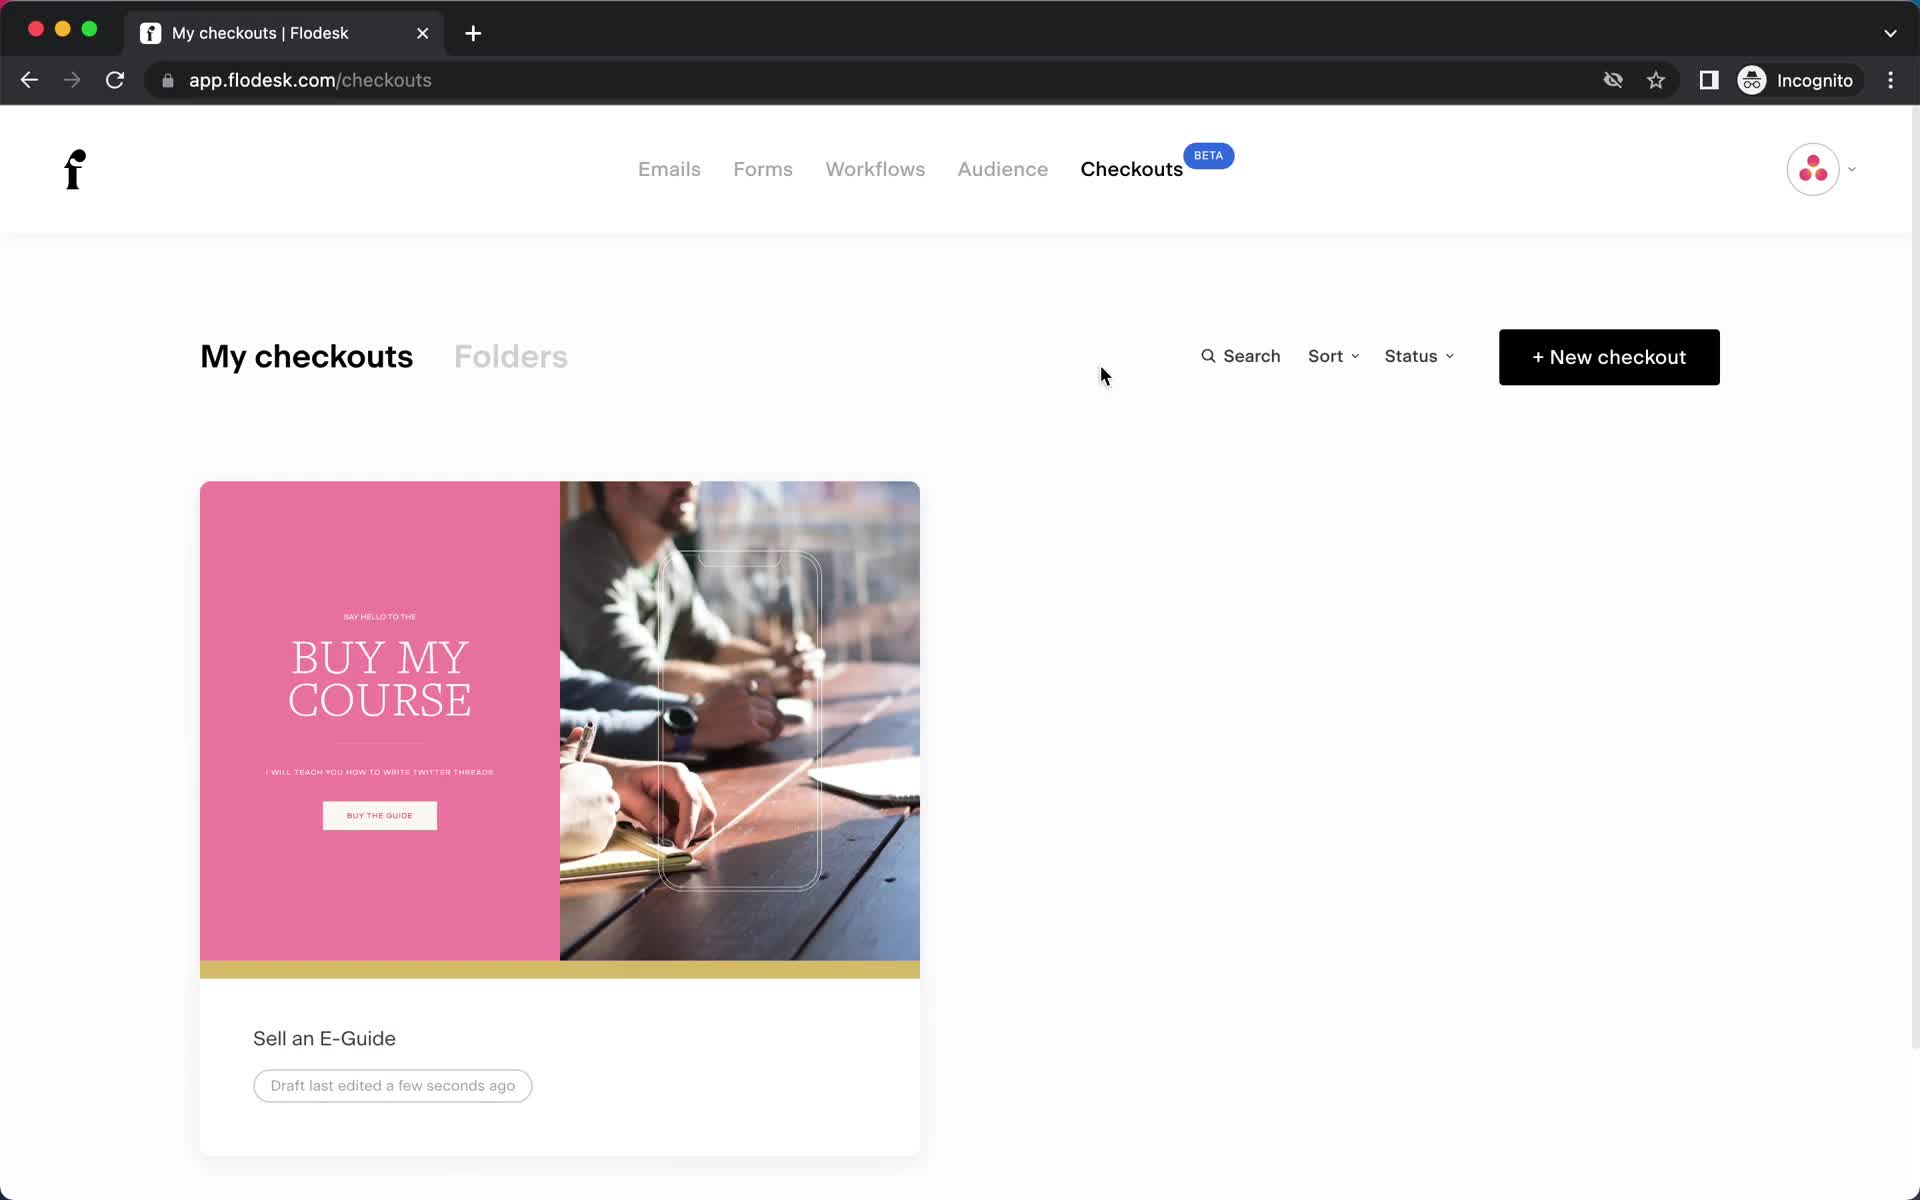
Checkouts
this is title
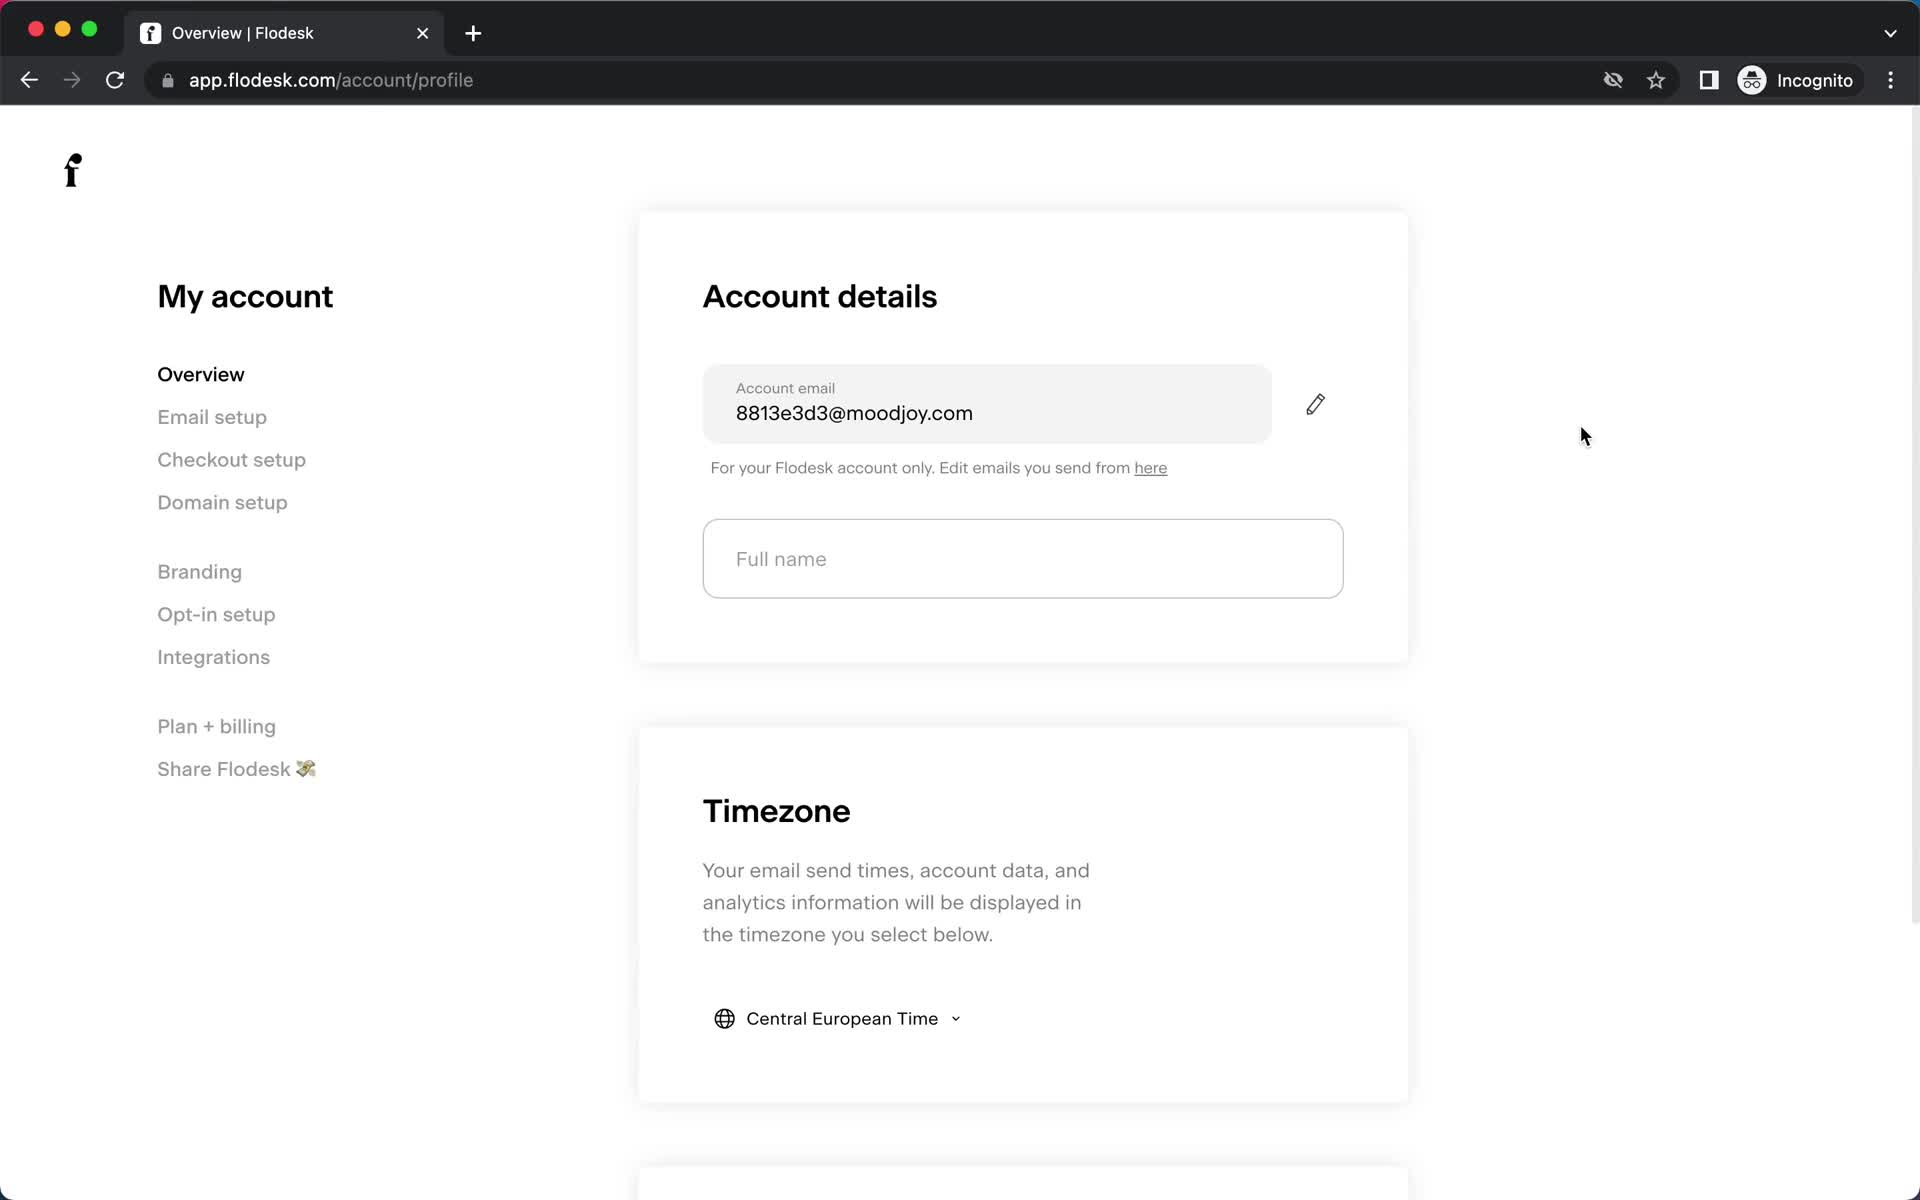
Settings
this is title
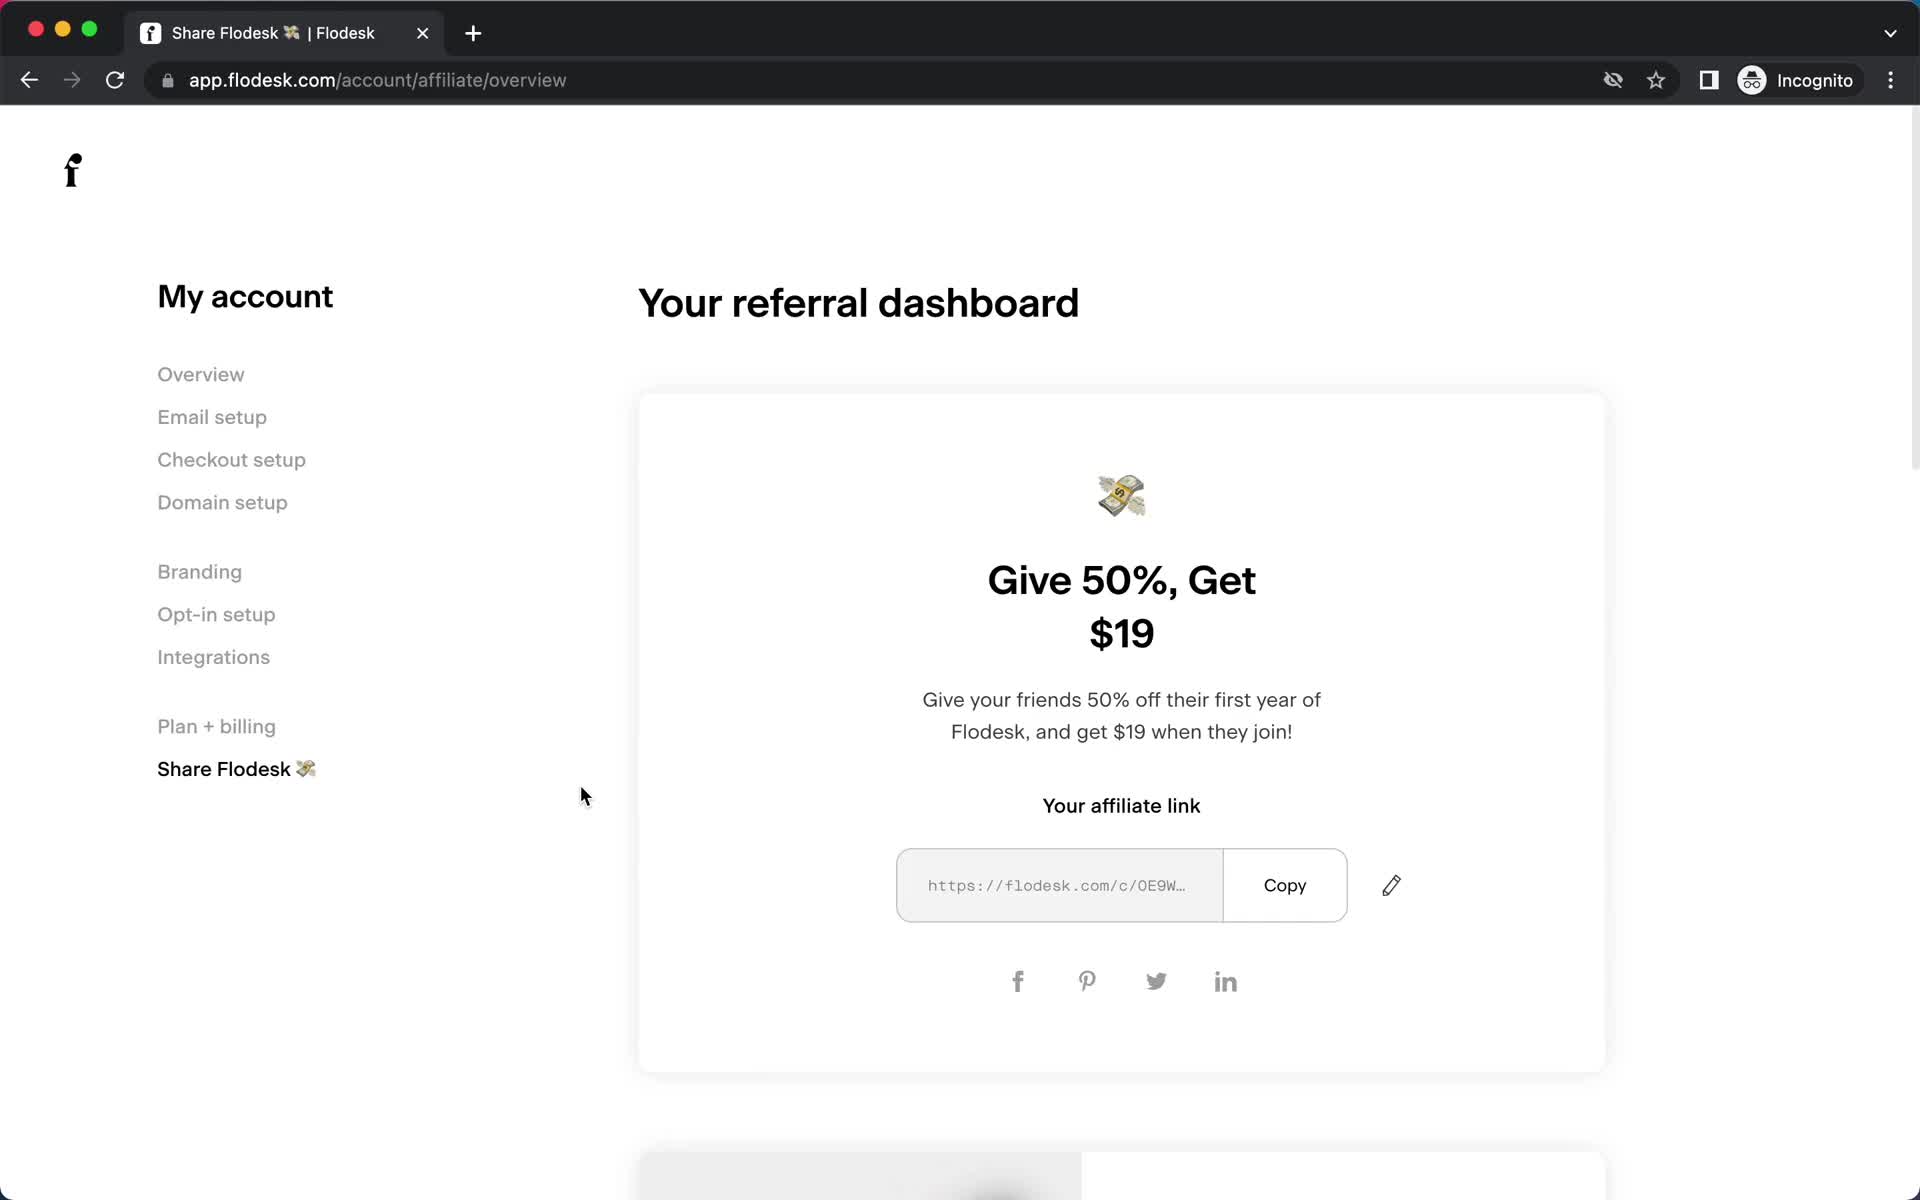
Referral dashboard
this is title
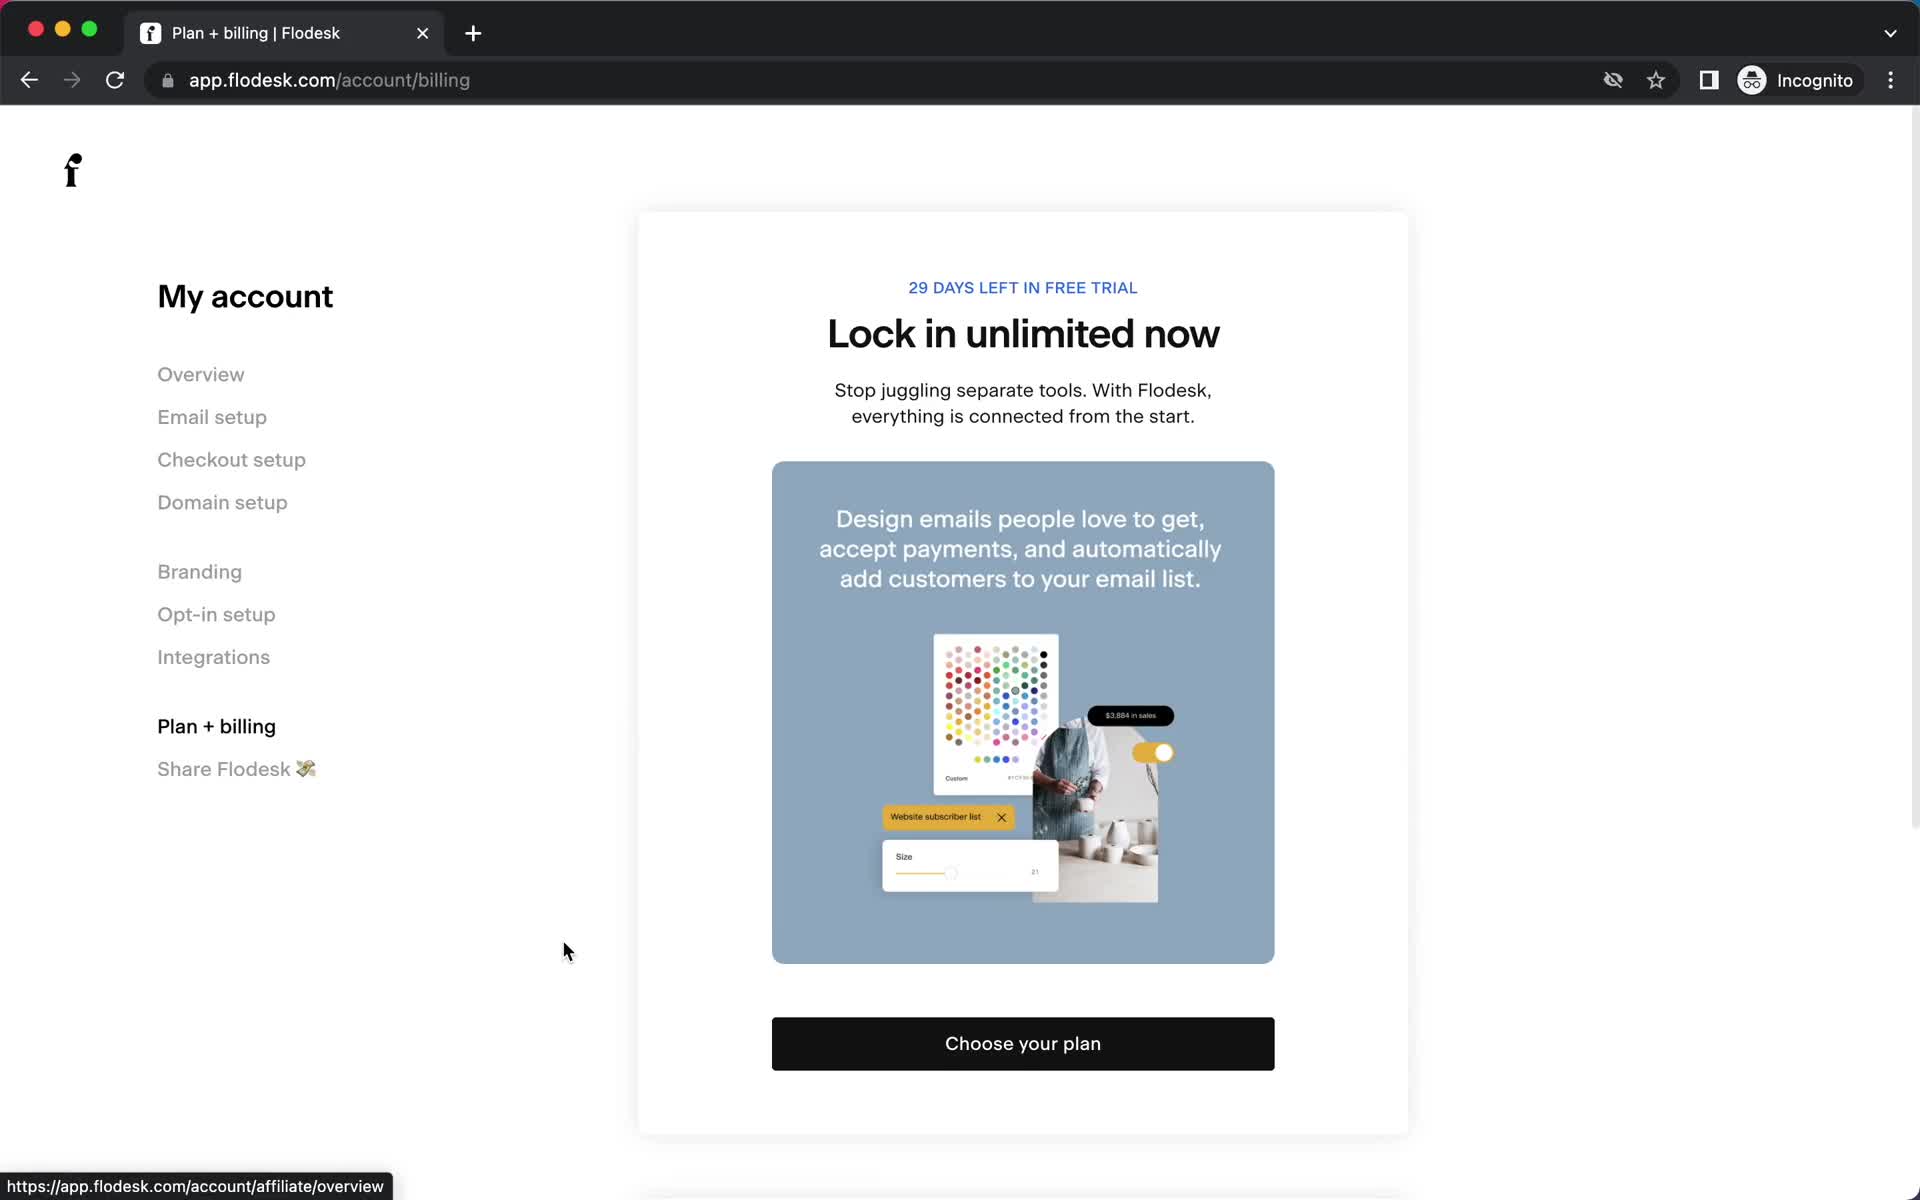
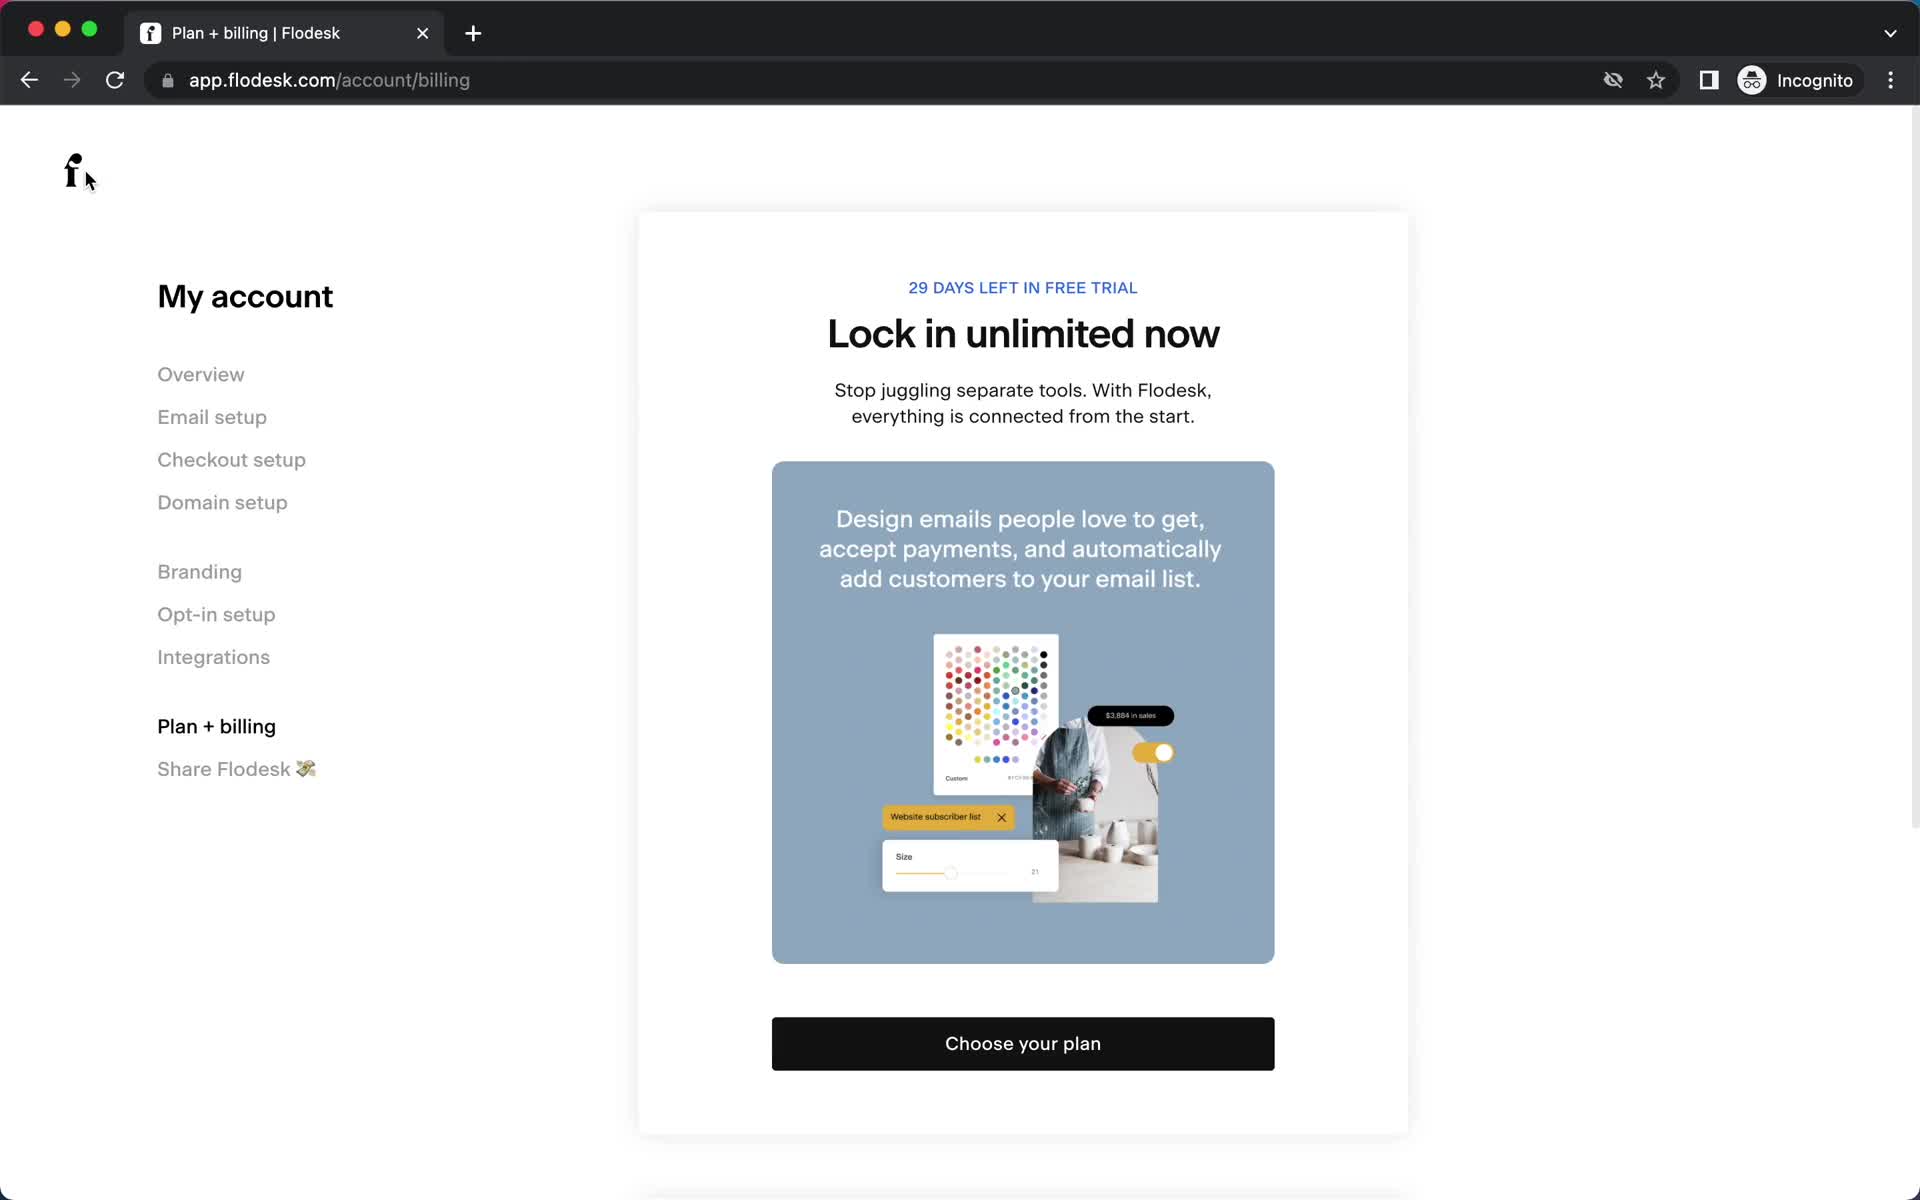
Billing
this is title
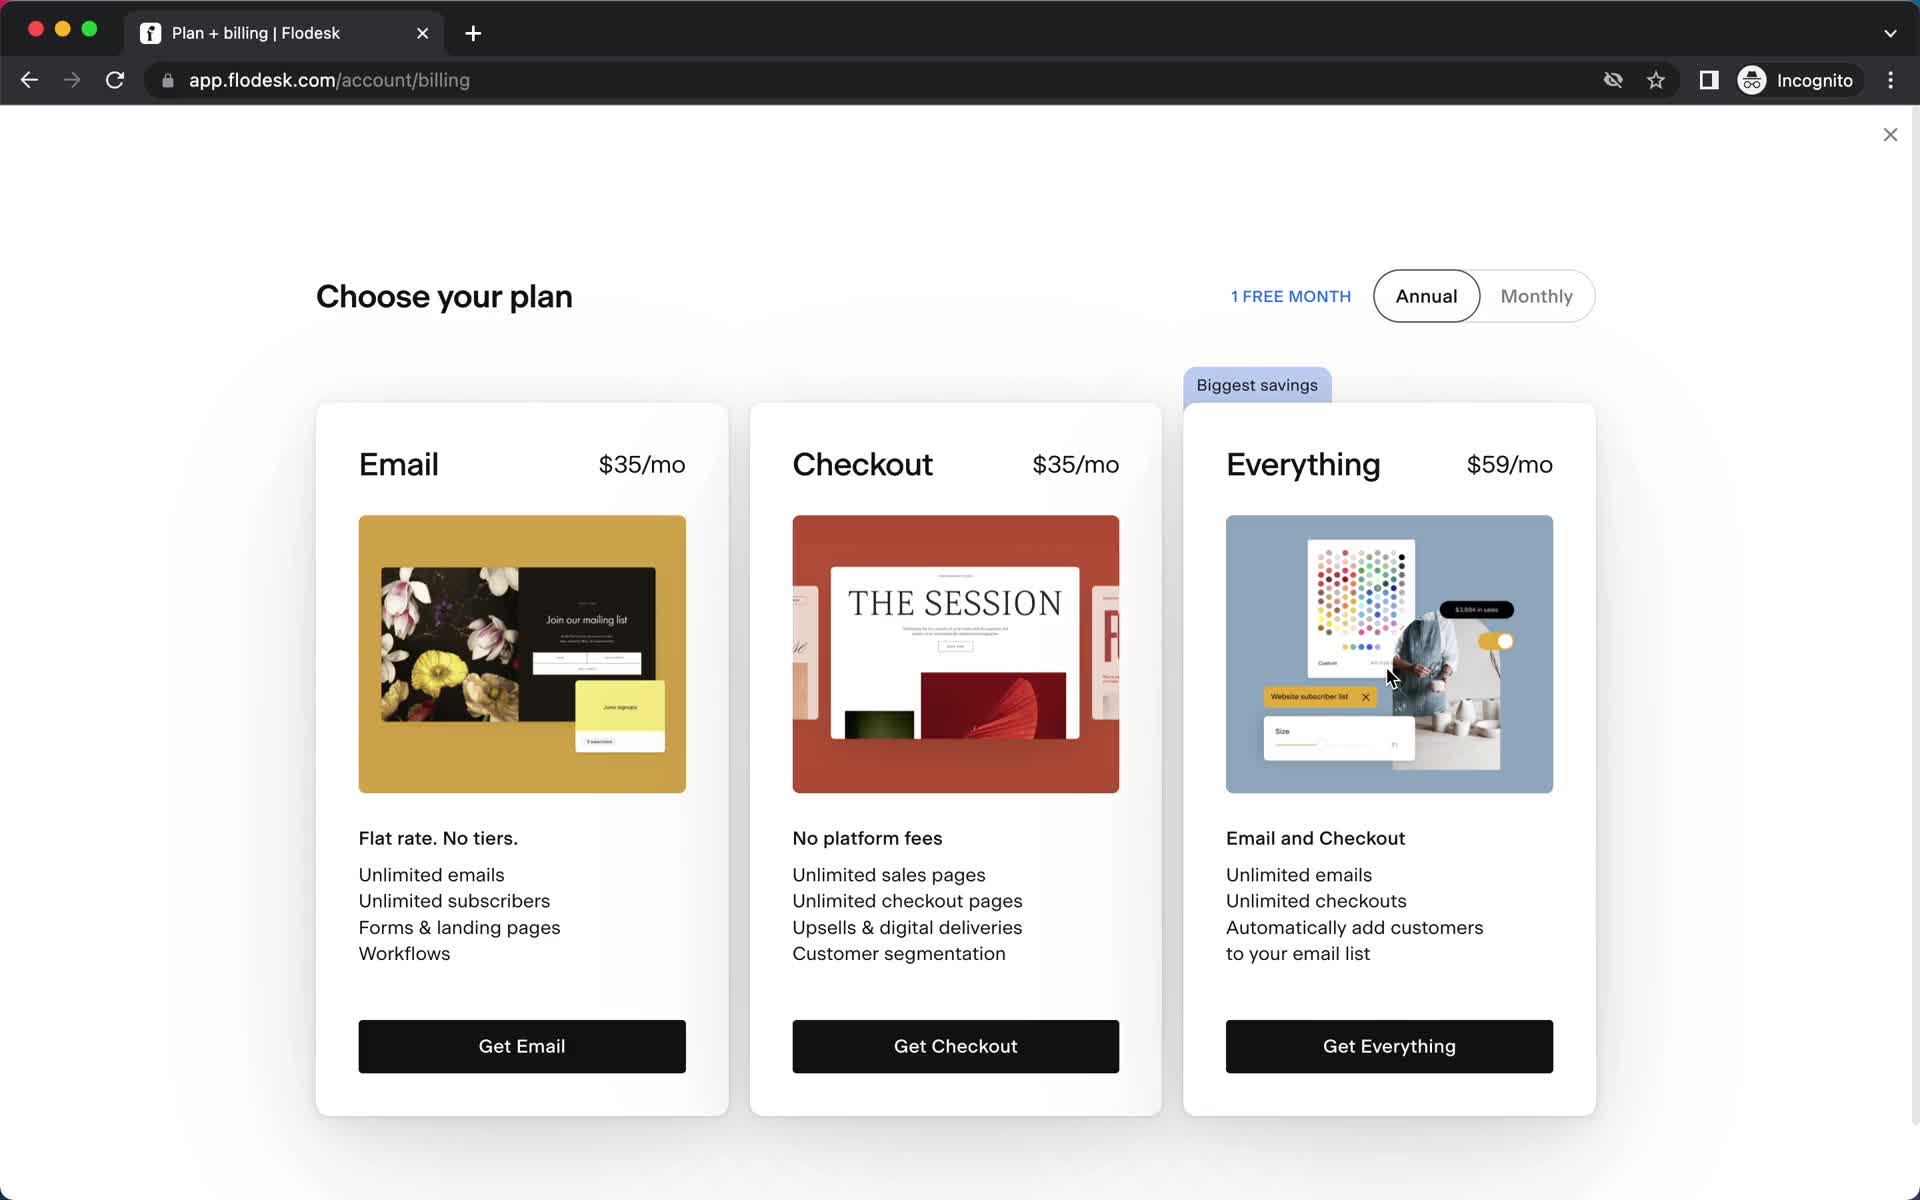
Select plan
this is title
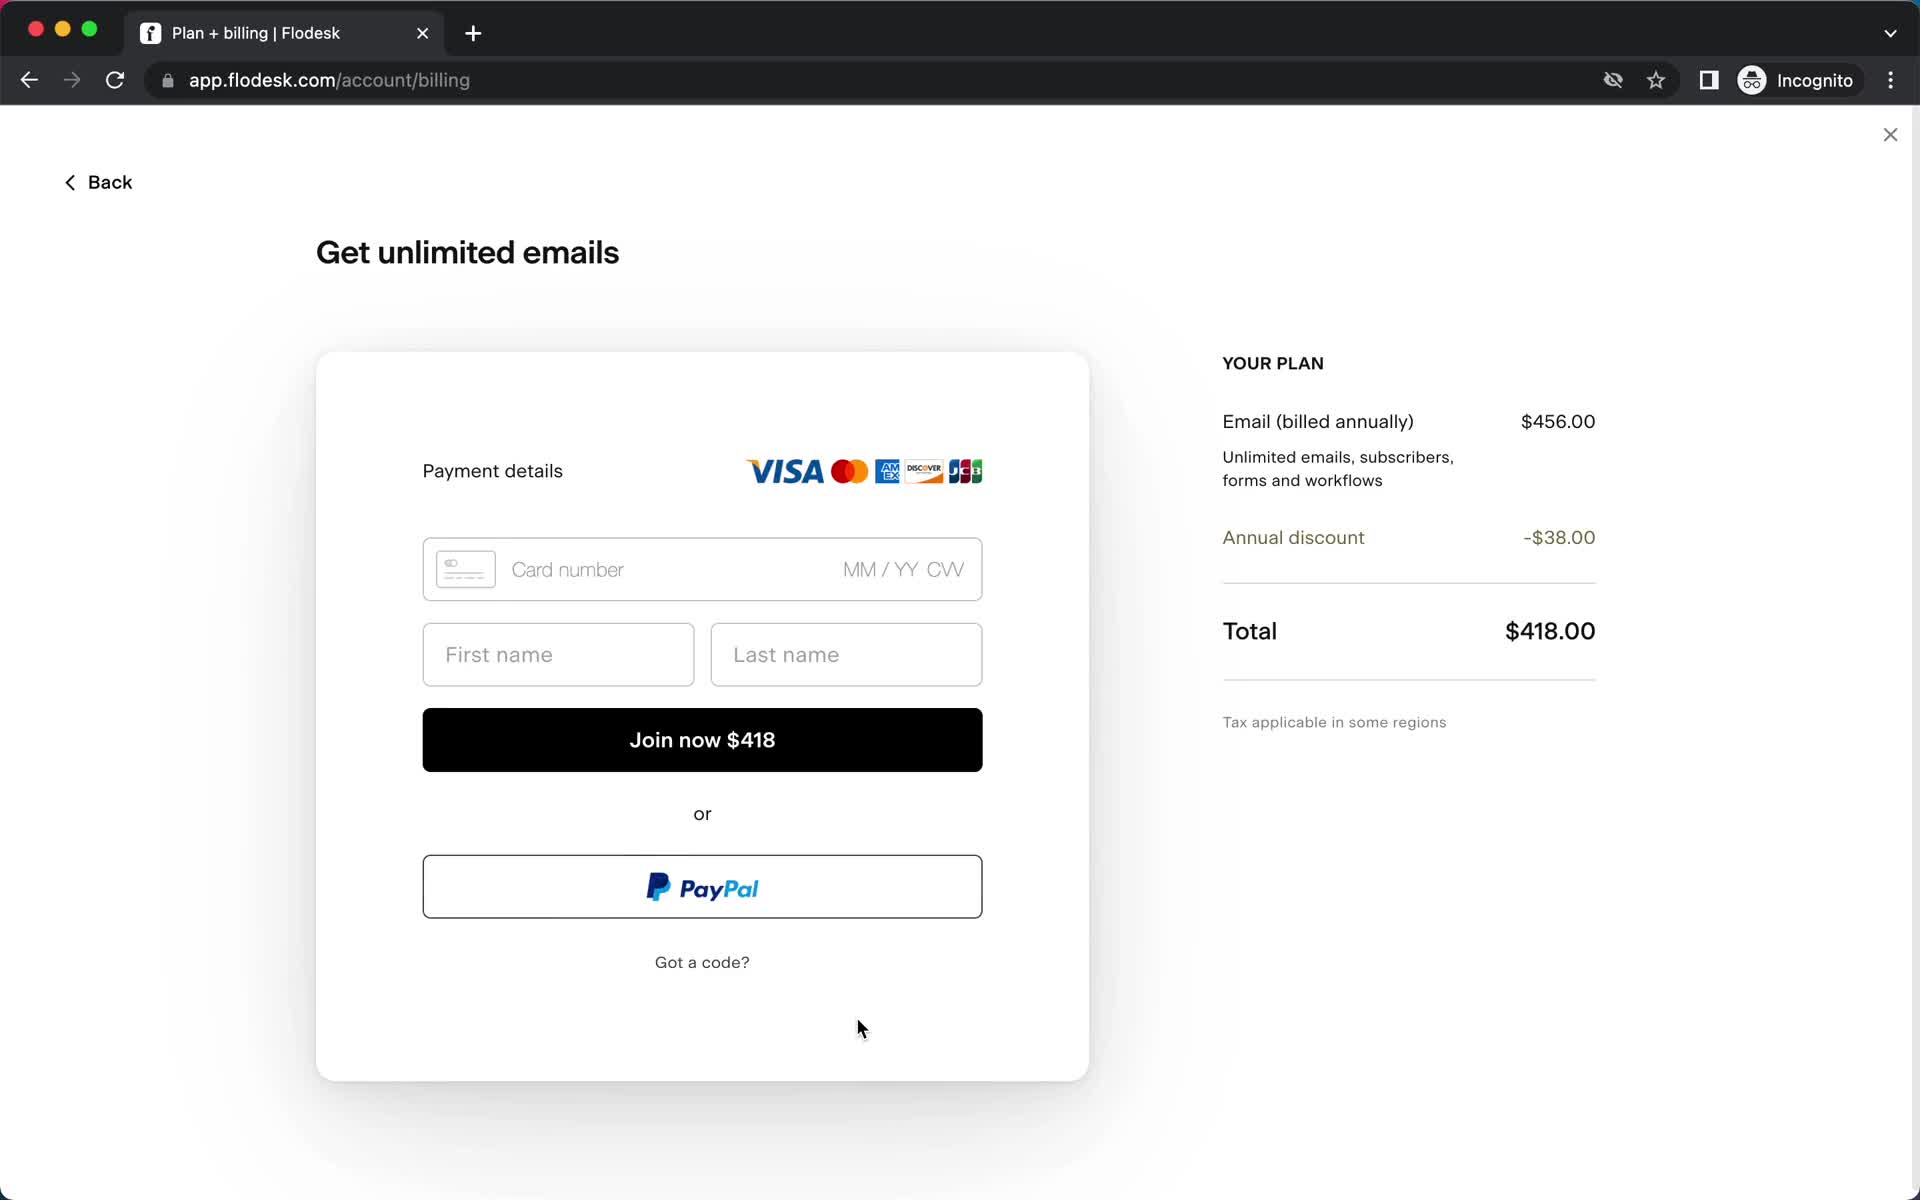
Add payment details
this is title
Billing
this is title
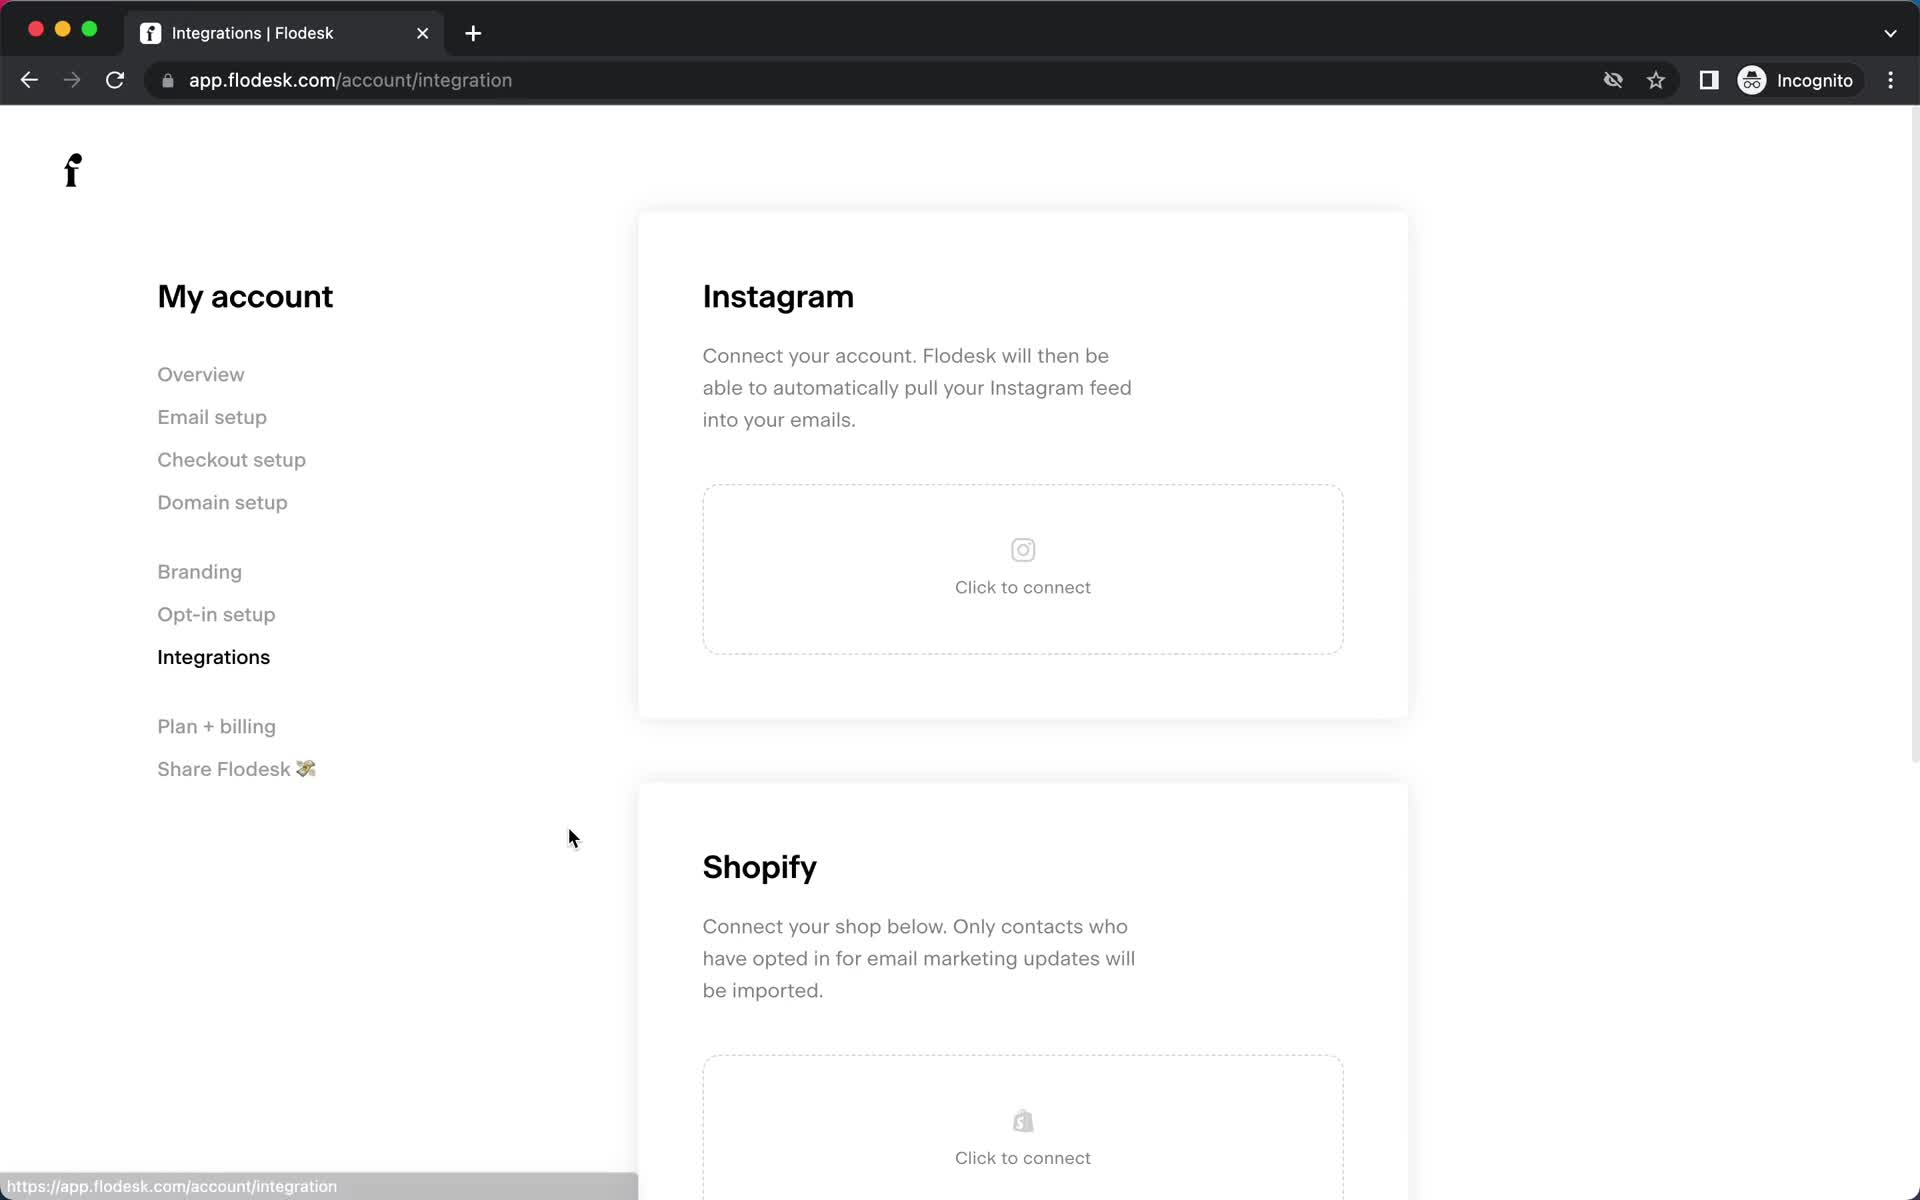
Integrations
this is title
Homepage
this is title
Sign up
this is title
Check your inbox
this is title
Verify email
this is title
Log in
this is title
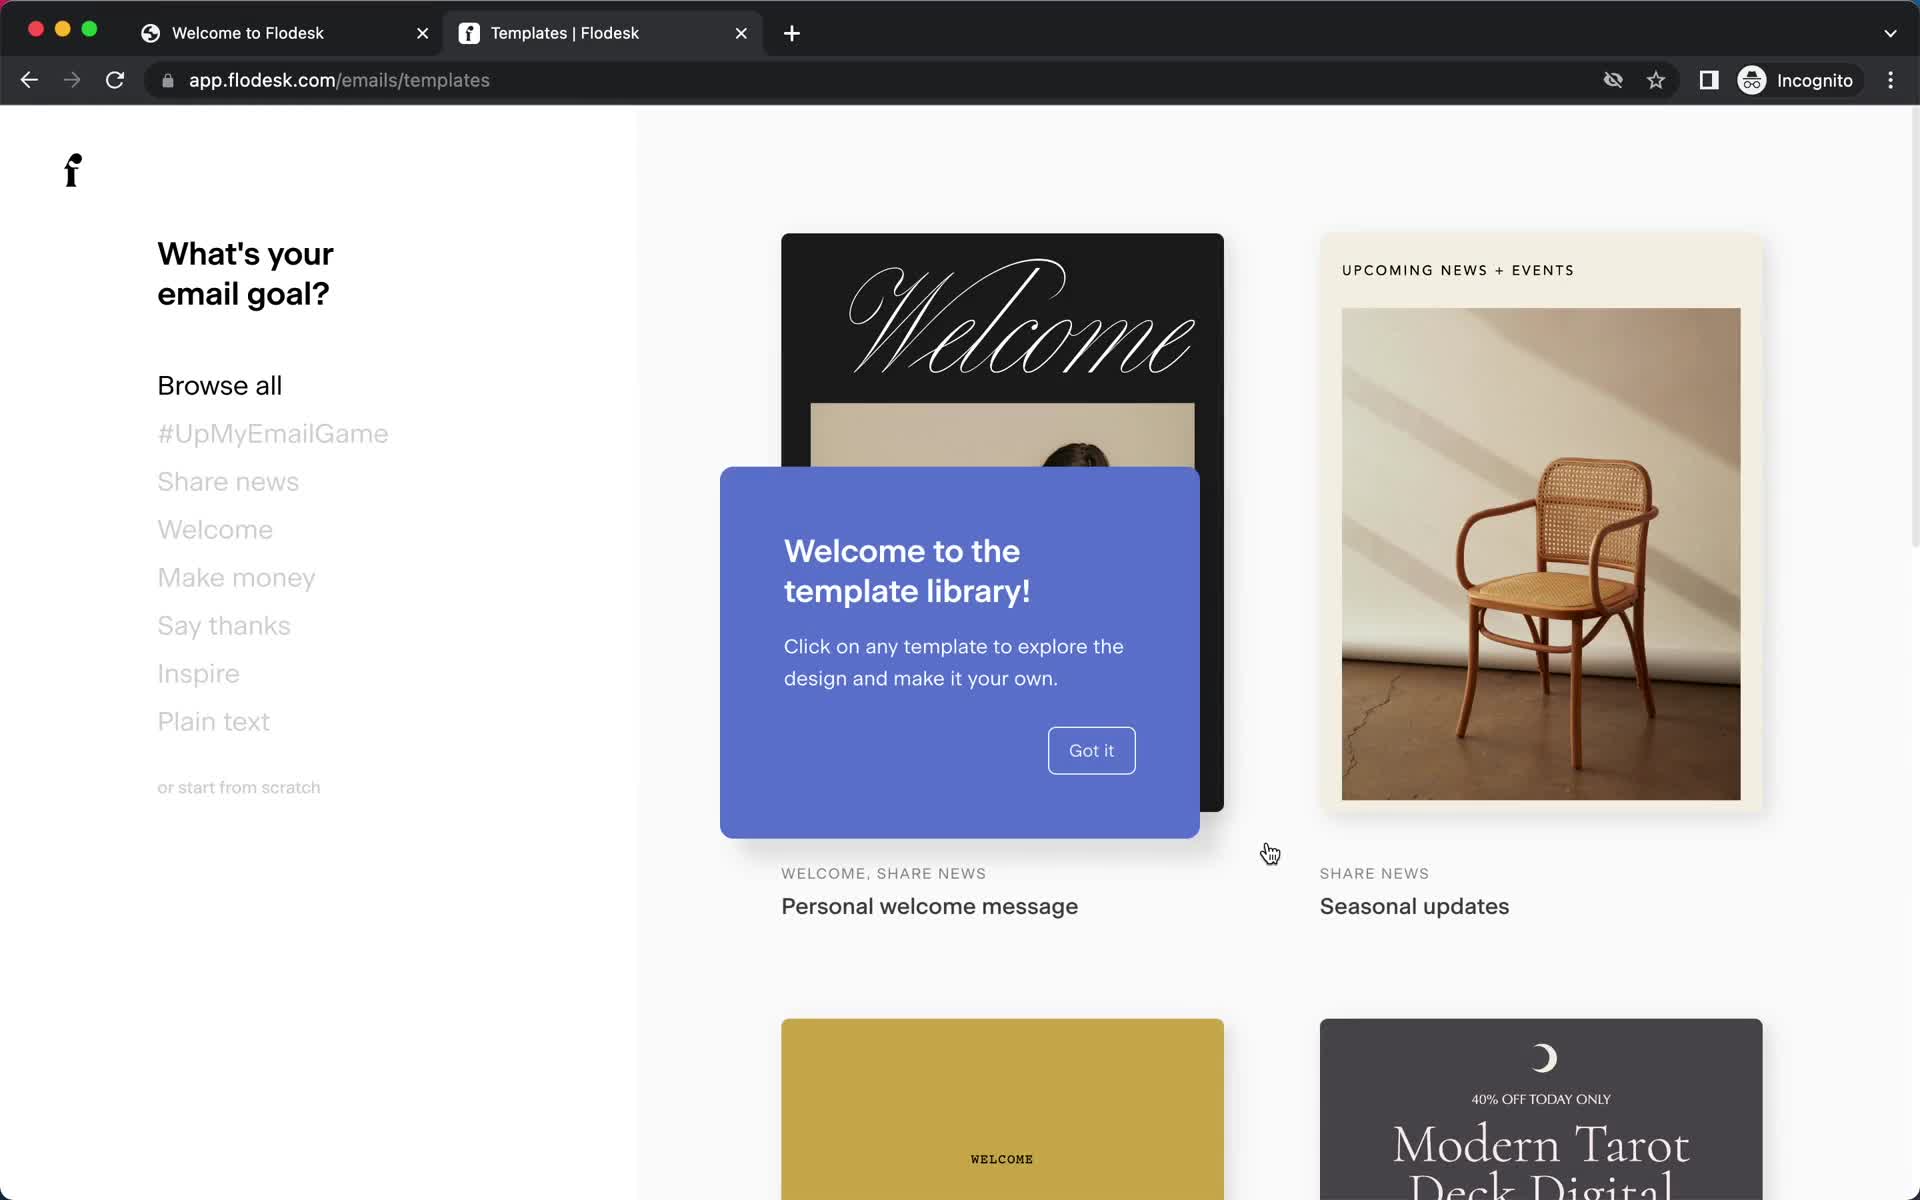
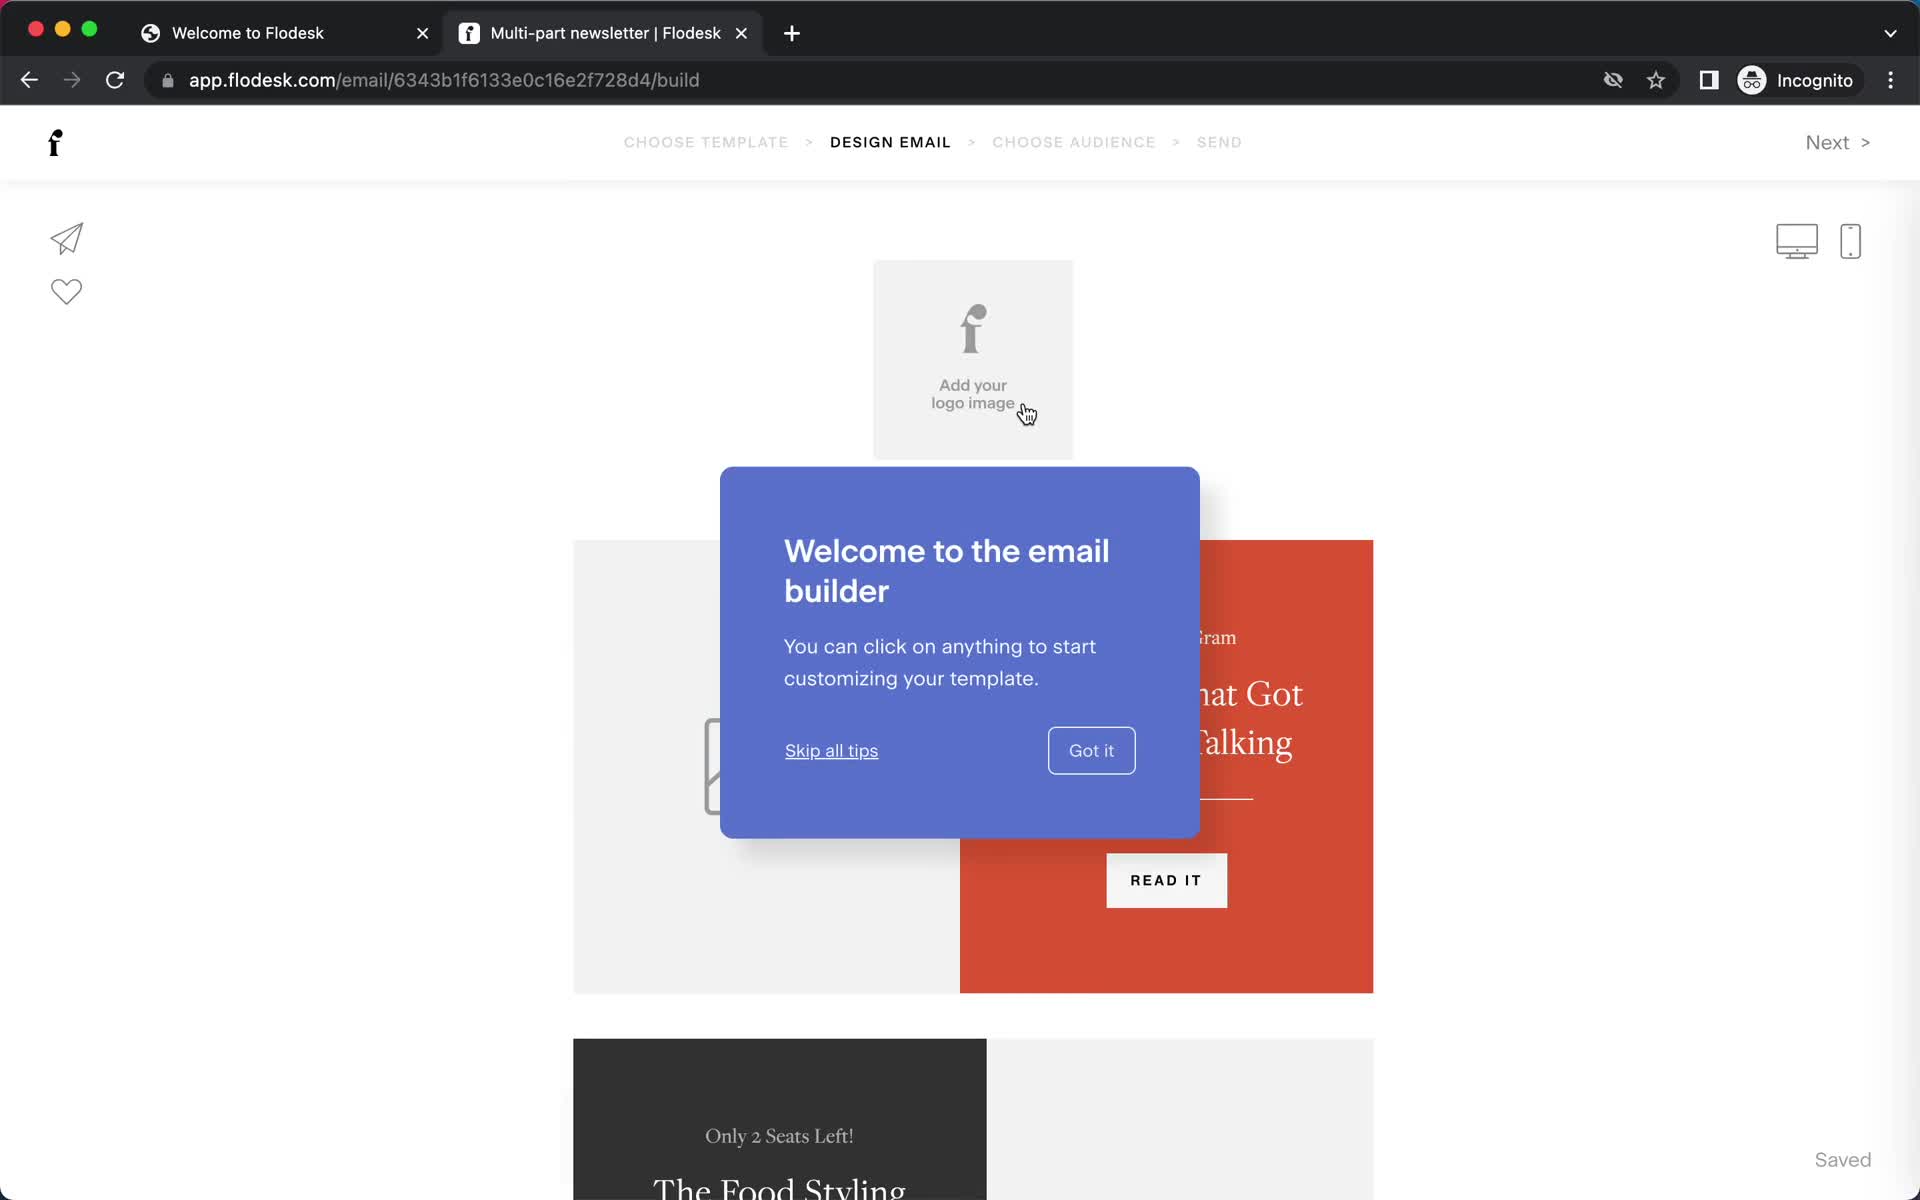
Guide modal
this is title
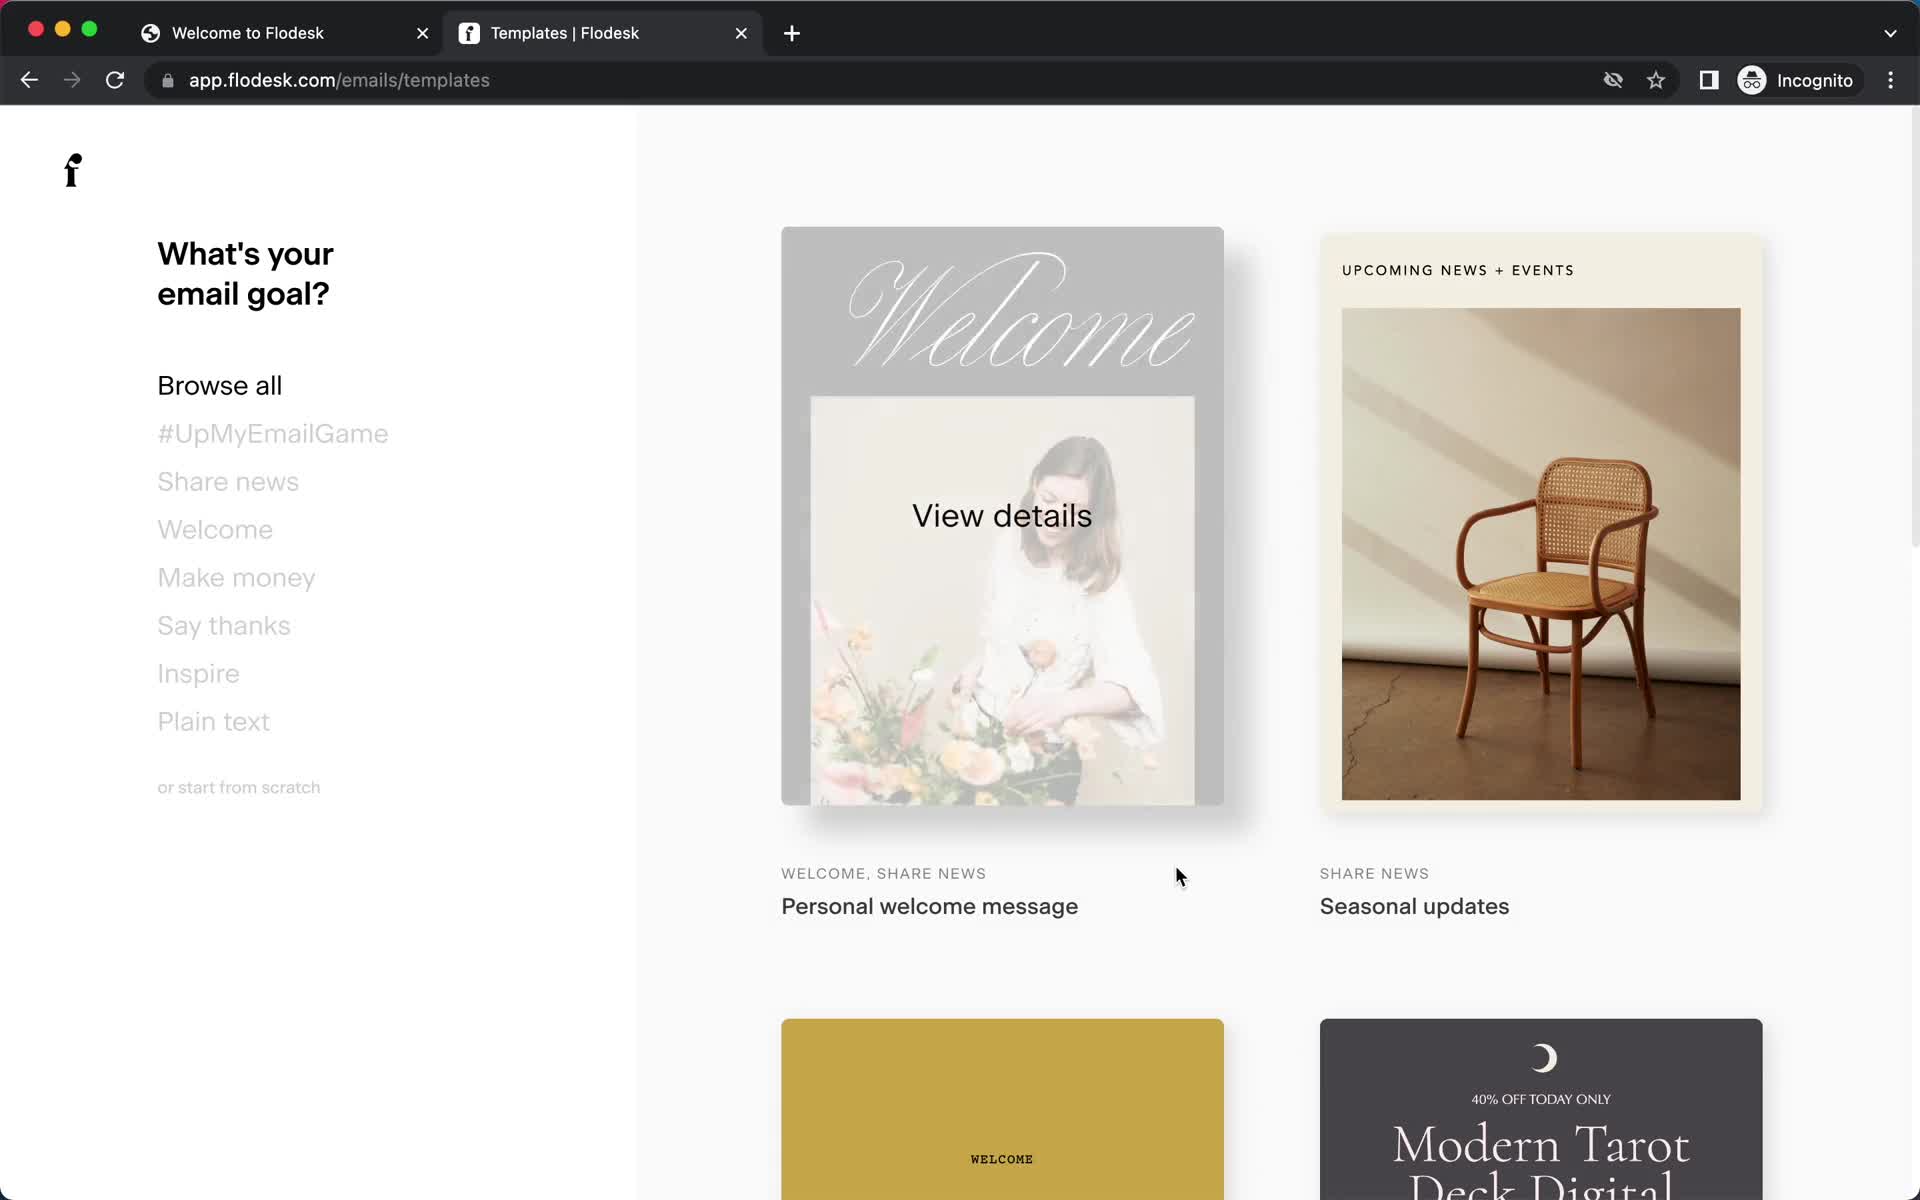
Select template
this is title
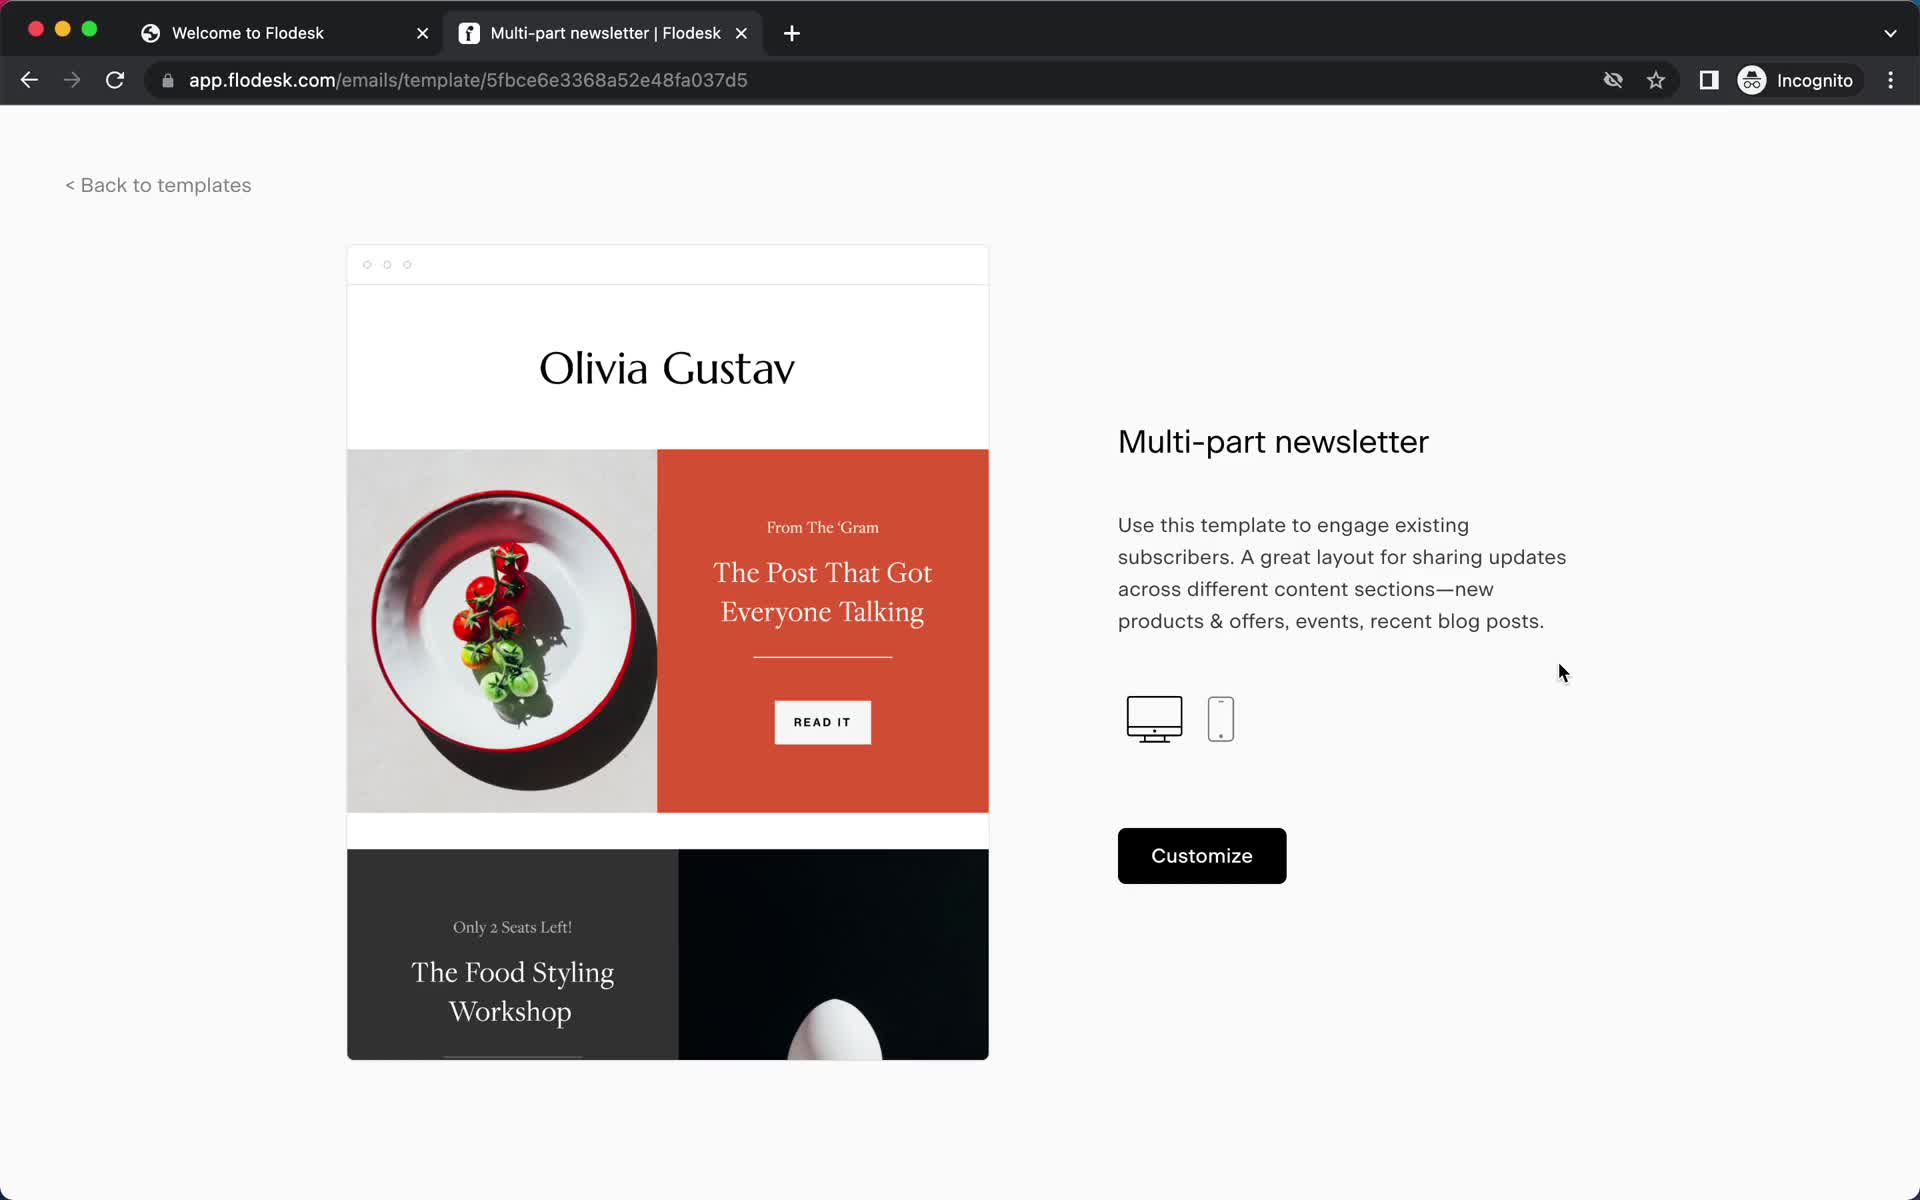
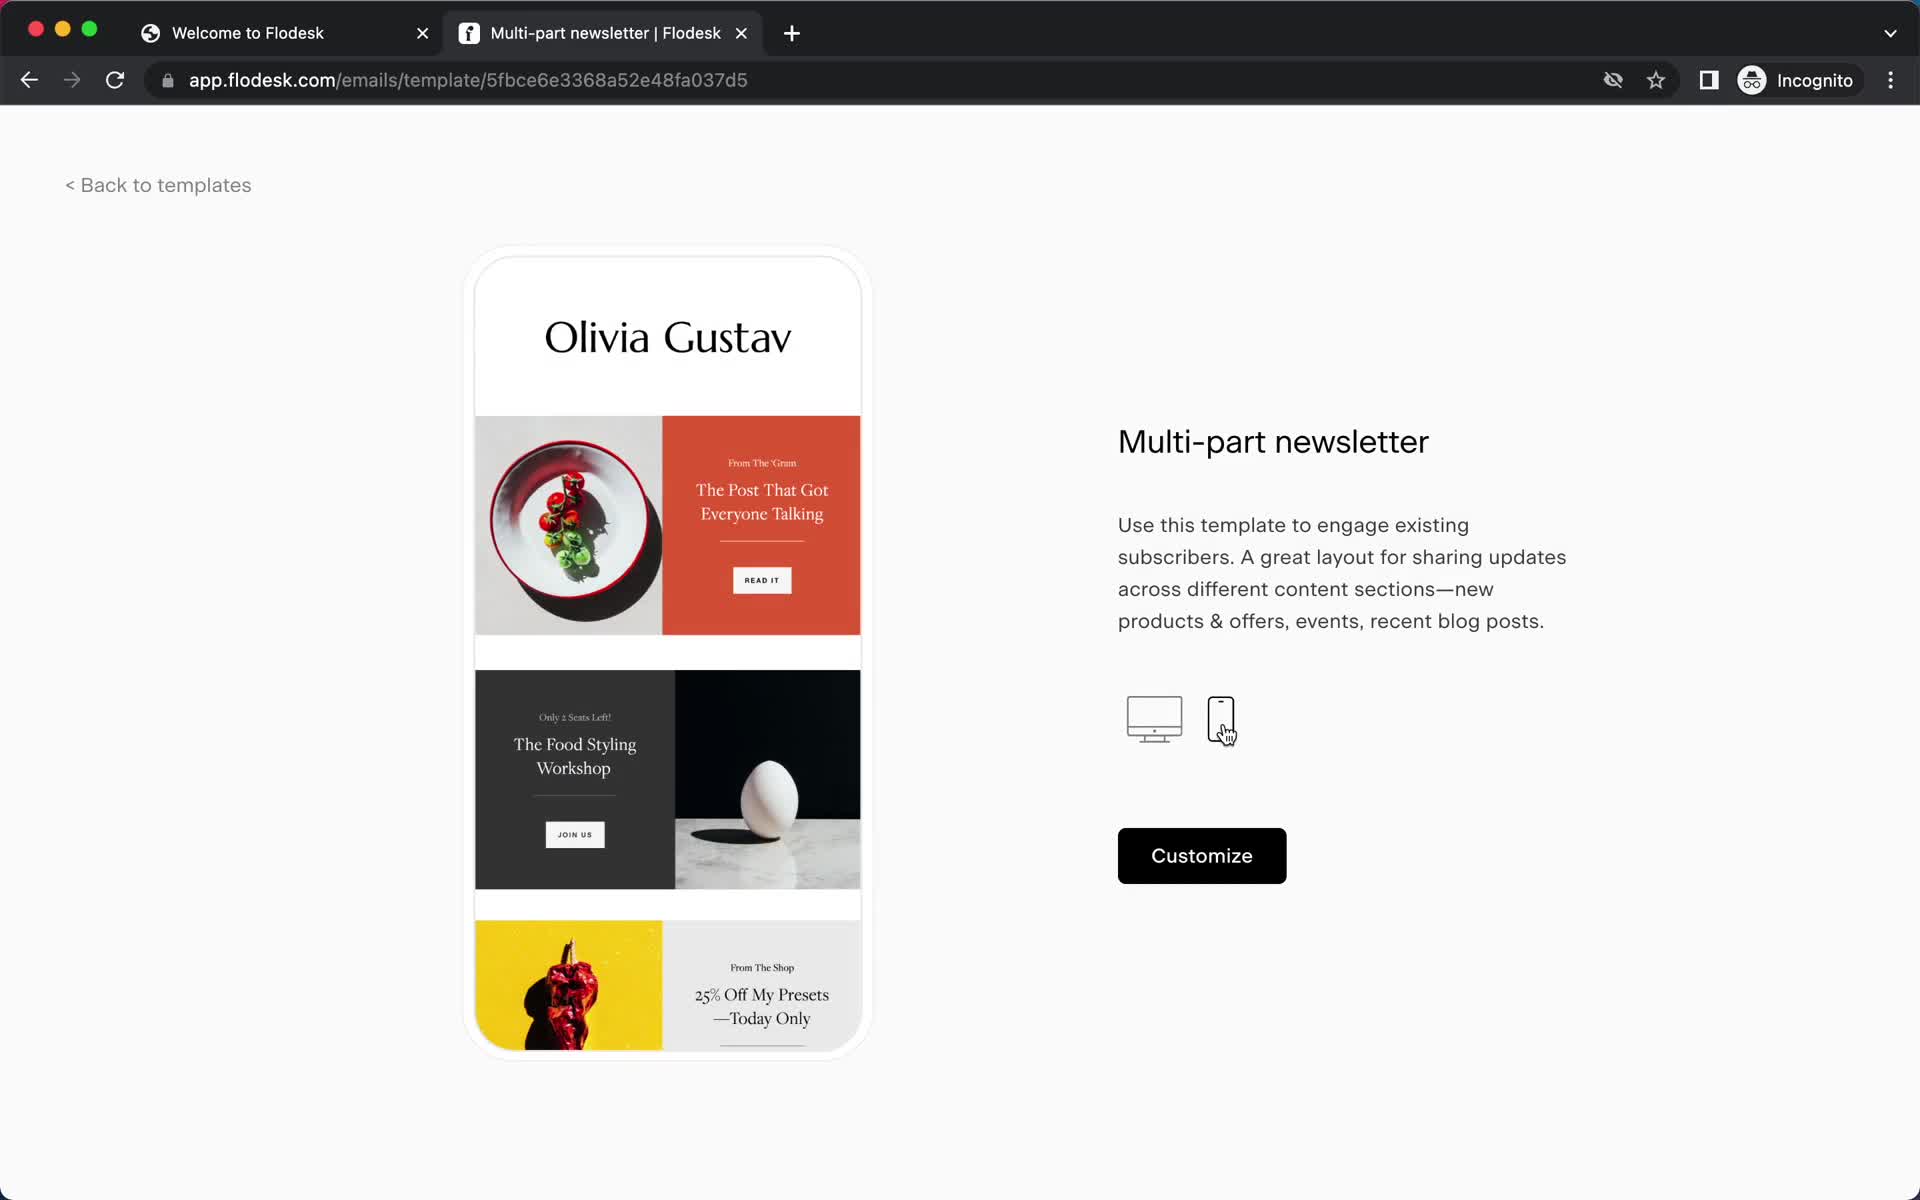
Template preview
this is title
Template preview
this is title
Guide modal
this is title
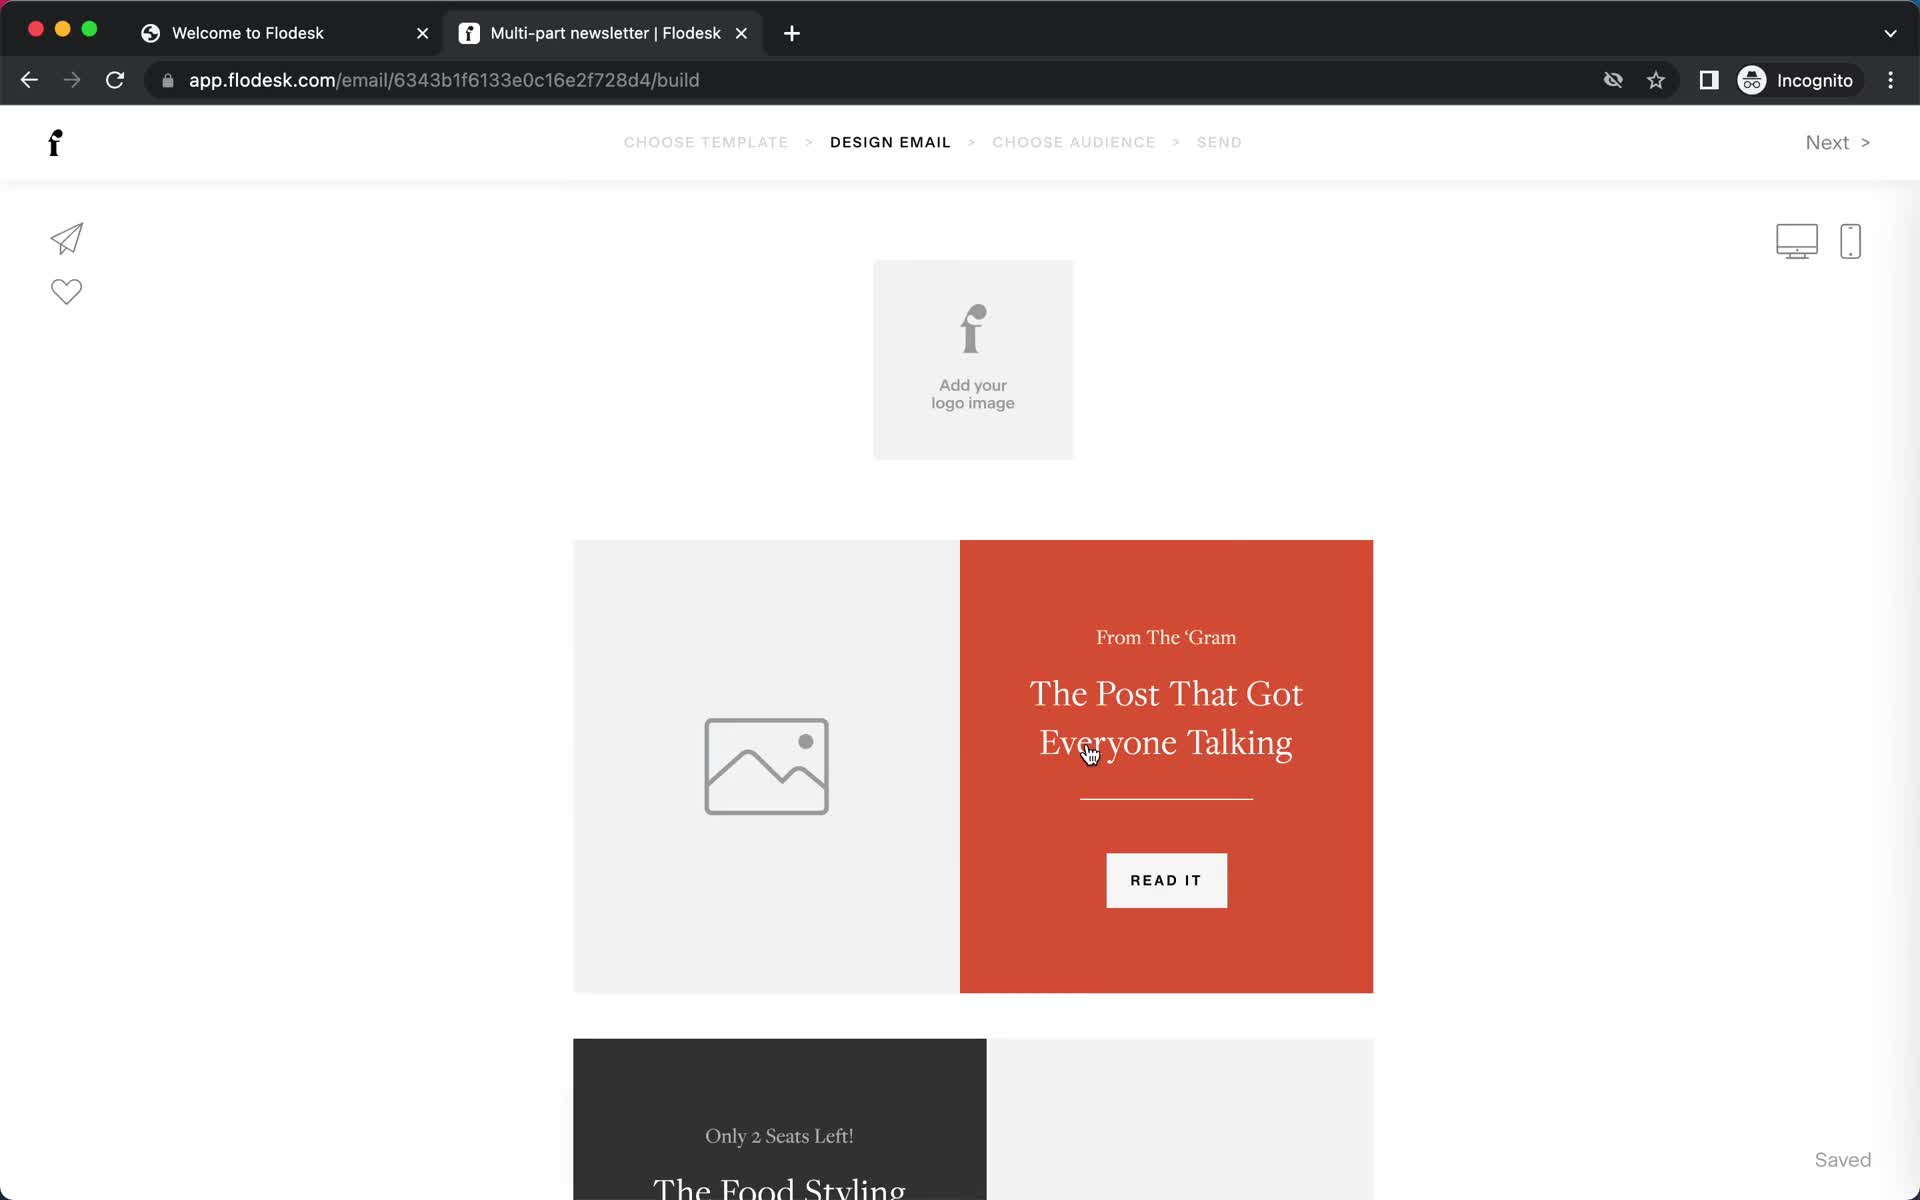
Editor
this is title
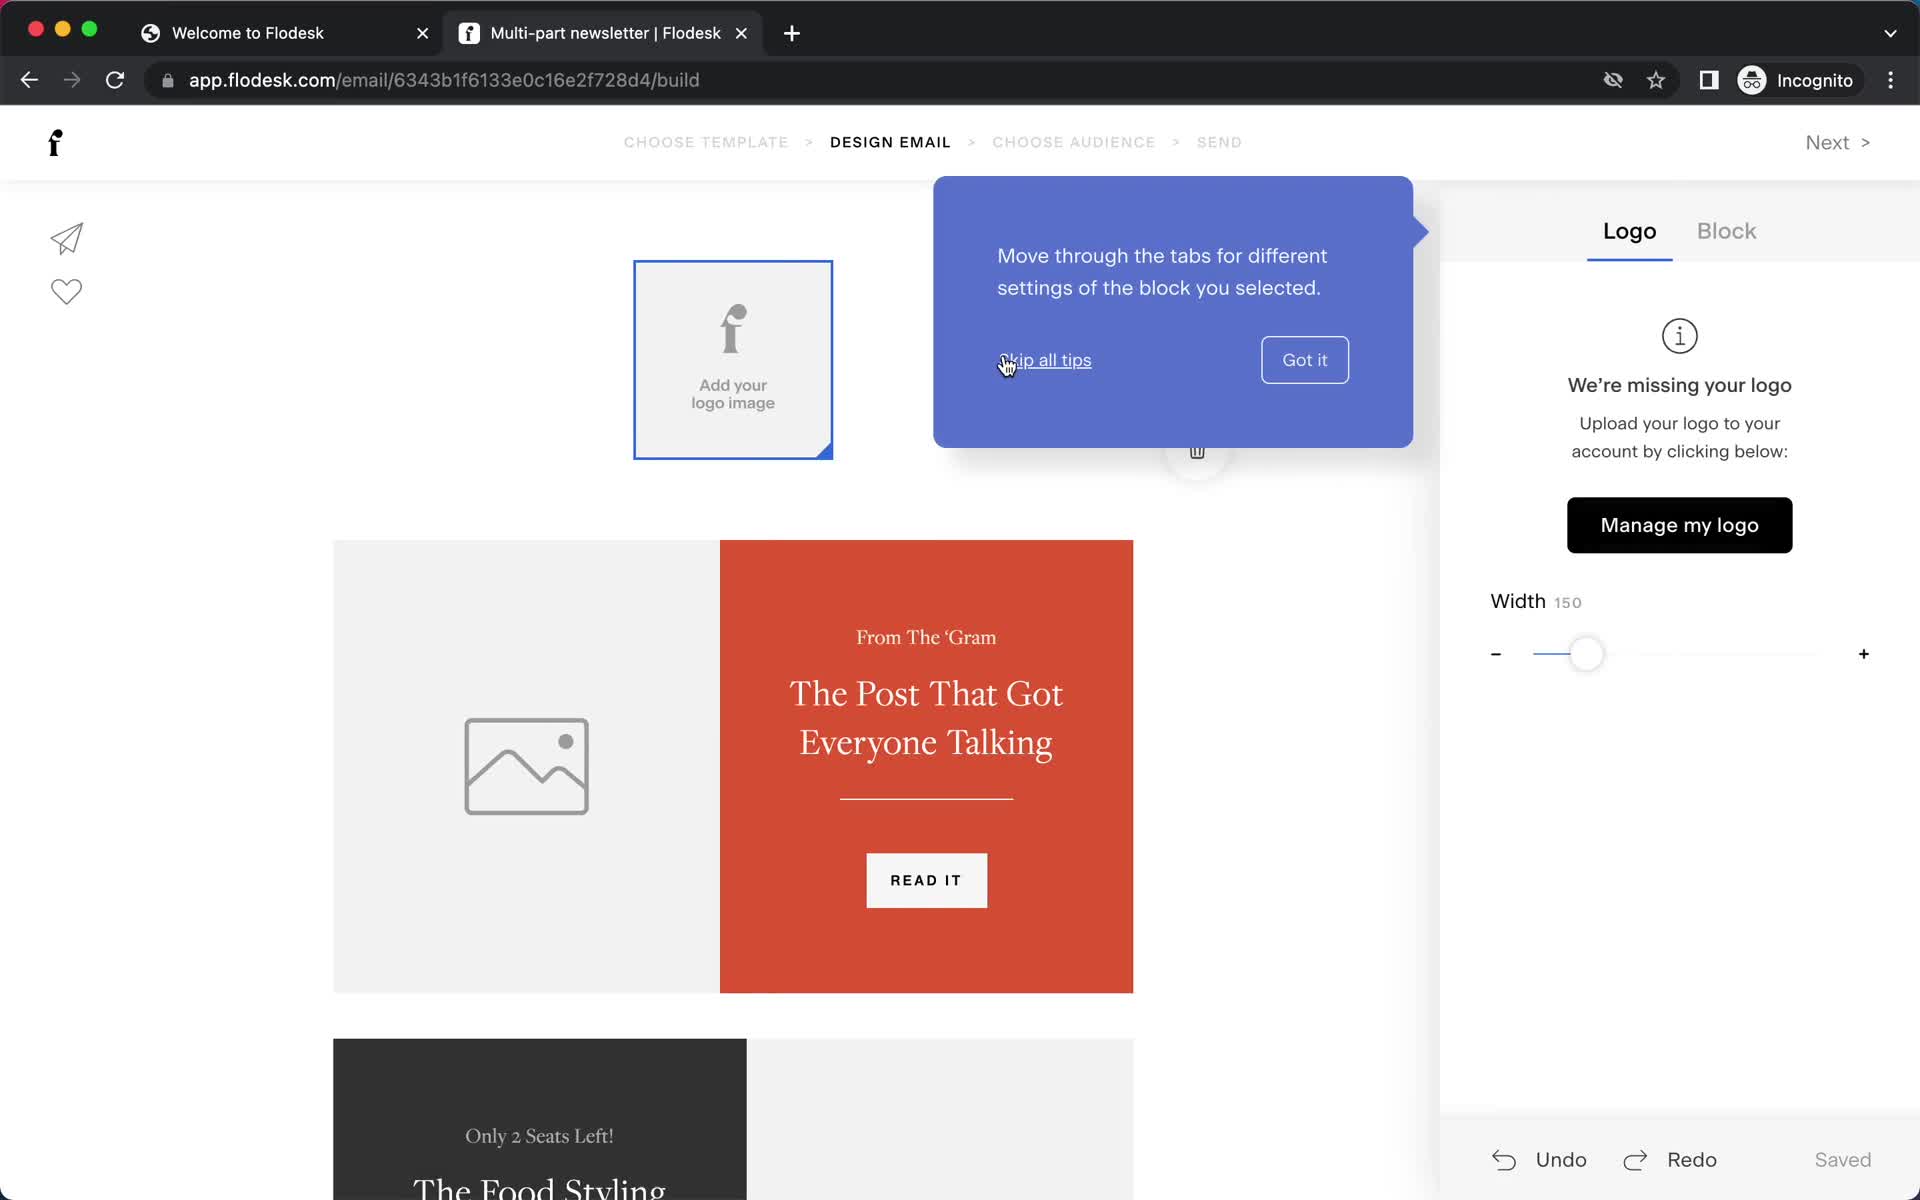
Guide tooltip
this is title
Editor
this is title
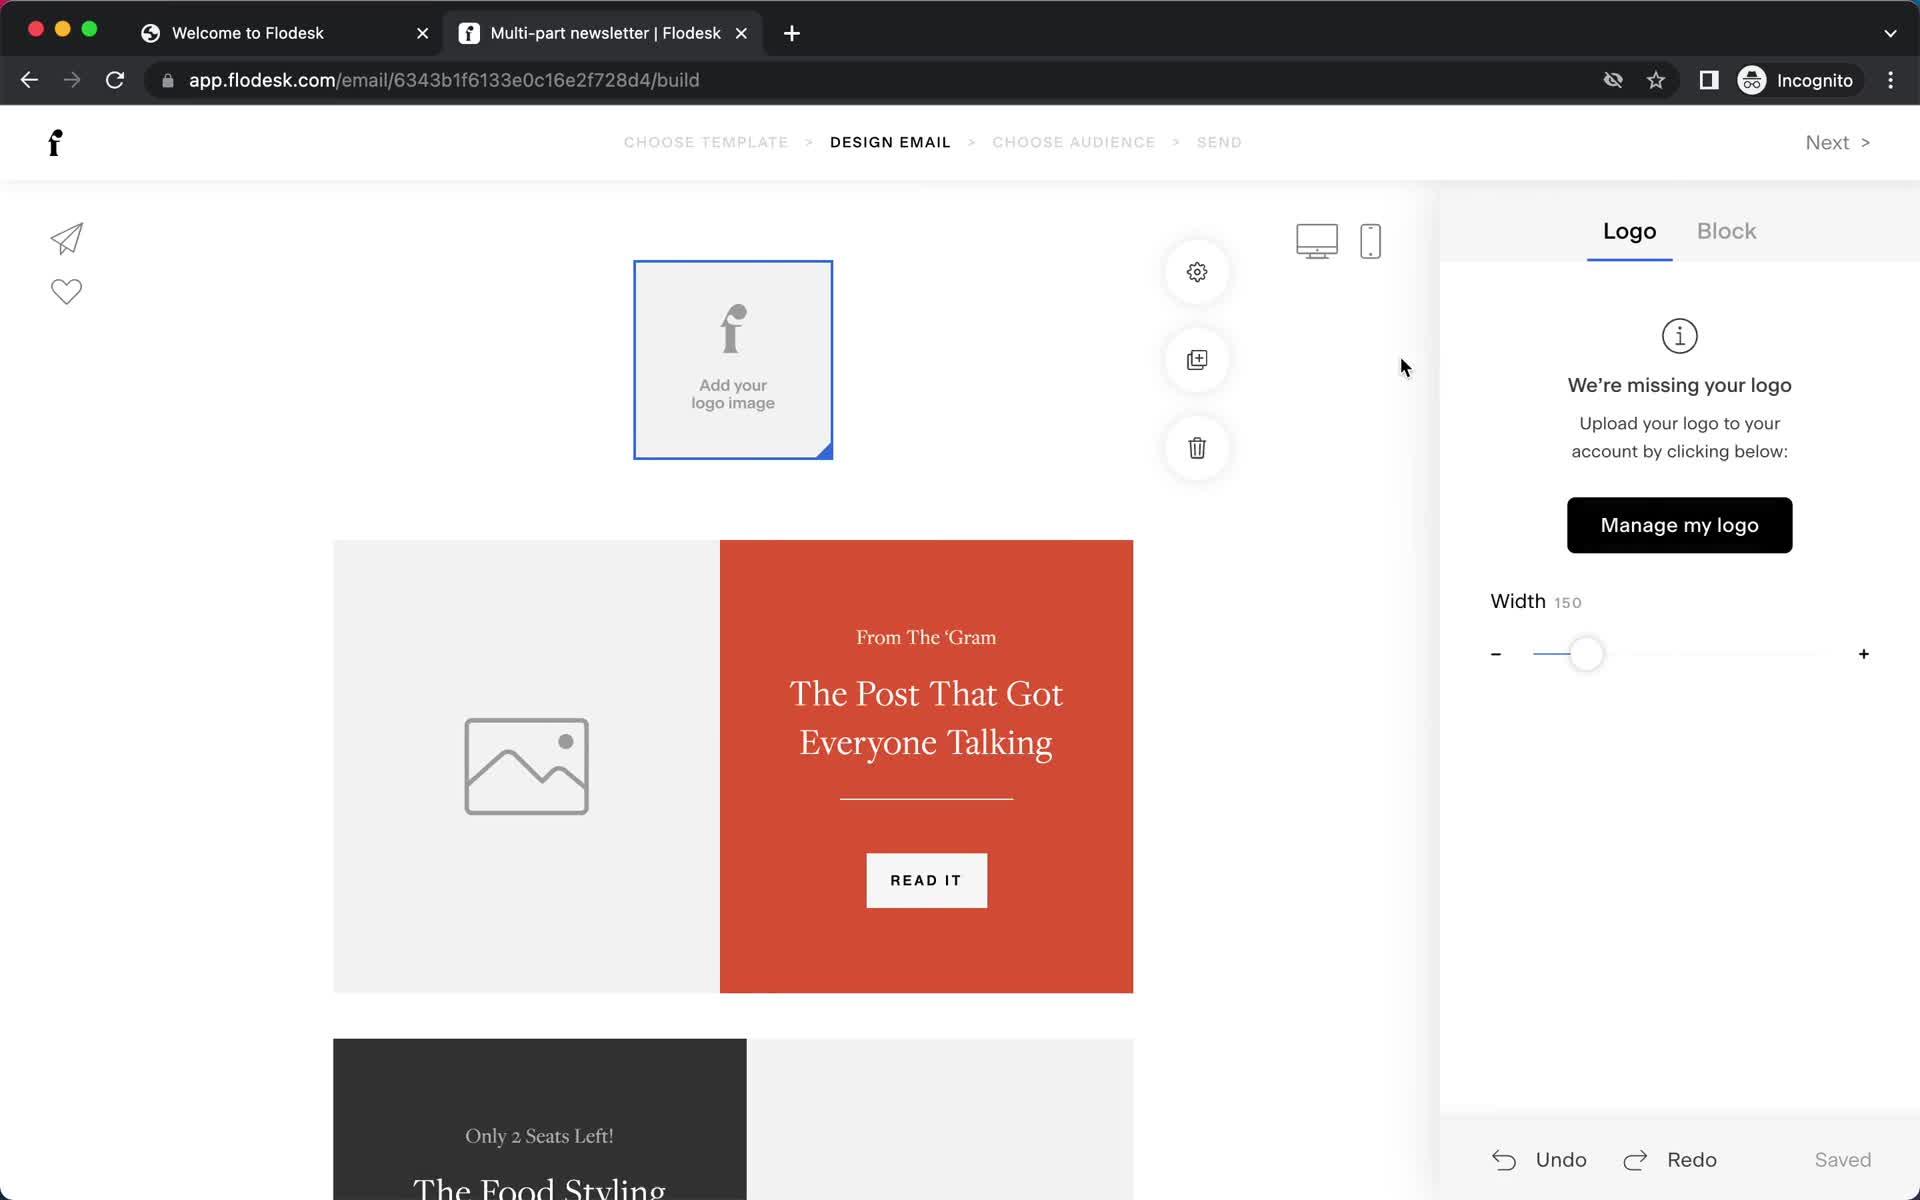
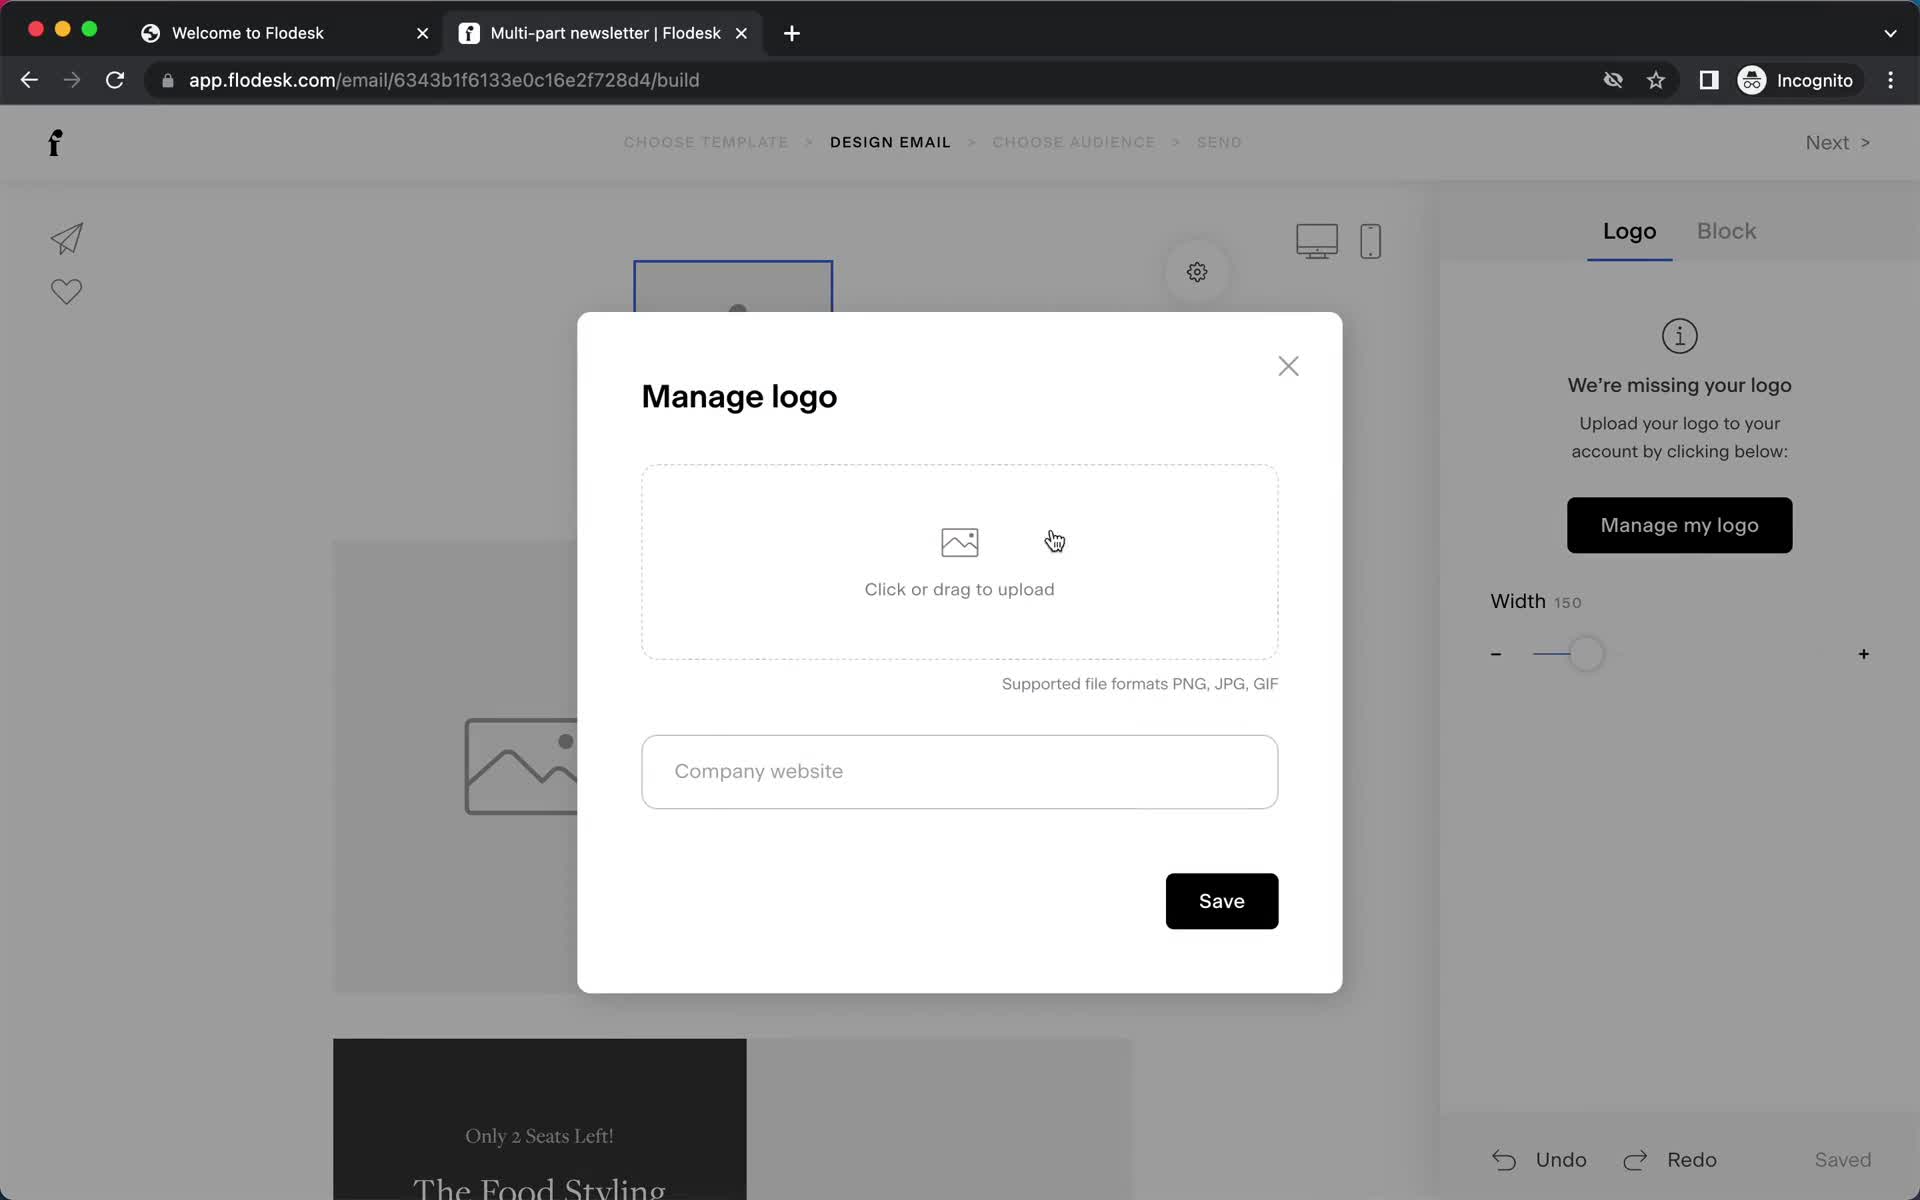
Upload logo
this is title
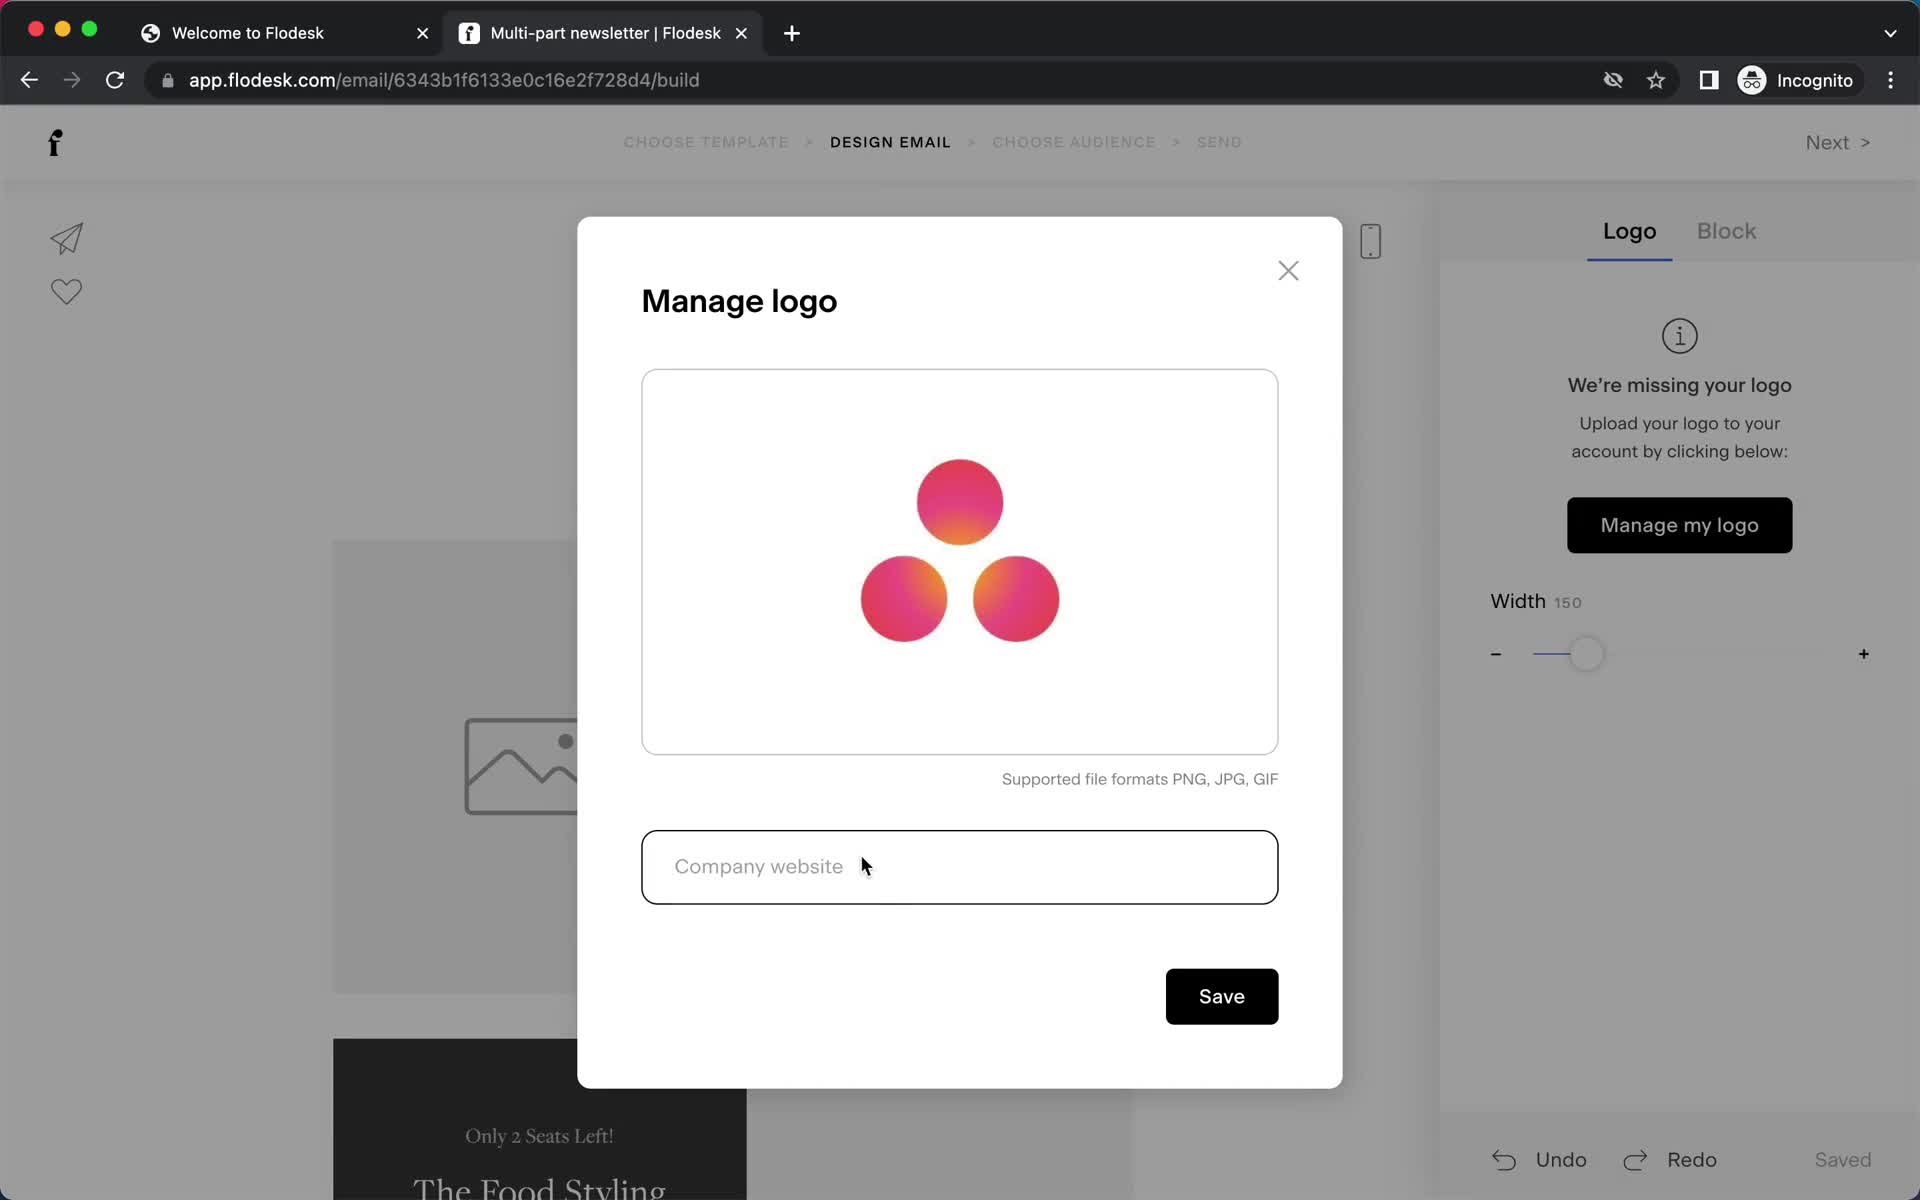
Upload logo
this is title
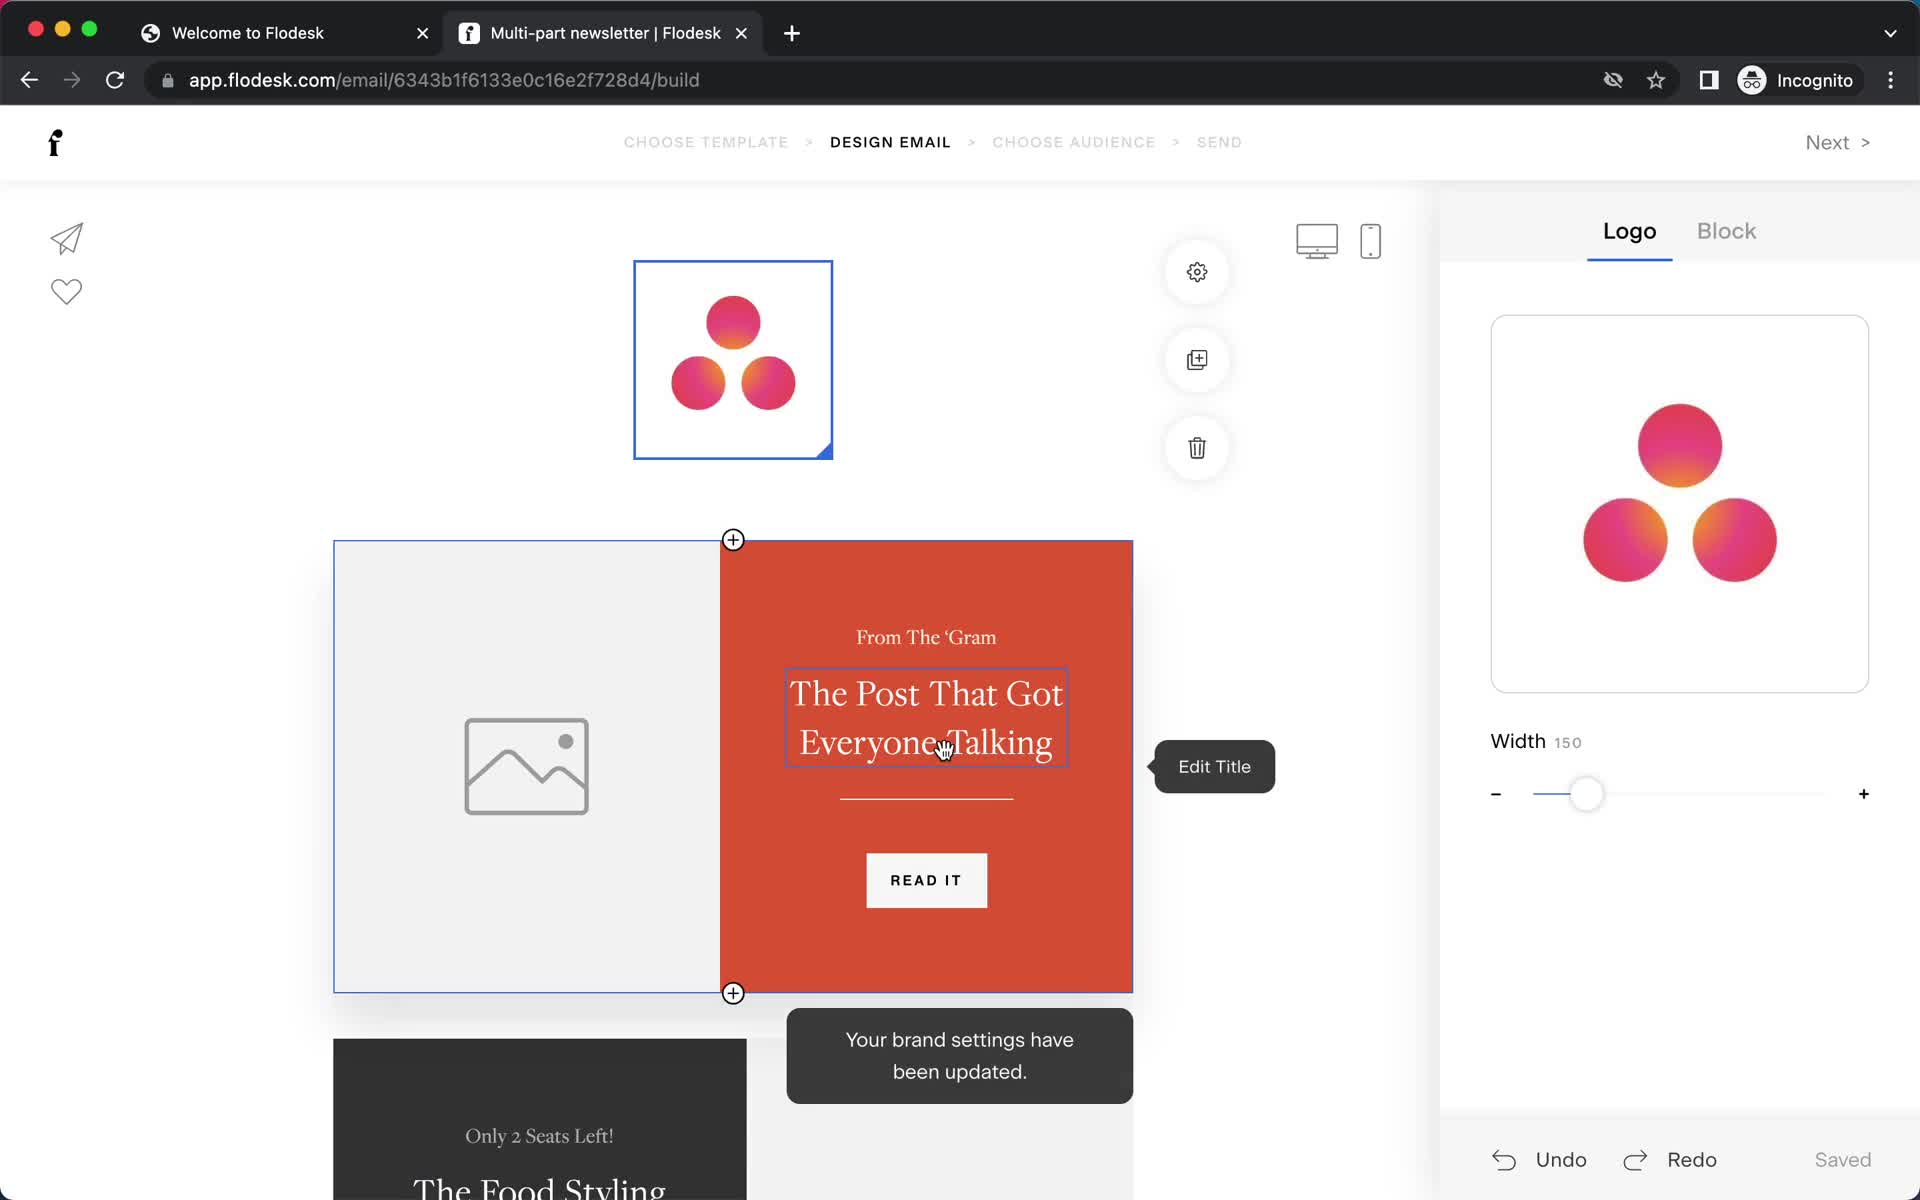
Editor
this is title
Editor
this is title
Editor
this is title
Add element
this is title
Editor
this is title
Guide modal
this is title
Editor
this is title
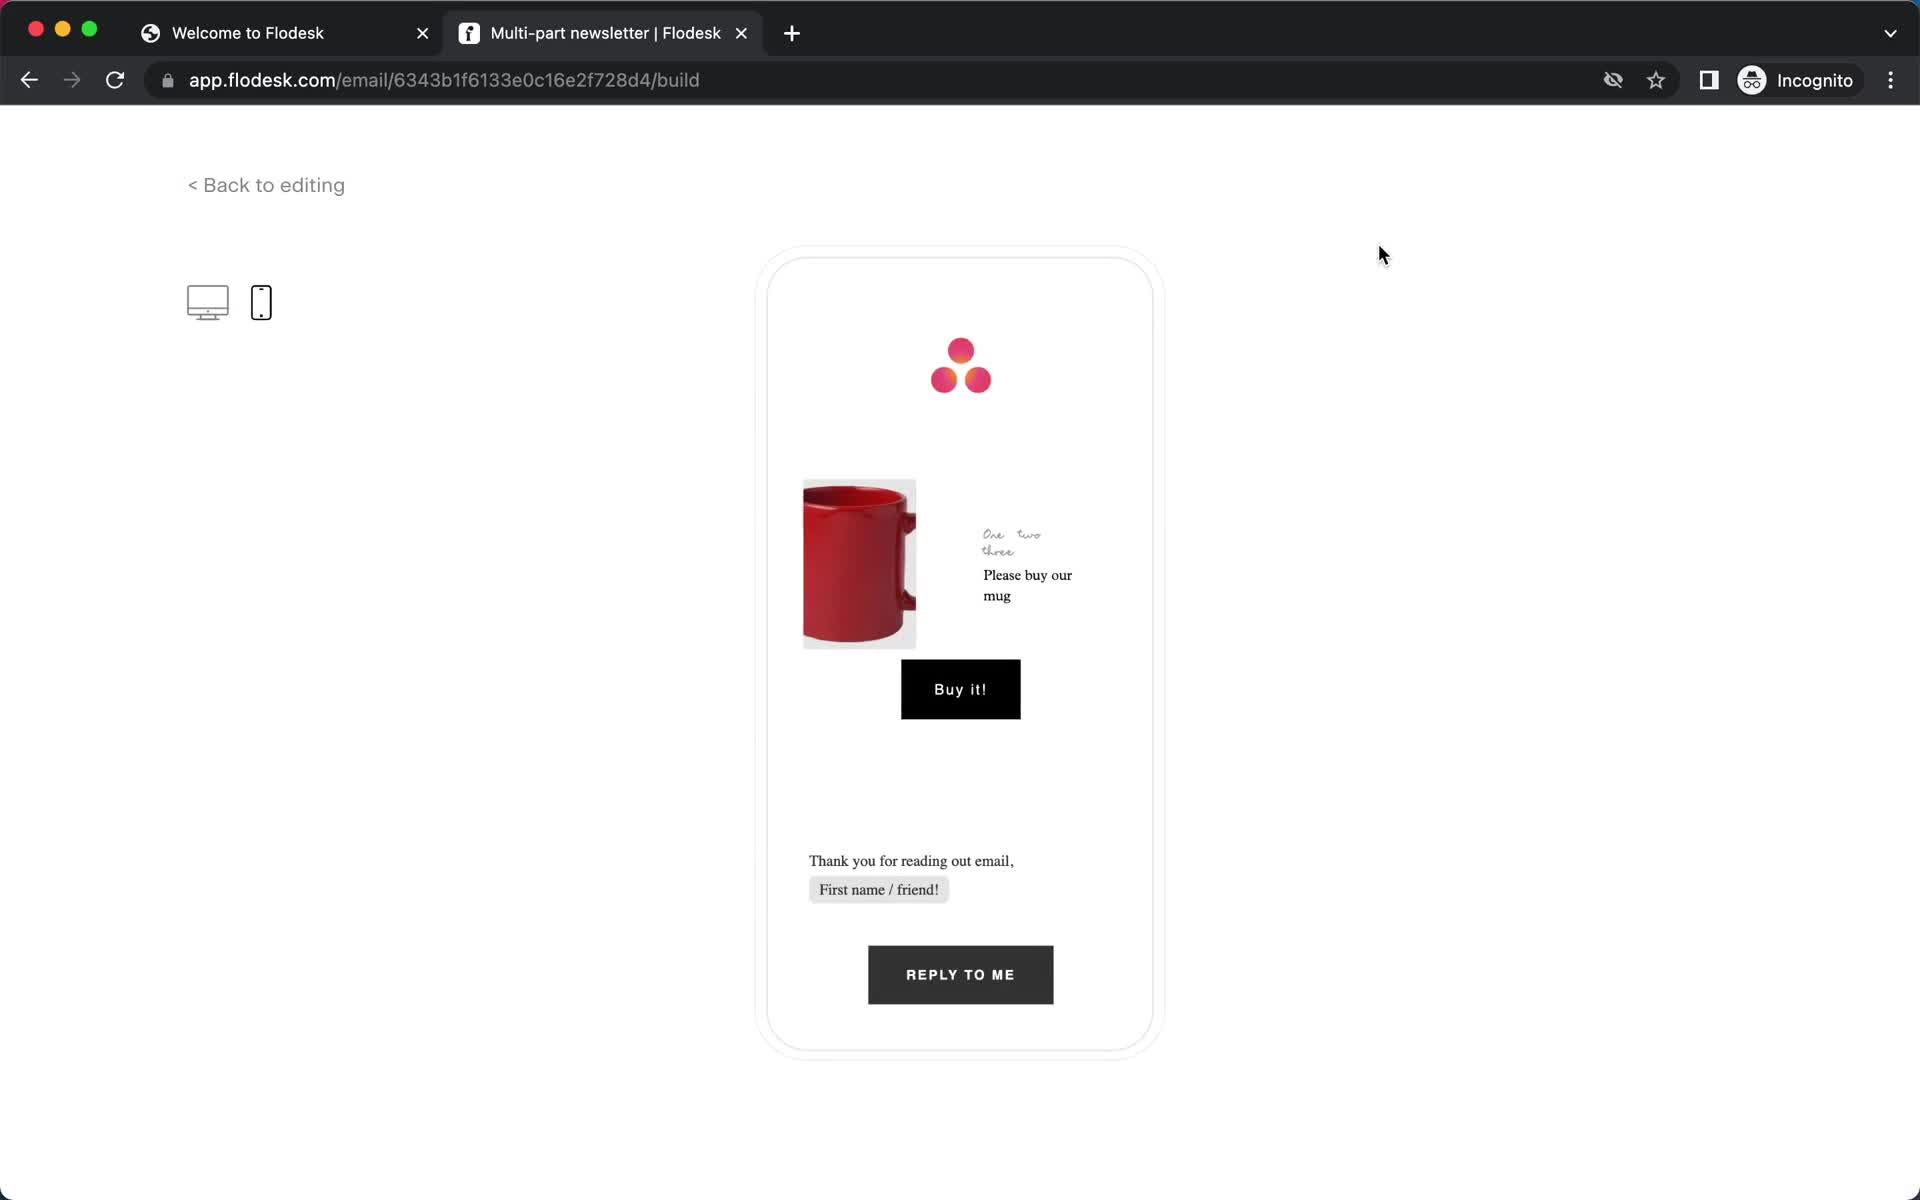
Preview
this is title
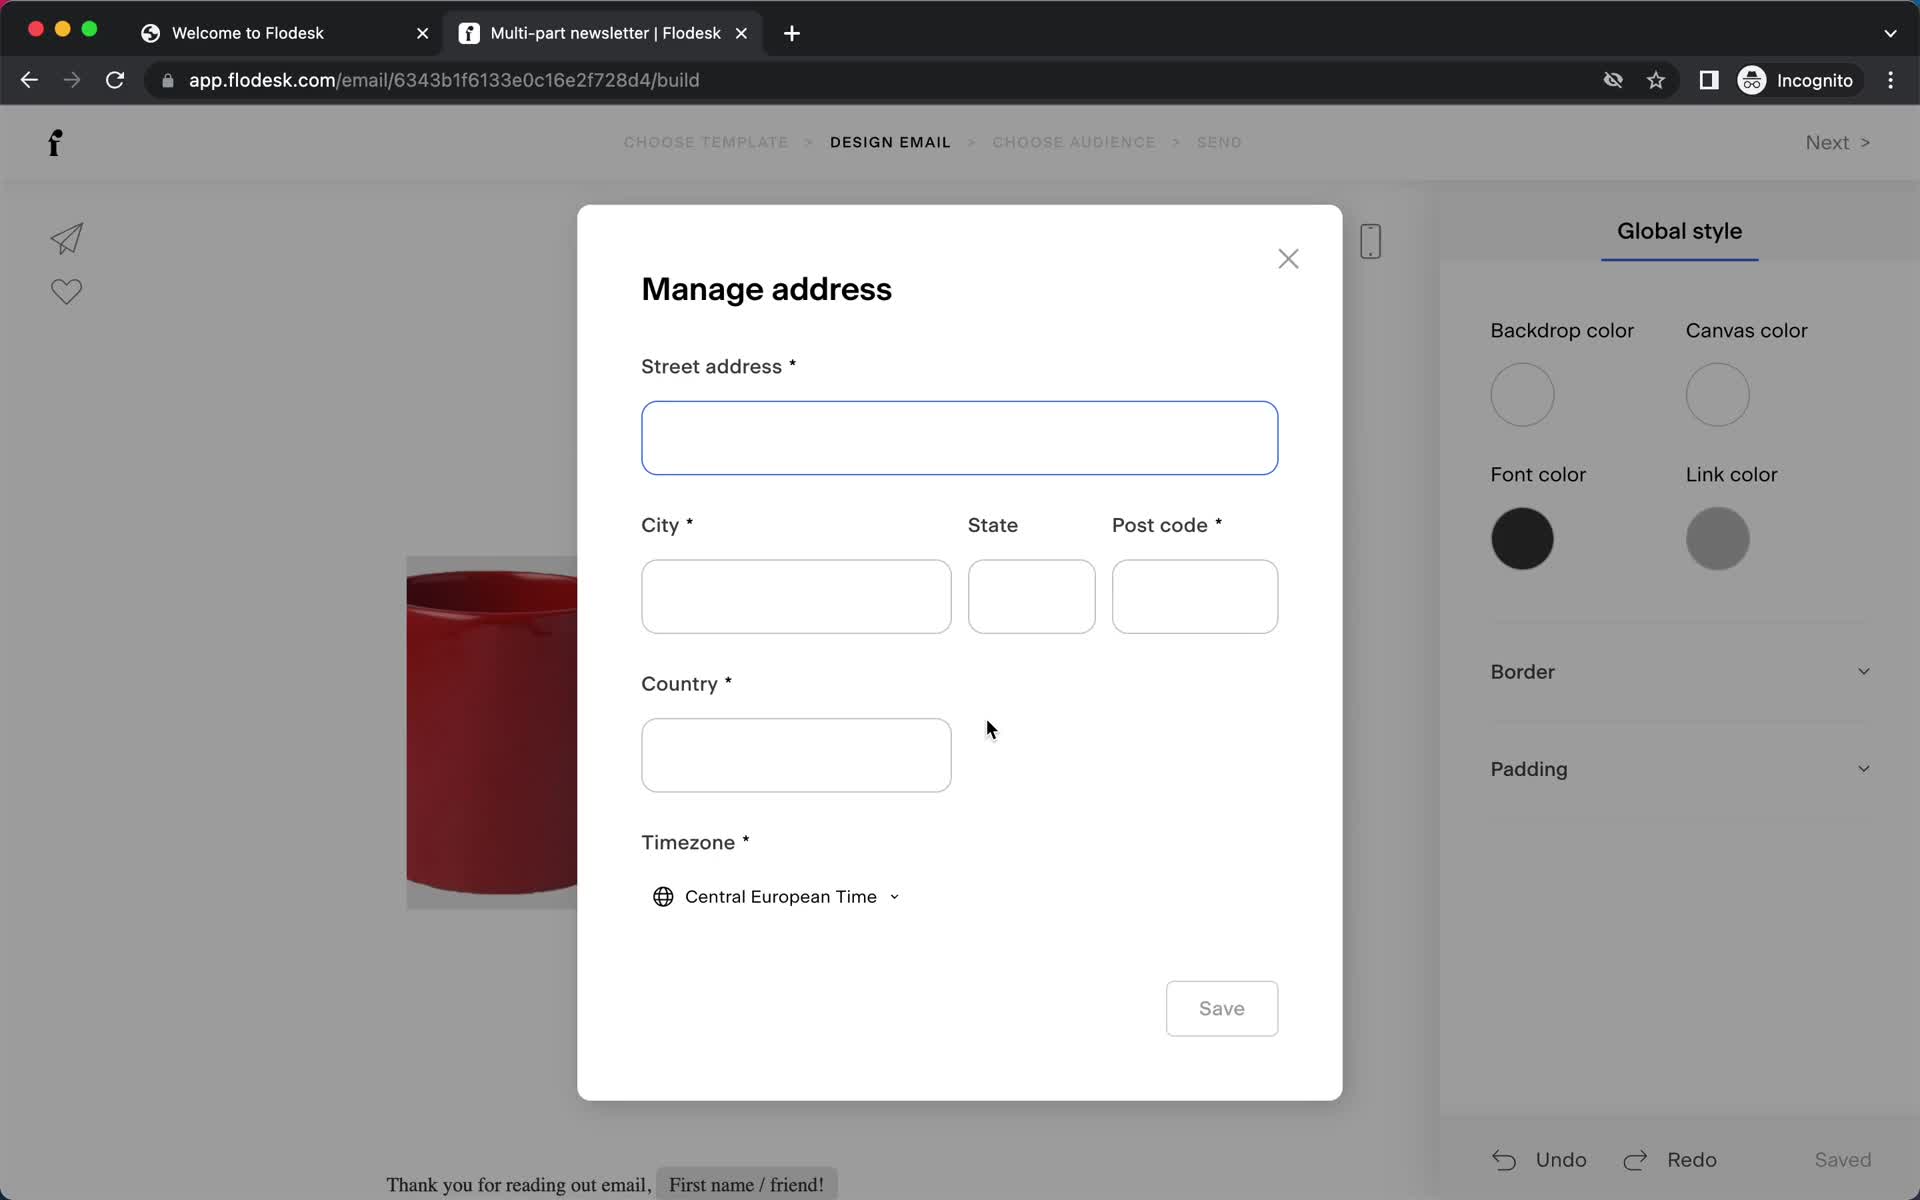
Add address
this is title
Add address
this is title
Changes saved
this is title
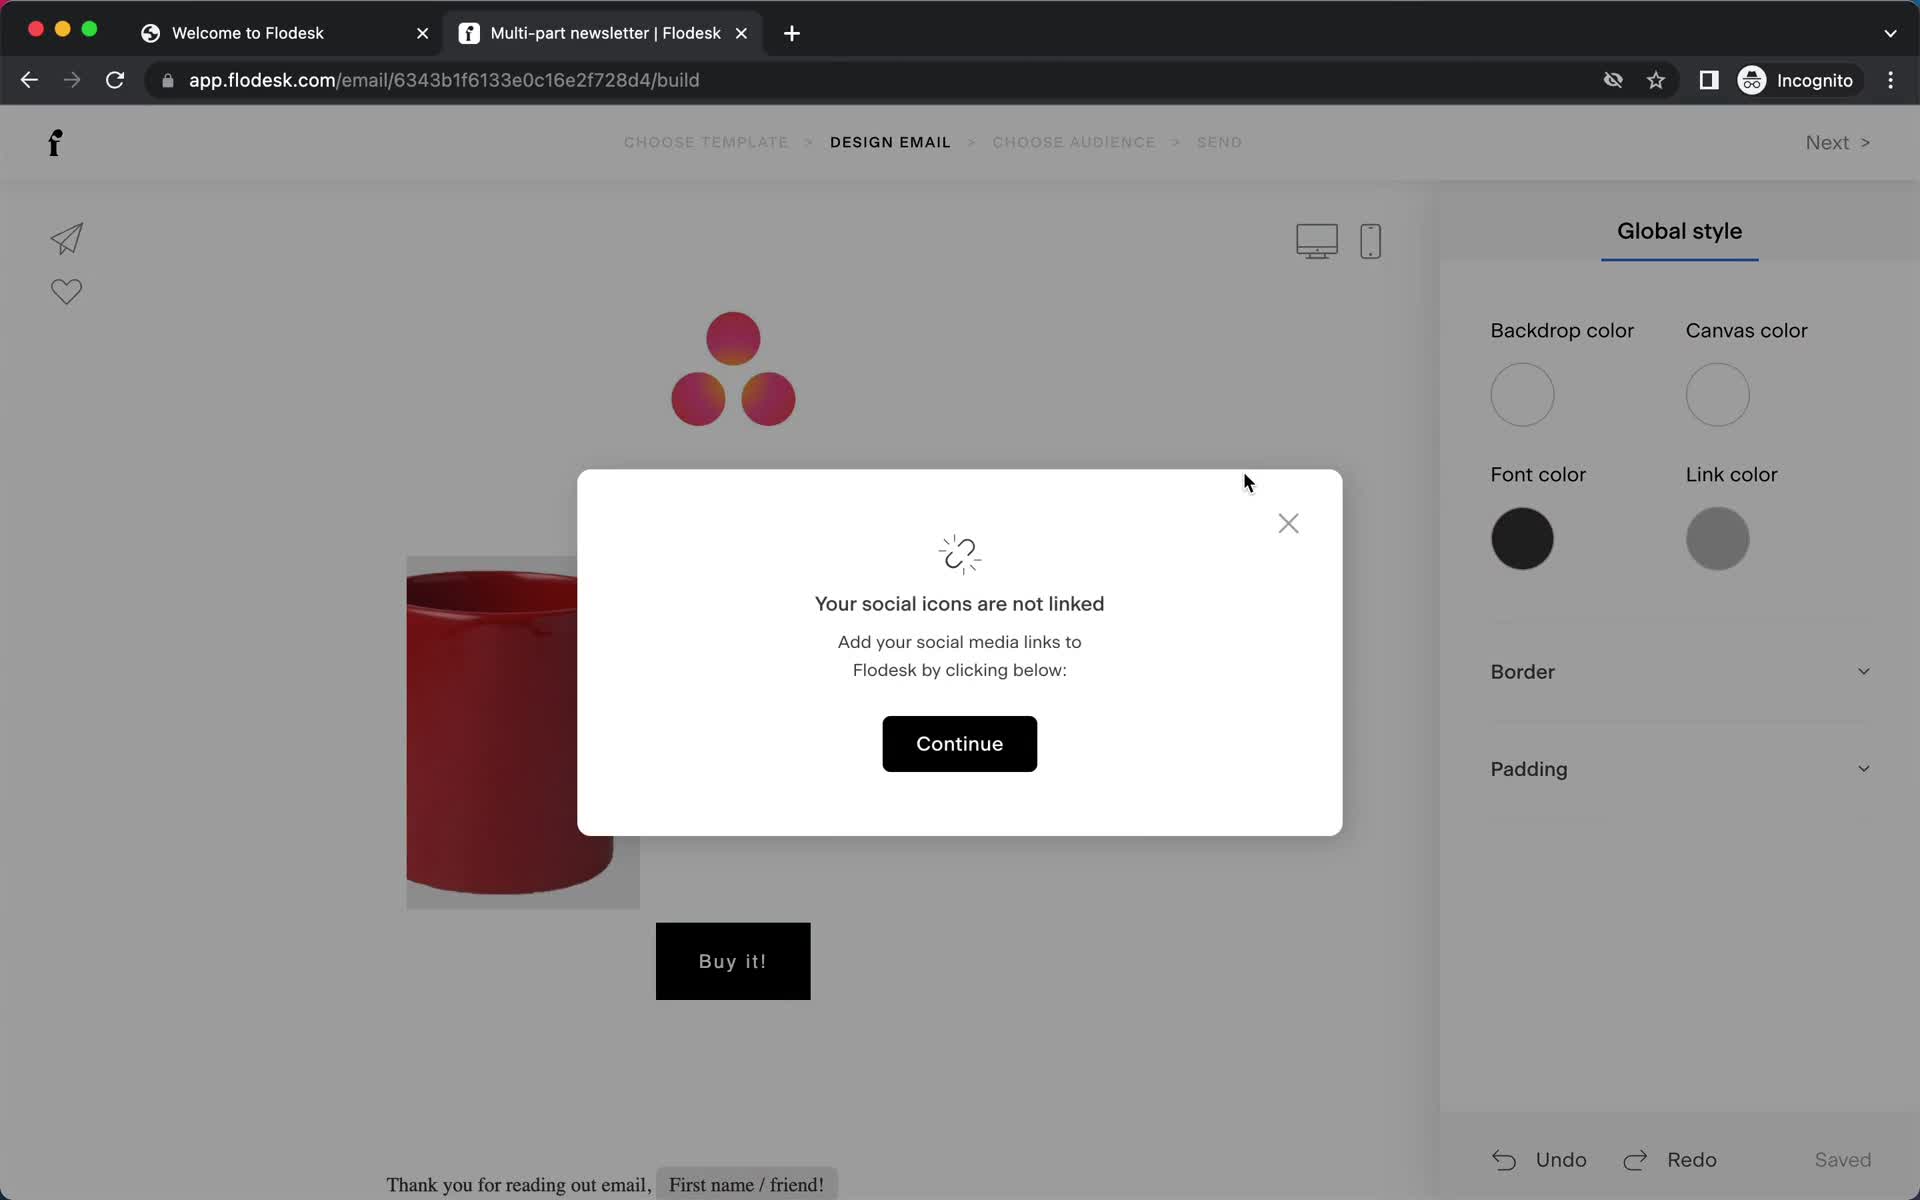
Add social icons
this is title
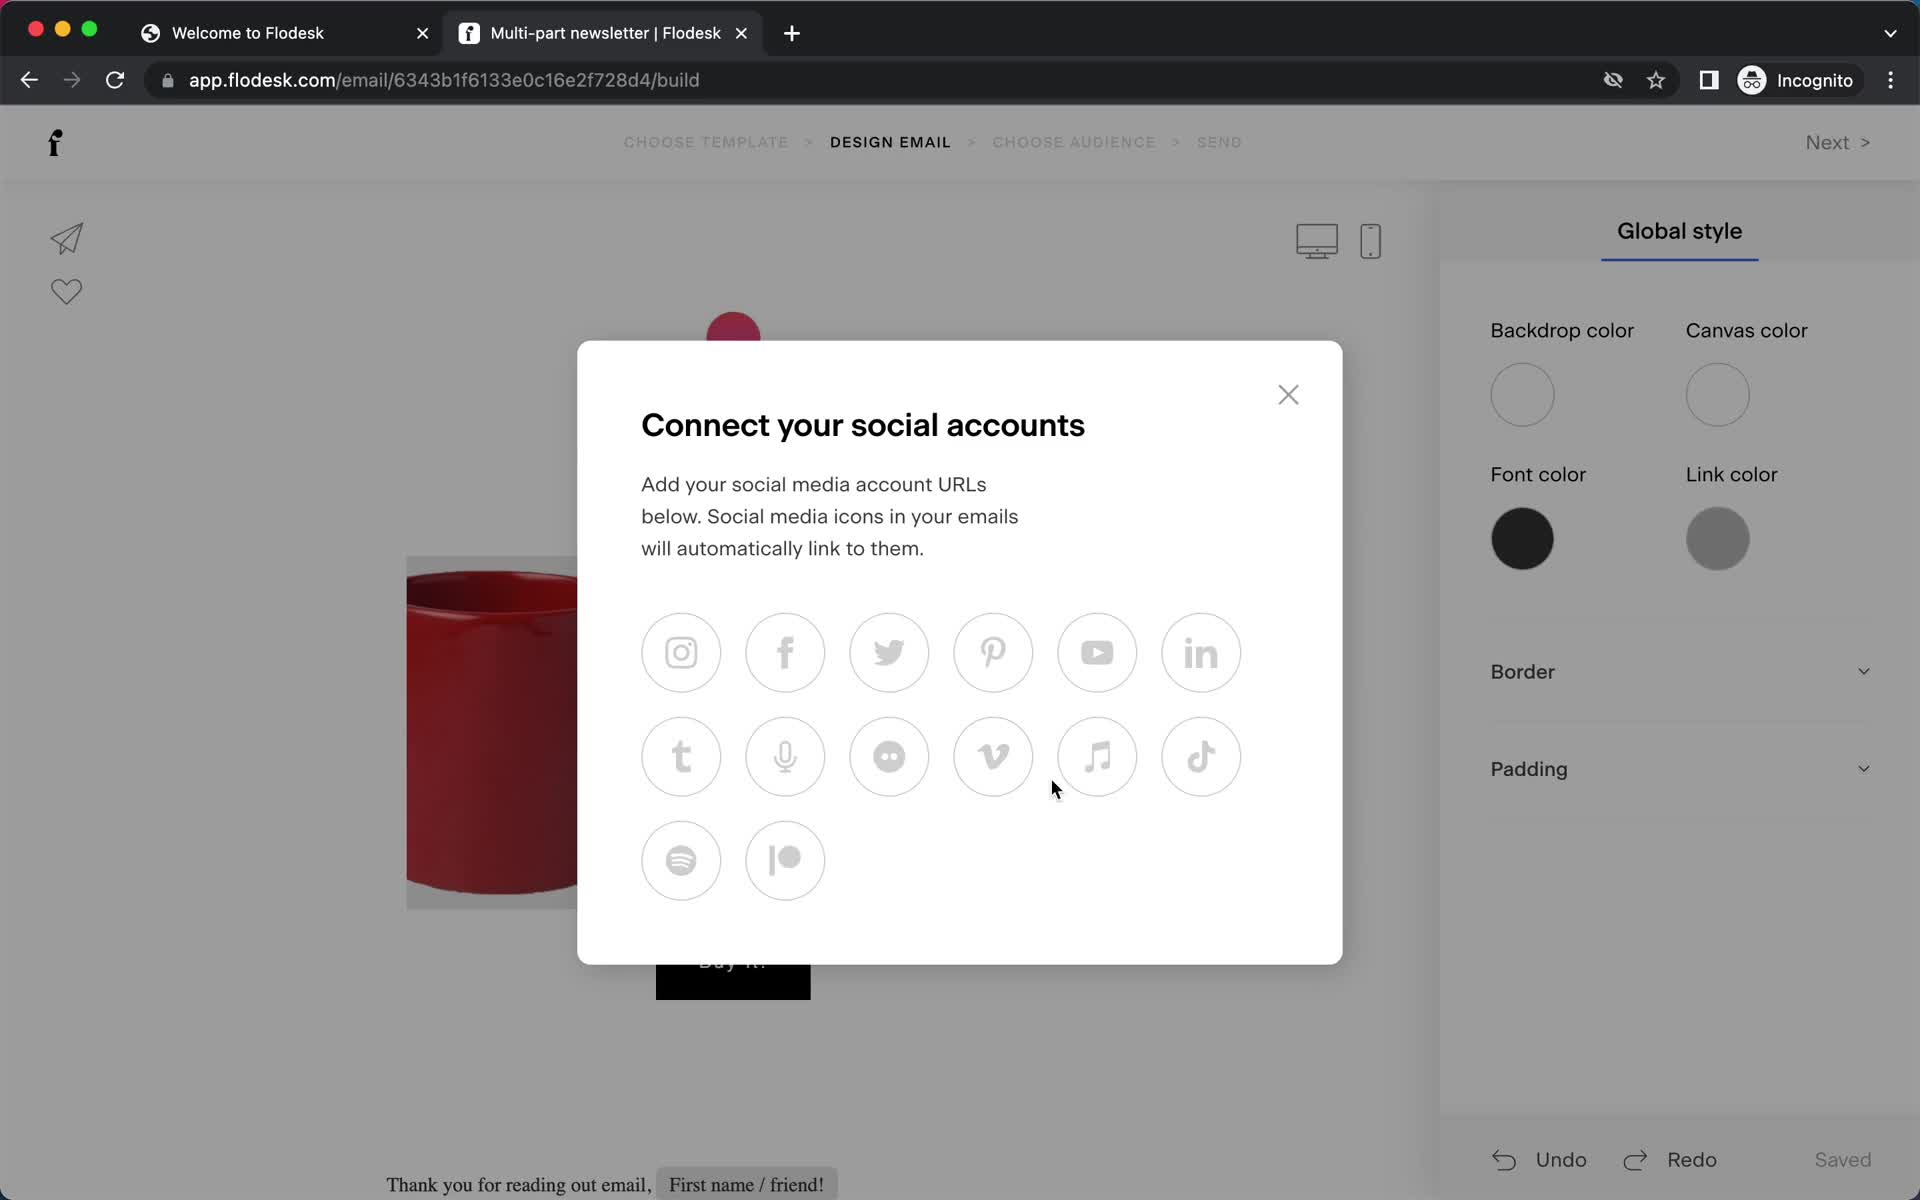
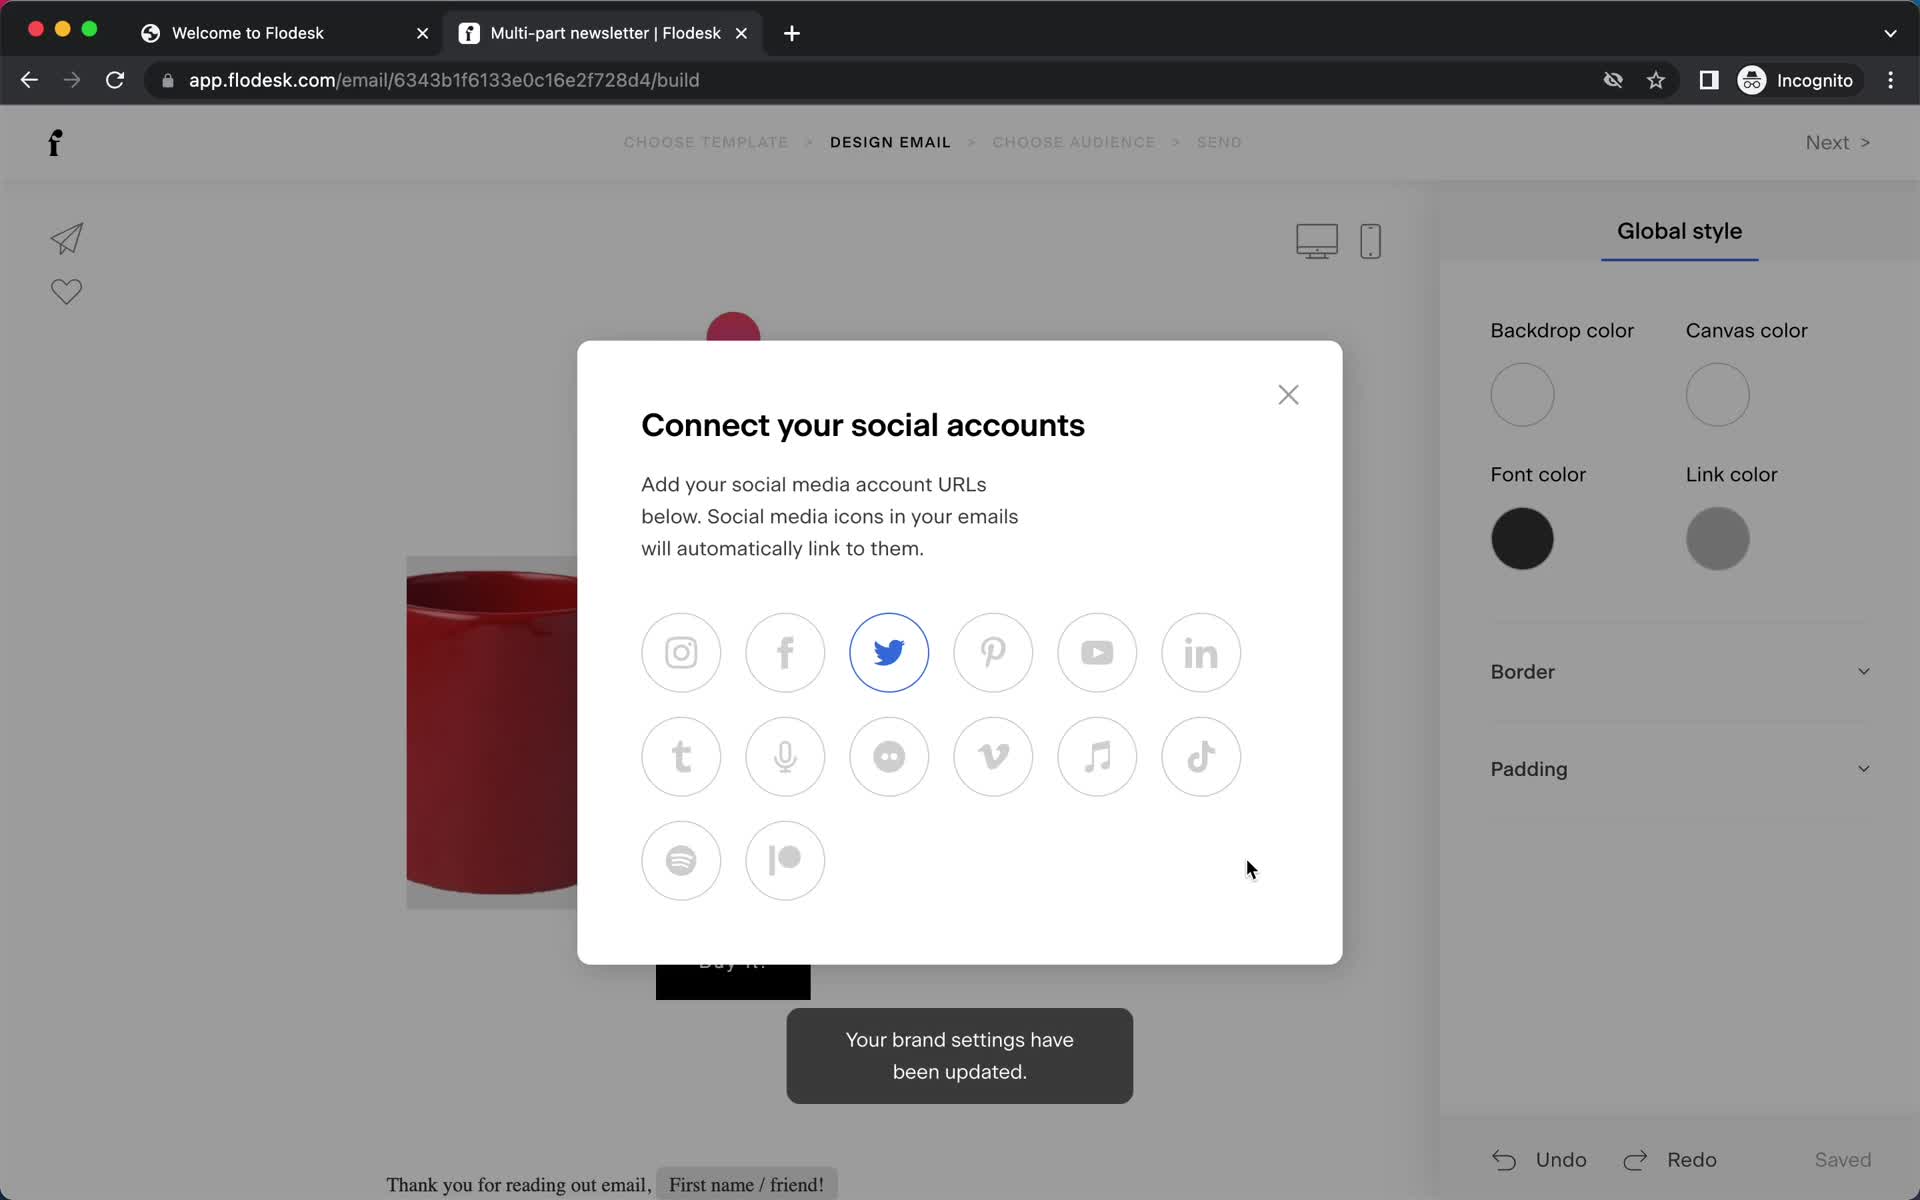
Connect social account
this is title
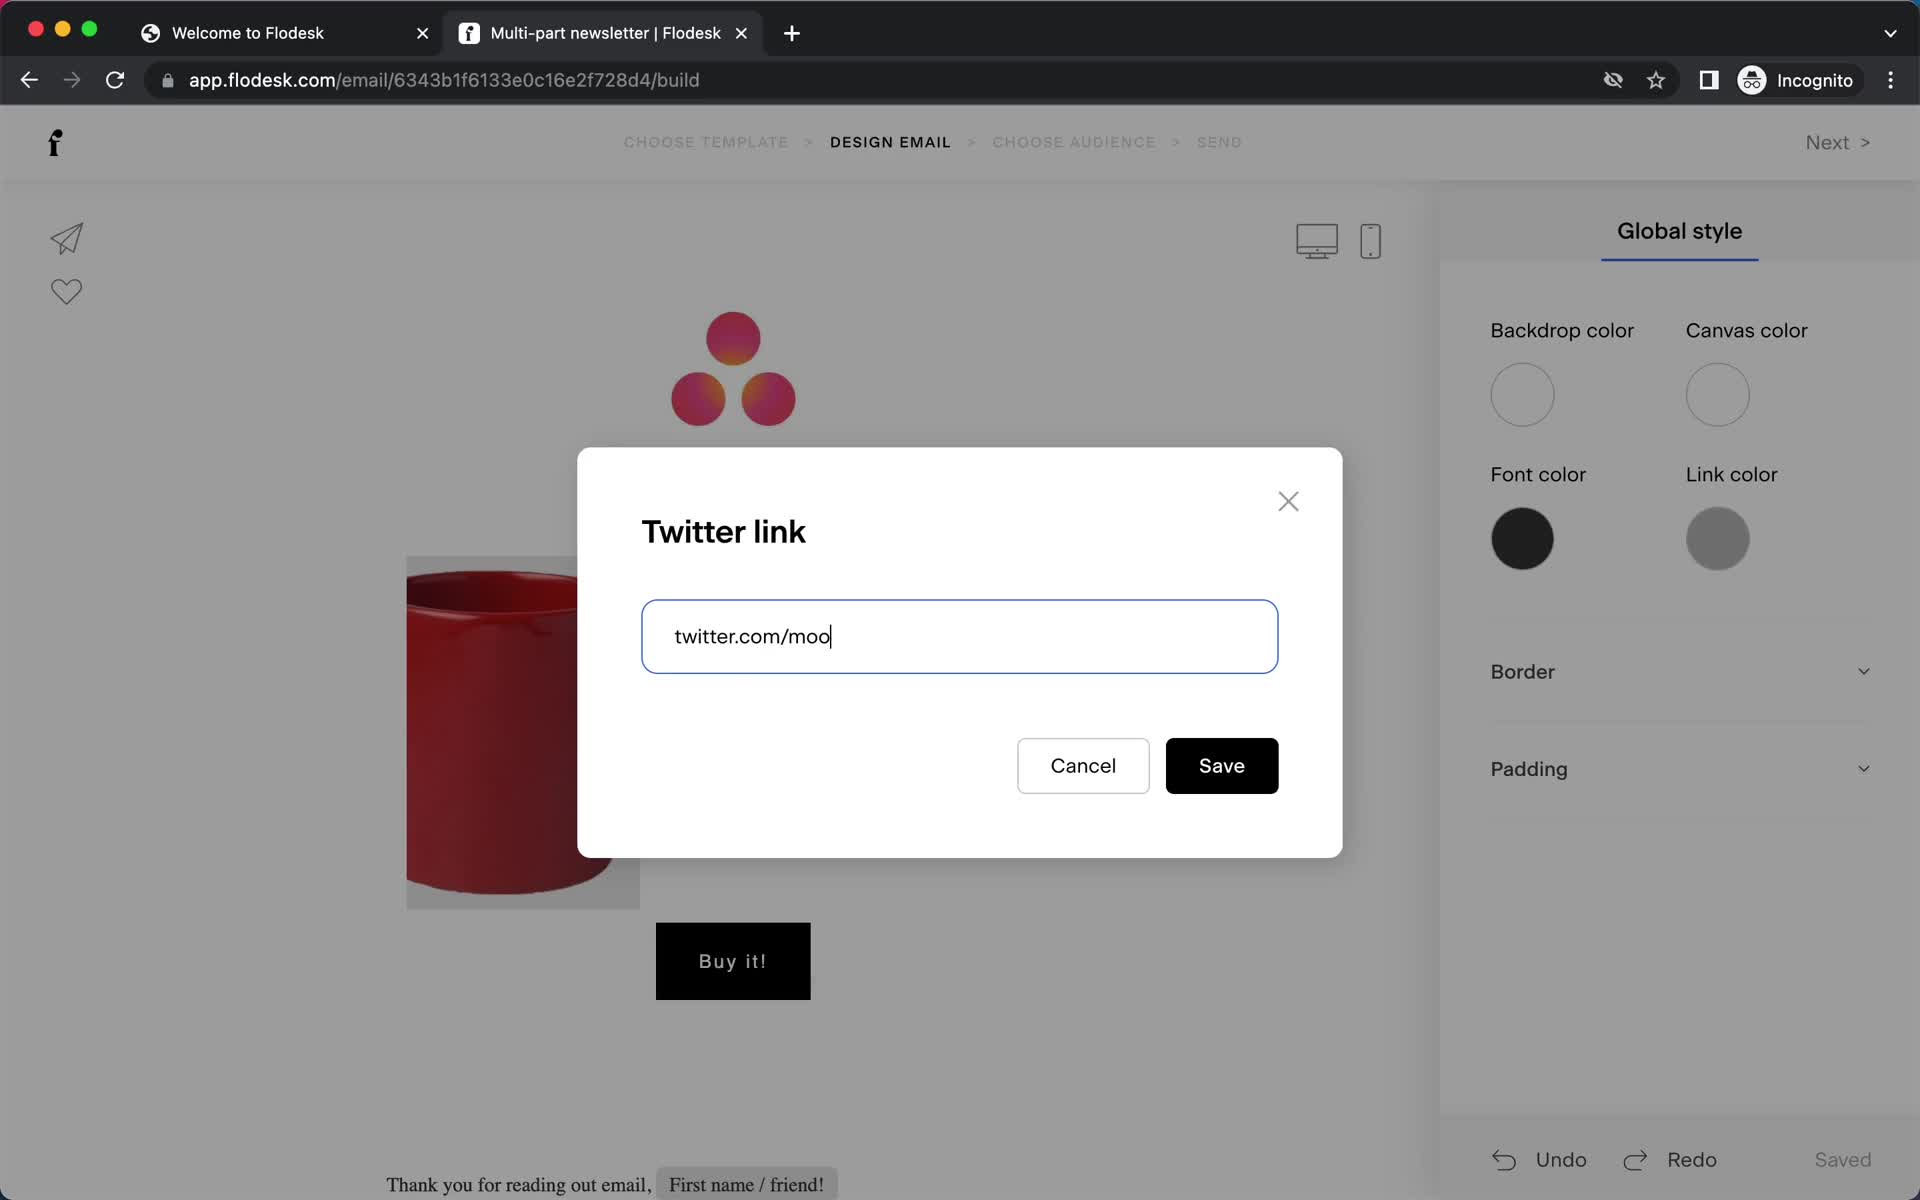
Connect social account
this is title
Connect social account
this is title
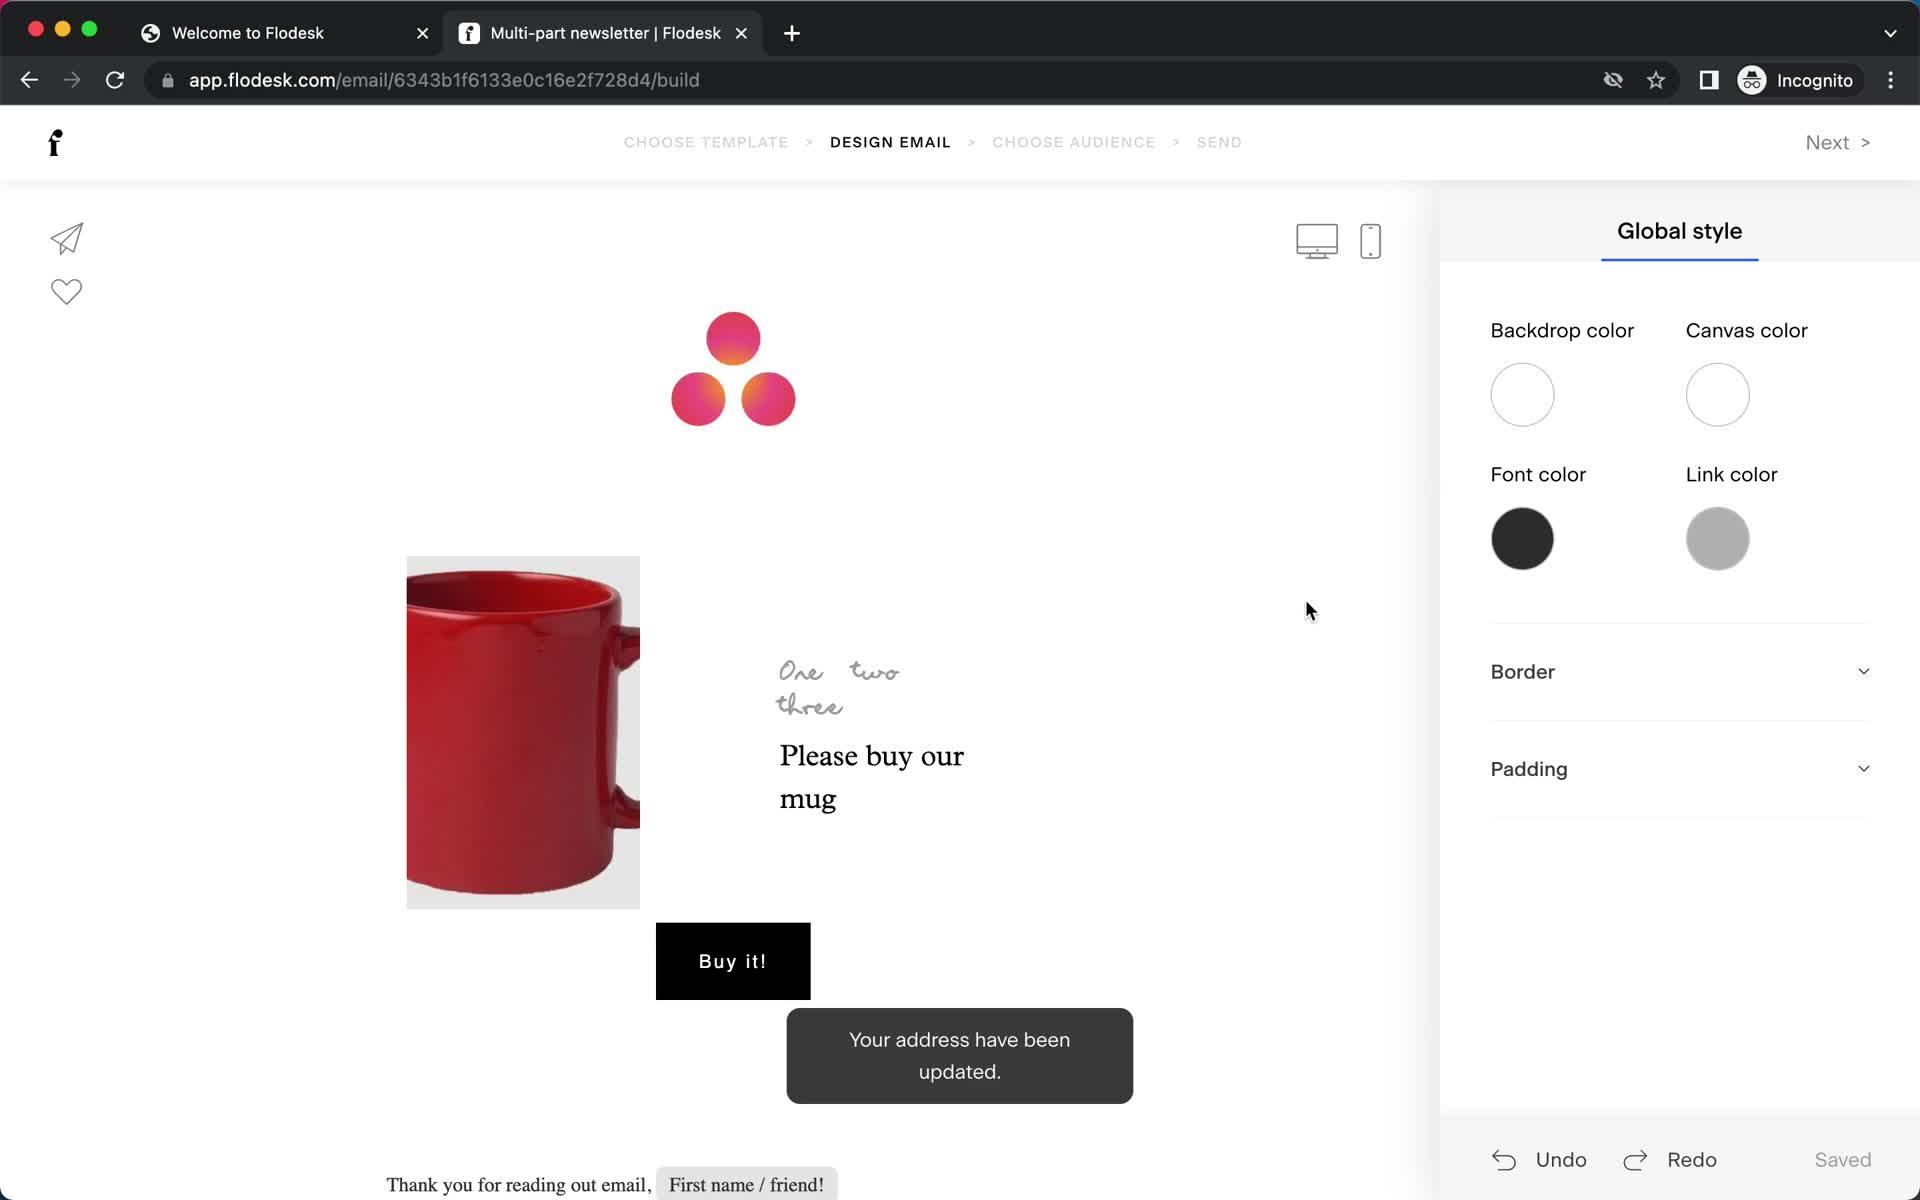
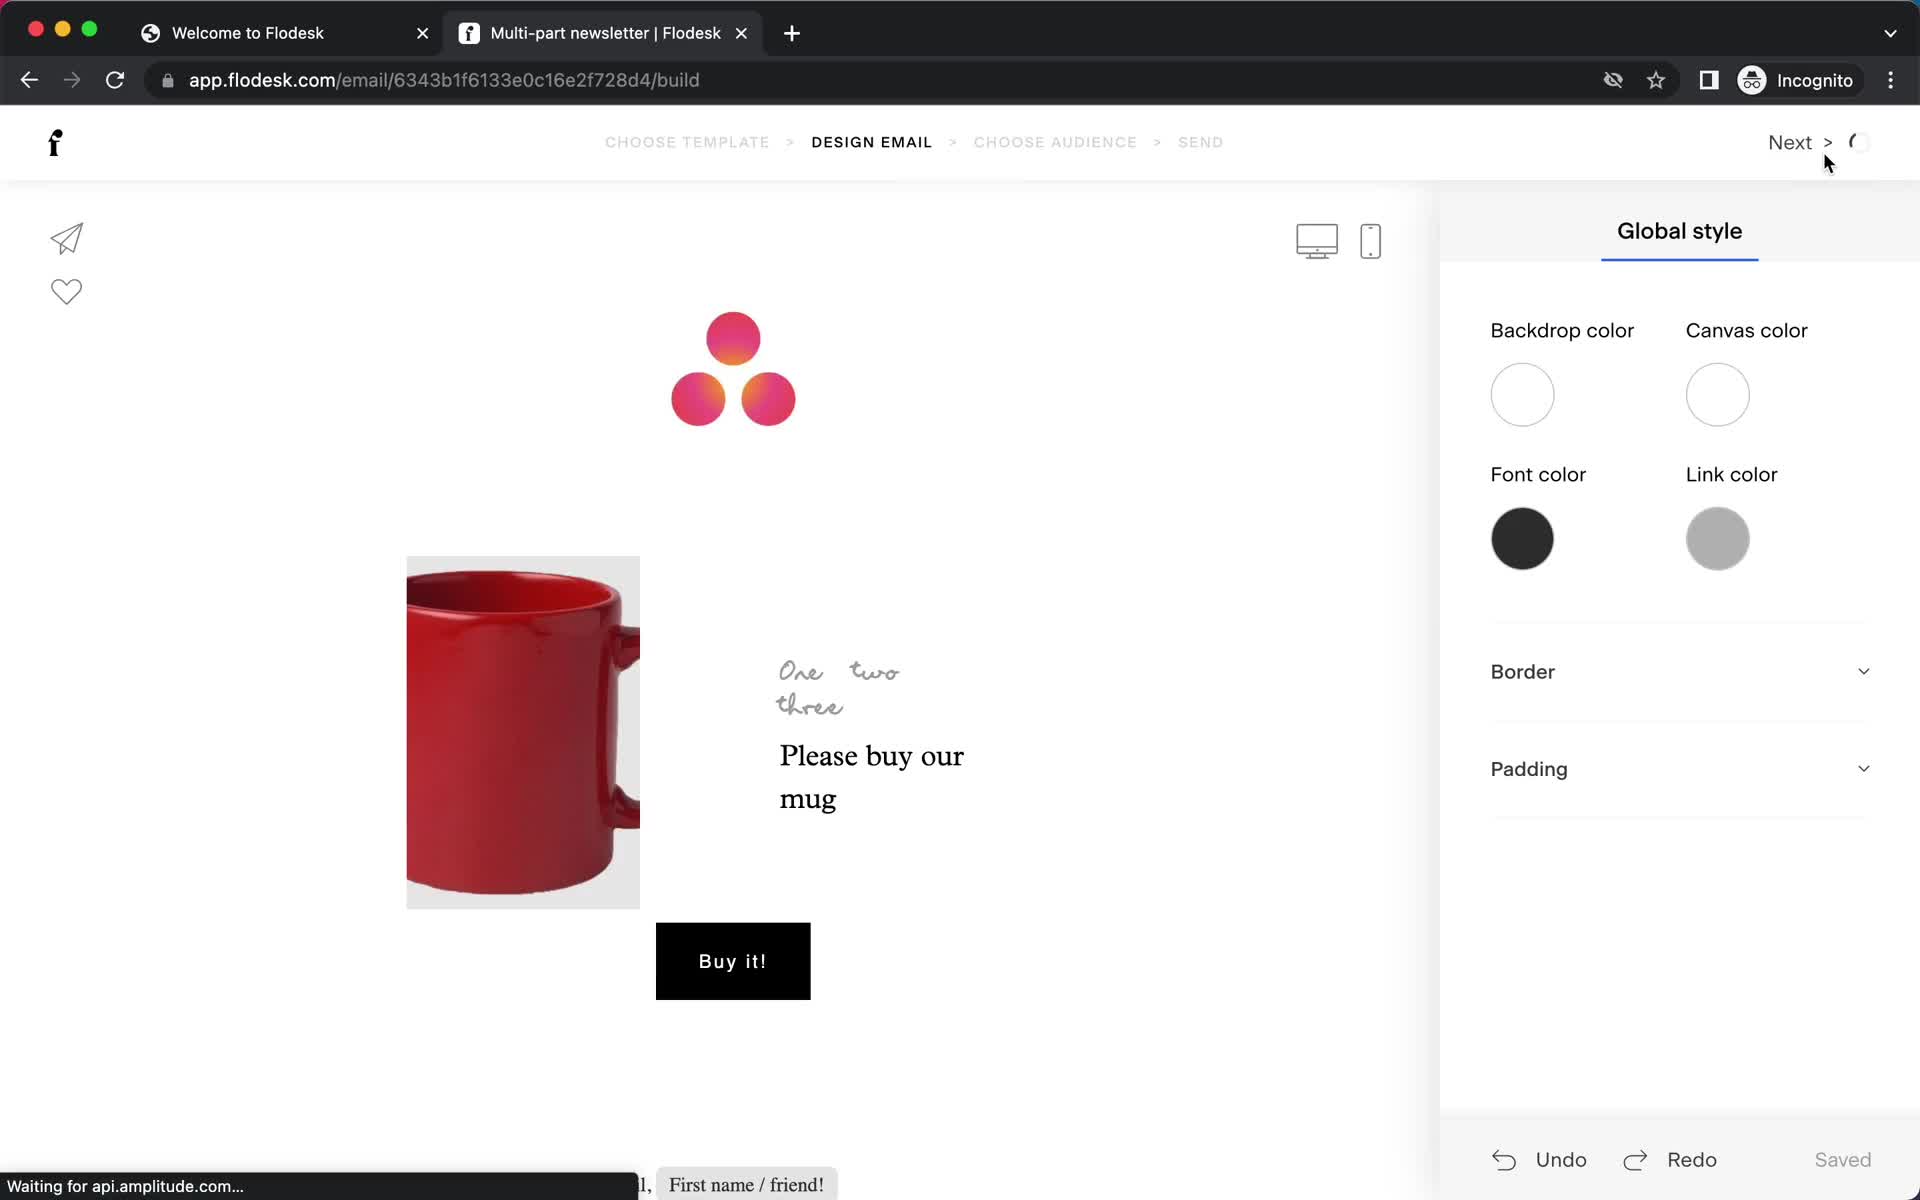
Editor
this is title
Add details
this is title
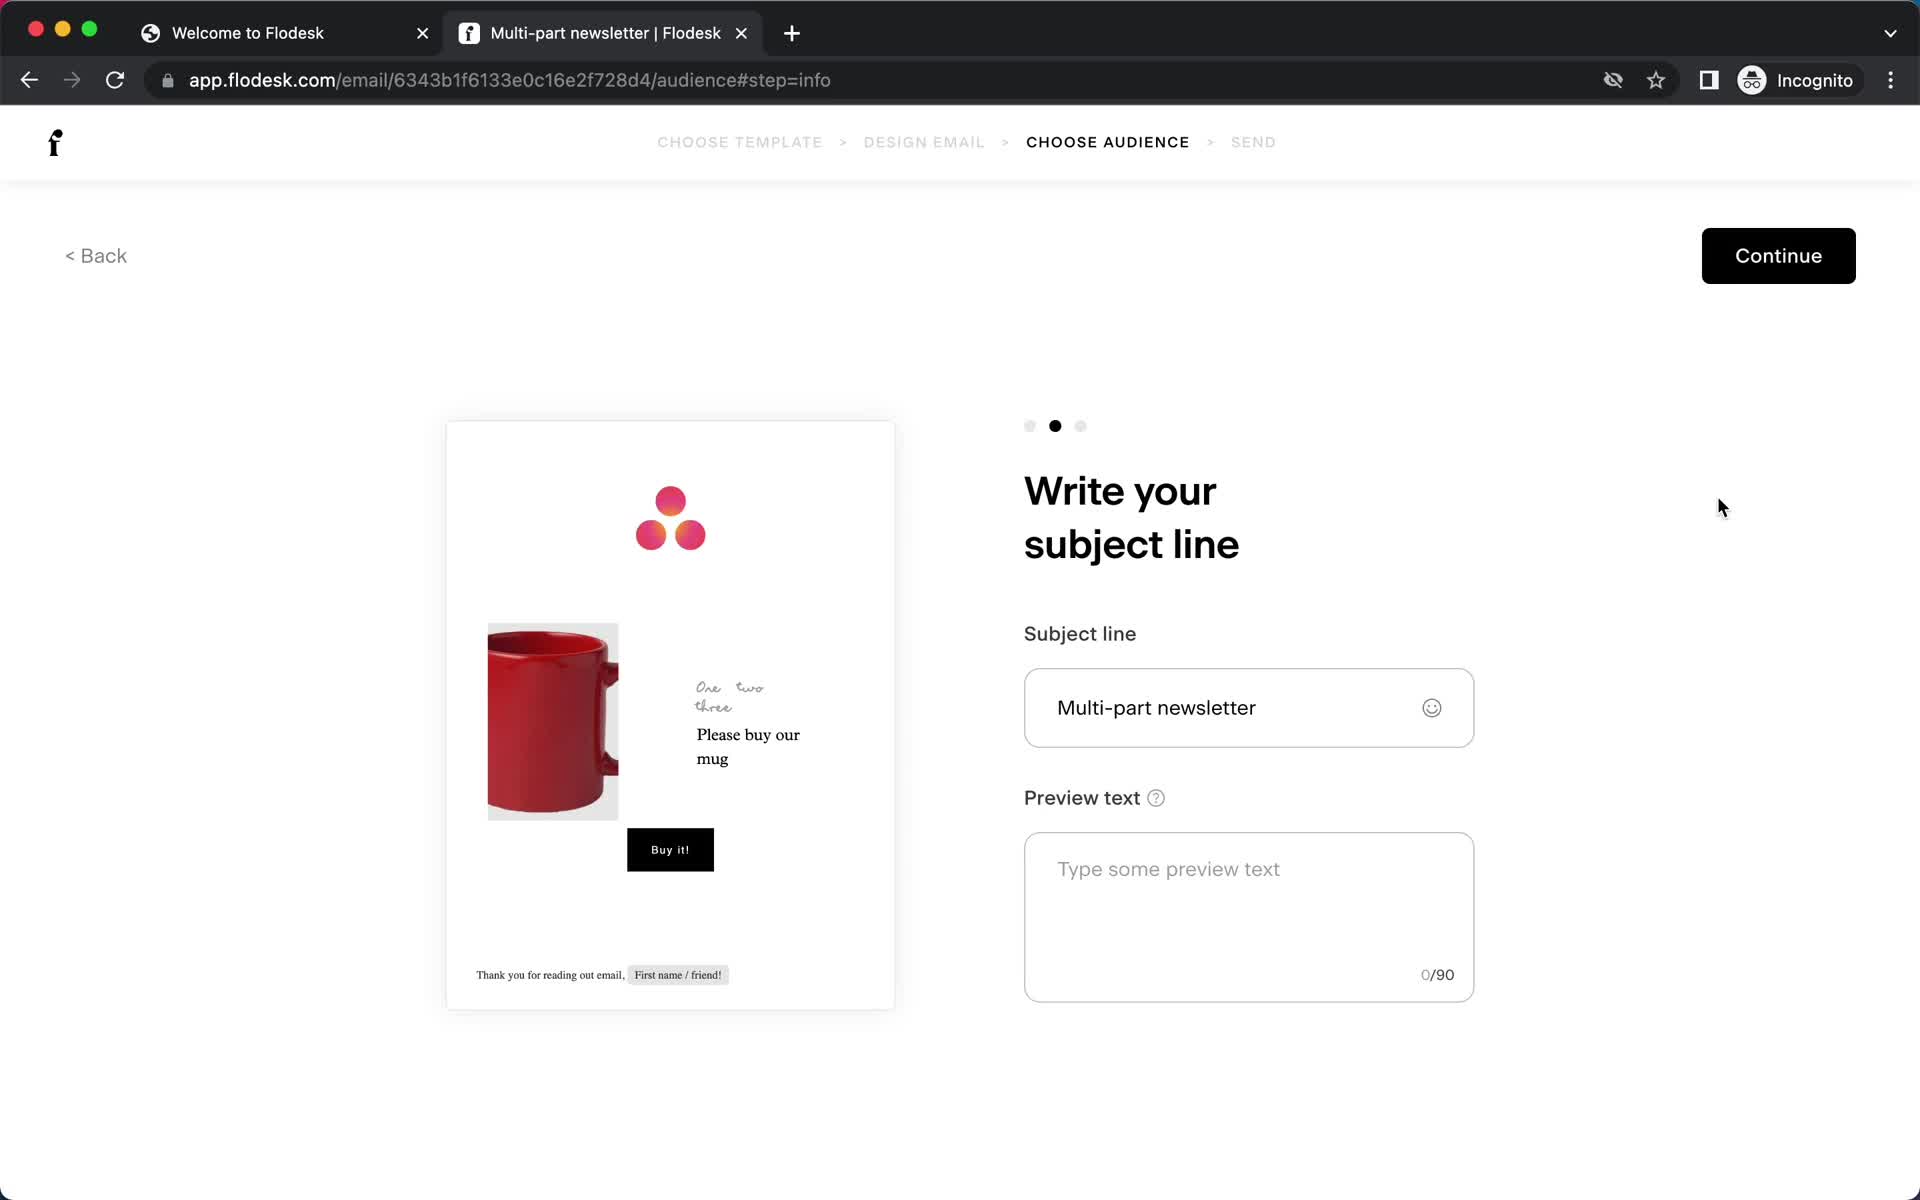
Add subject
this is title
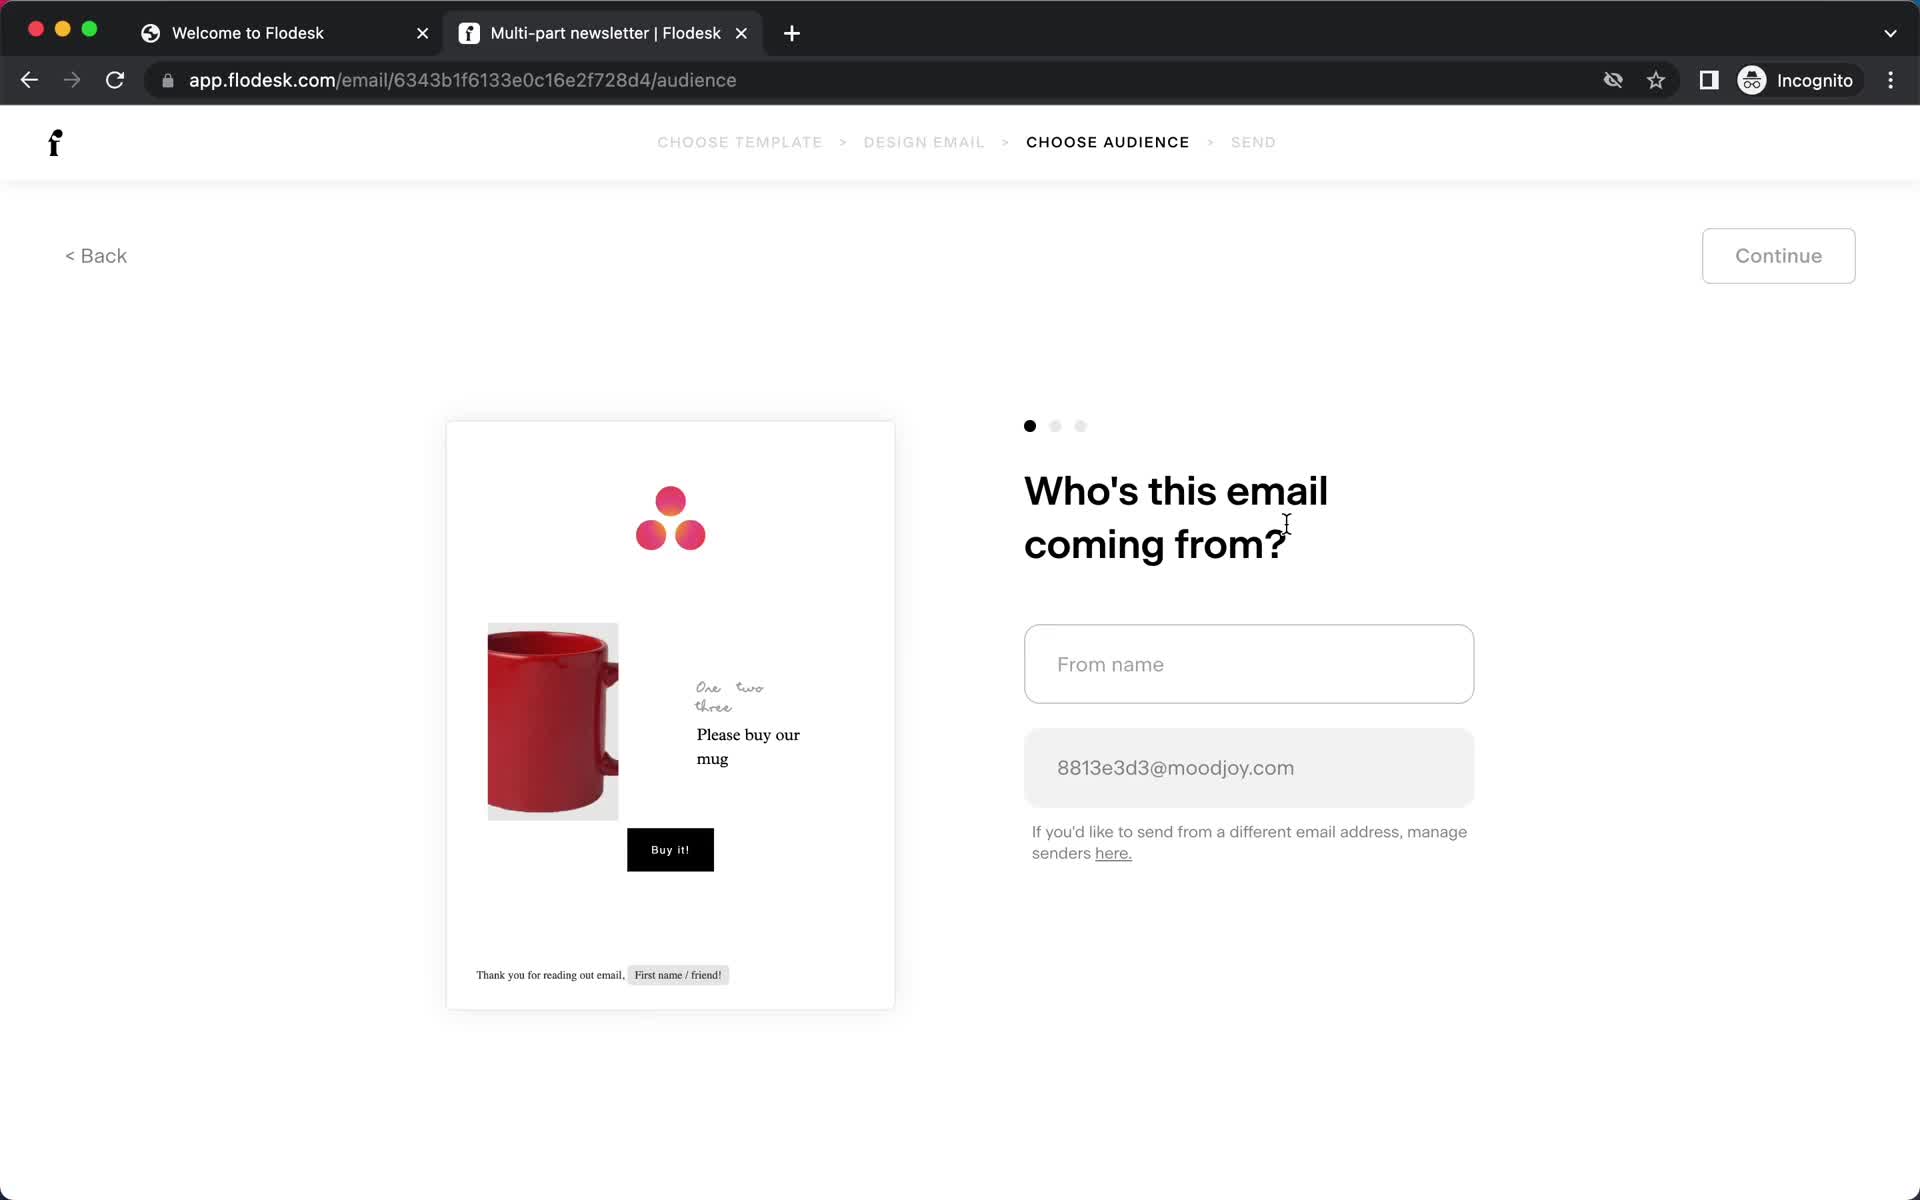
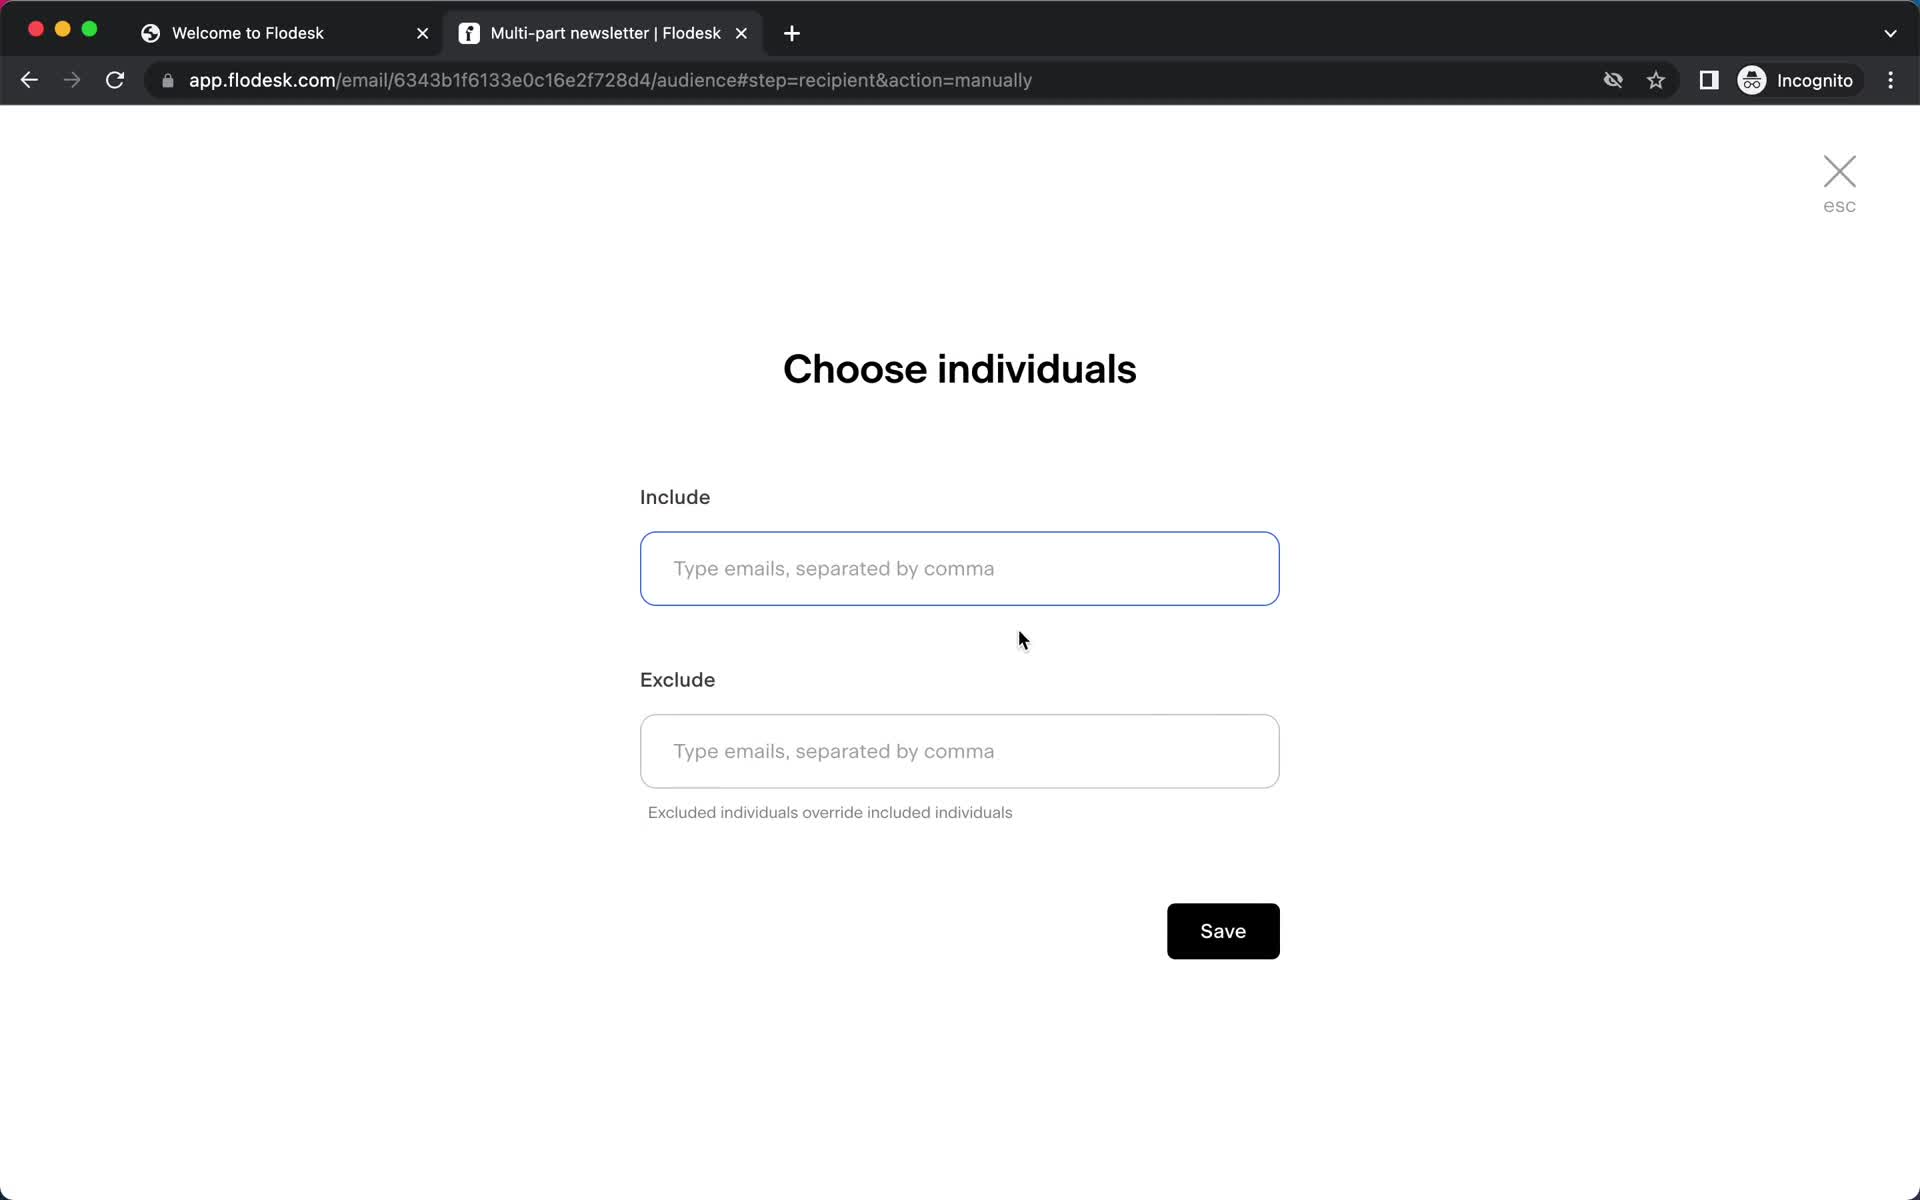
Add recipients
this is title
Add recipients
this is title
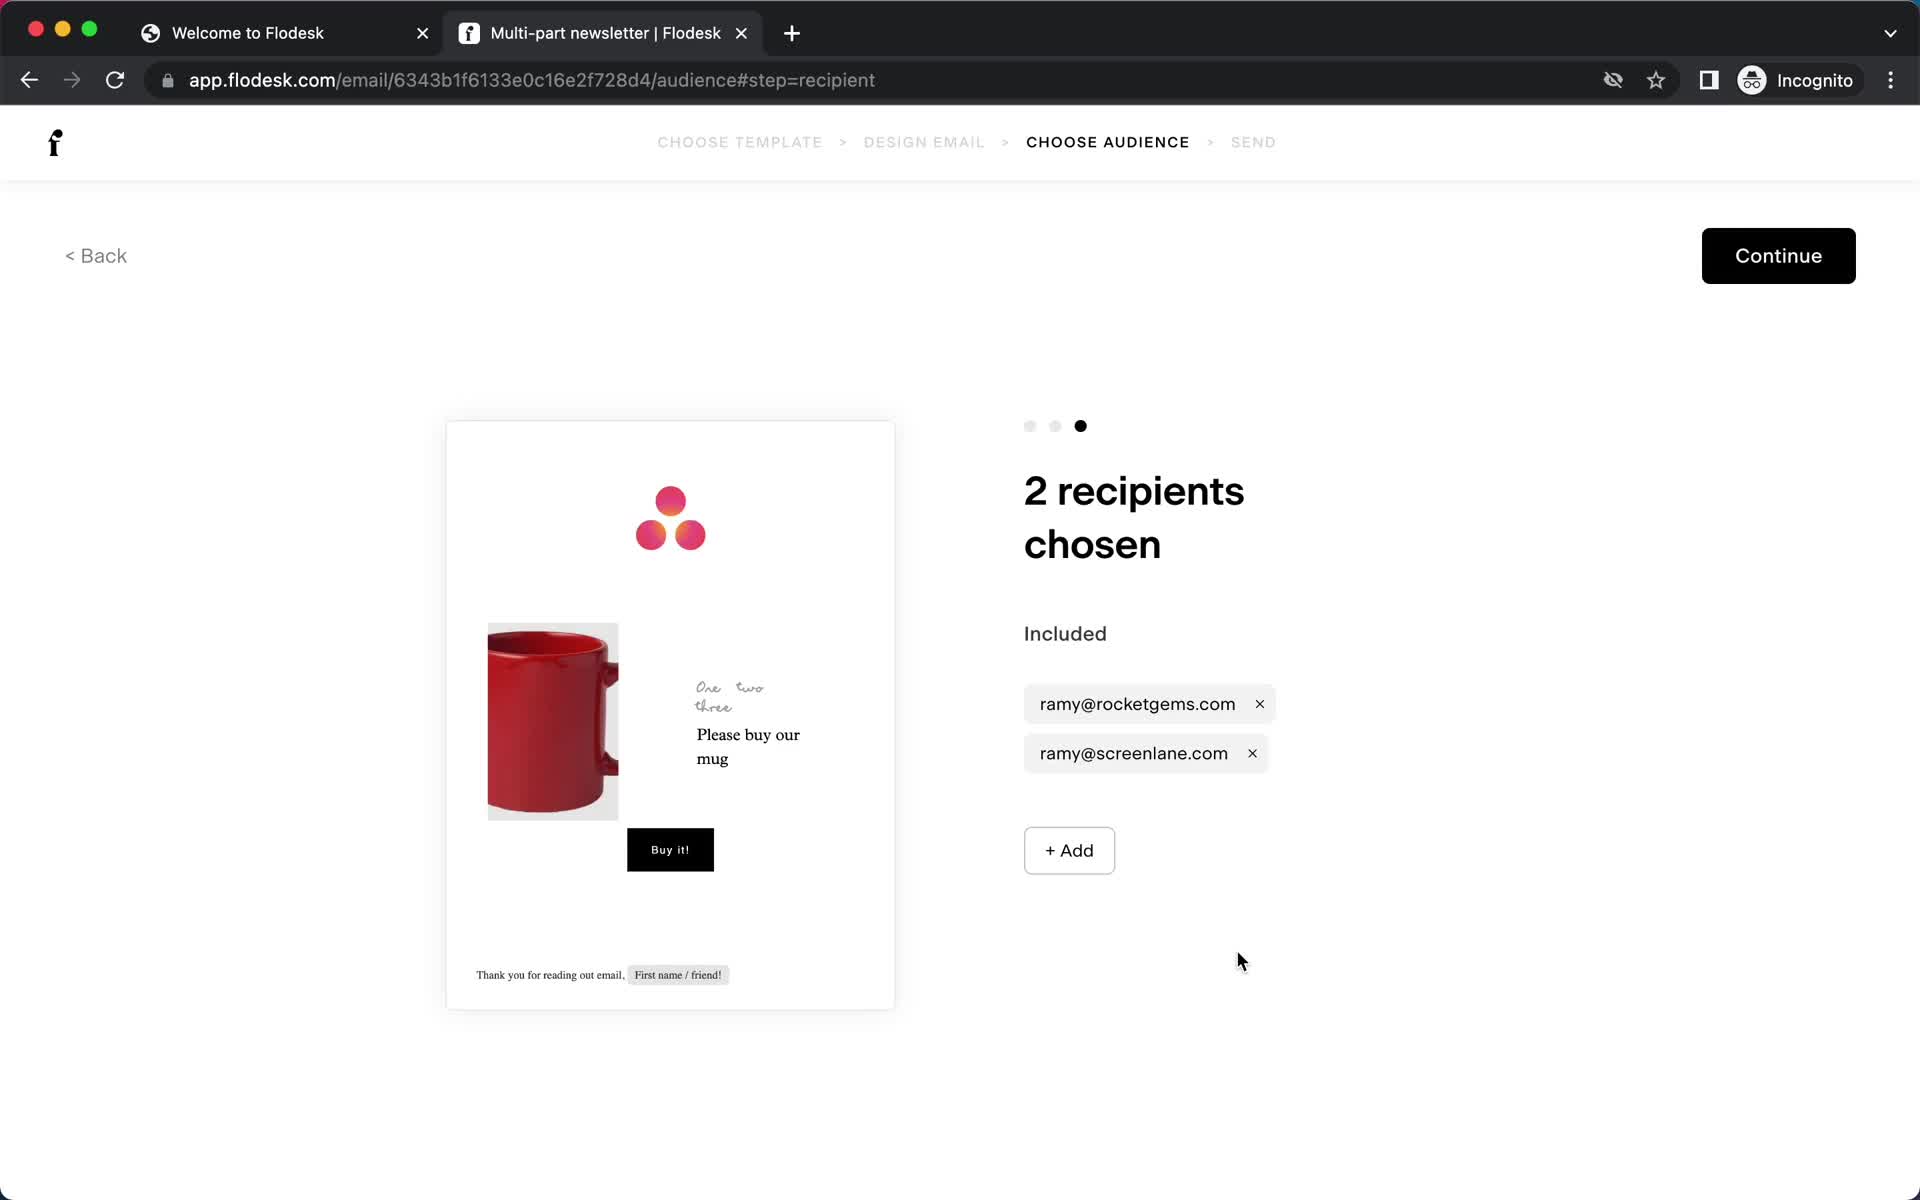
Add recipients
this is title
Send email
this is title
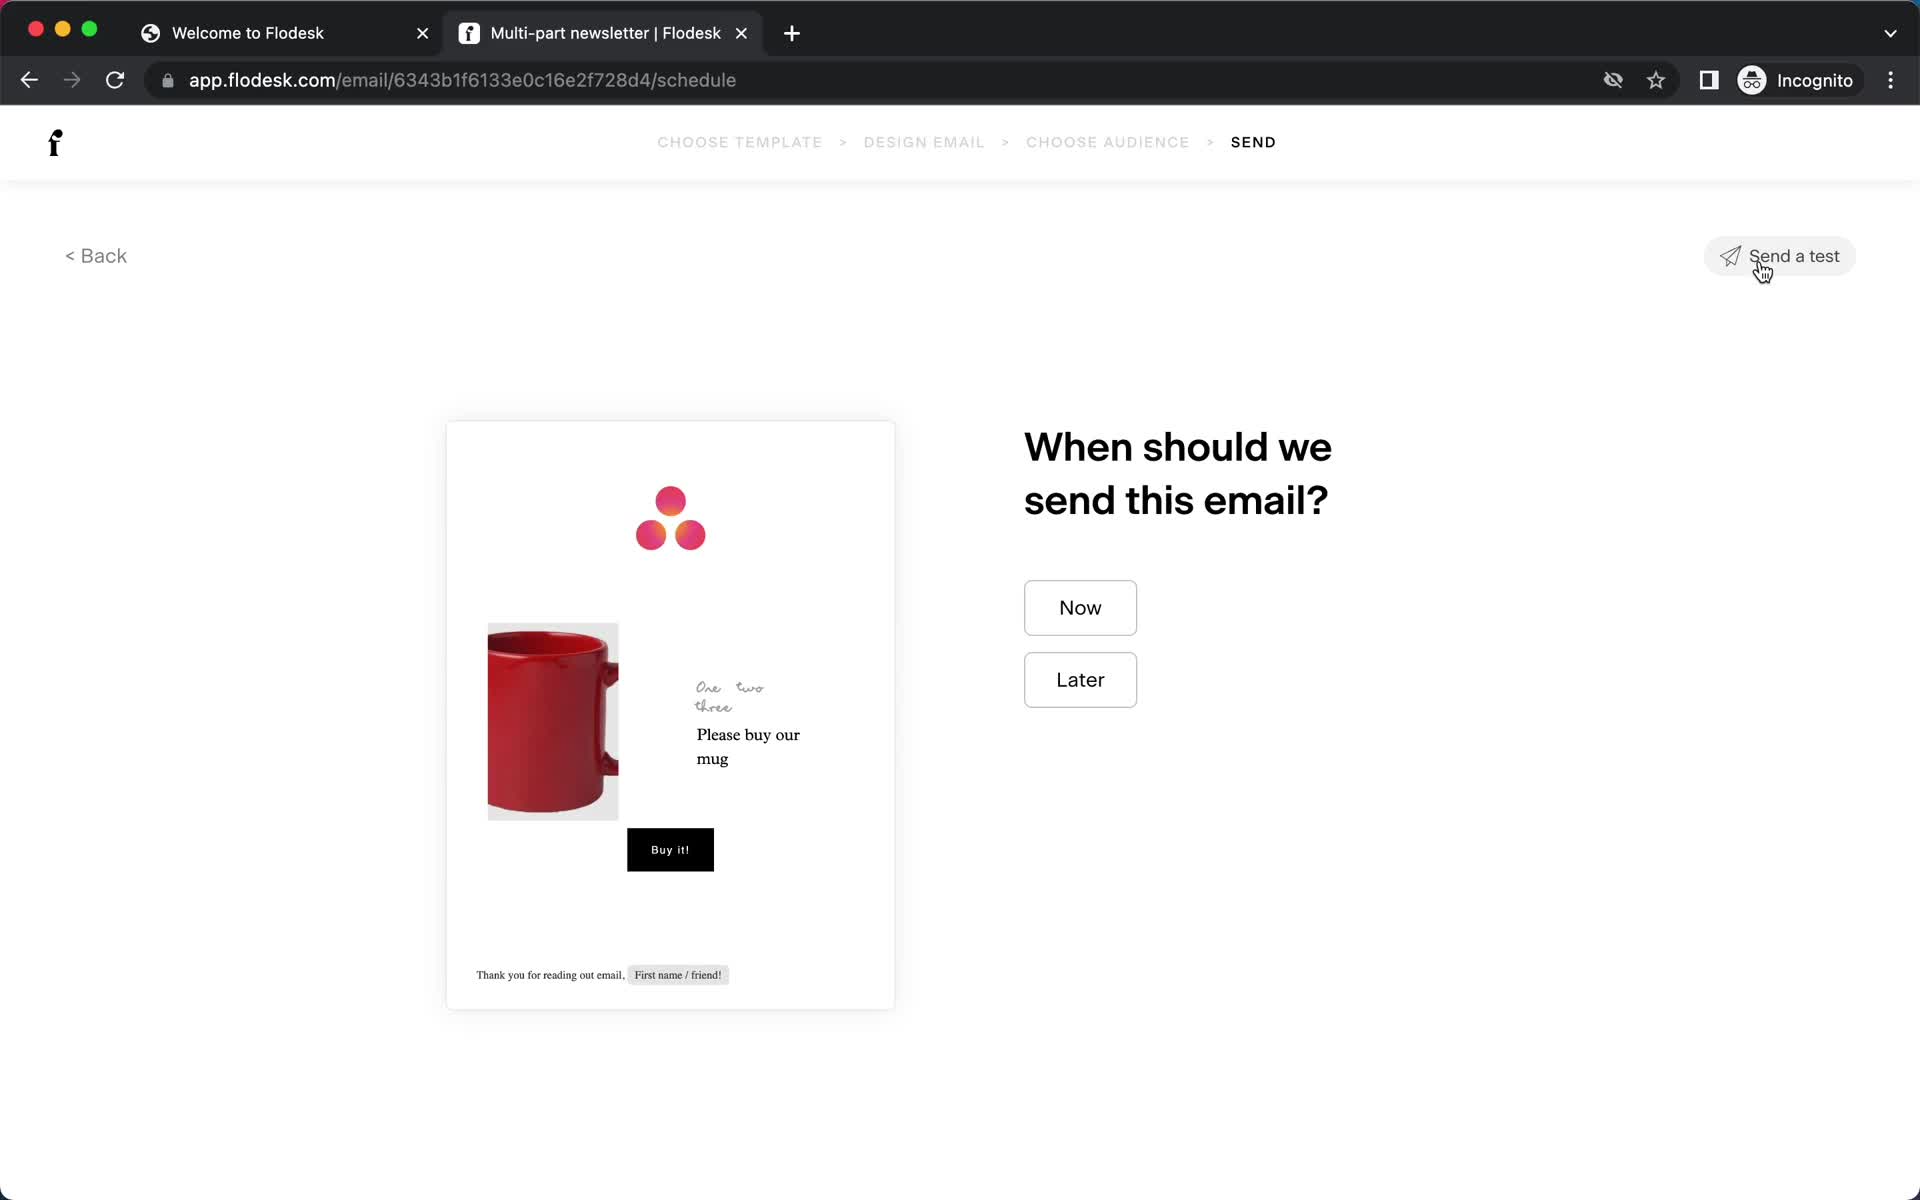
Schedule
this is title
Send email
this is title
Confirm send
this is title
Sending
this is title
Home
this is title