
A flow chart, or a process chart, can prove an incredibly versatile and beneficial tool for many UX designers.
Flow charts make the user’s journey utterly transparent for the entire design team. Without them, designers wouldn’t have the ability to anticipate vital user and task flows. What’s more, without this anticipation, it’s likely that a designer’s user interface would seem too confusing to navigate.
Needless to say, this is the last thing that UX designers want when designing meaningful, user-centric products.
In today’s guide, we’ll help you avoid such pitfalls by exploring how to make a flow chart. Additionally, we’ll address the different types and components of flow charts through the lens of UX design. Last of all, we’ll reveal some of the best flow chart makers currently available online!
What Is a Flow Chart?
If you’ve never heard of flow charts before, then it’s natural to assume that you’ve got multiple questions. The first question you probably have is, ‘What is a flow chart?’
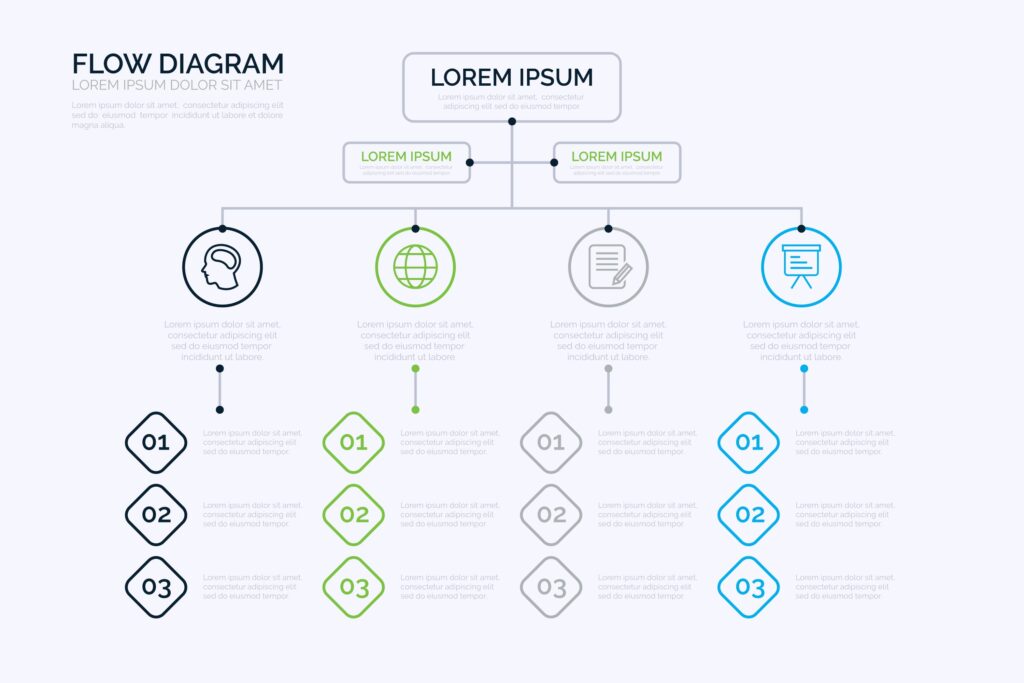
Simply put, a flow chart is a visual representation of the sequence of steps/decisions required to complete a process.
In the context of UX design, flow charts serve as diagrams of user flows and task flows in complex processes.
UX designers often employ flow charts to visualize the user’s interactions with their digital products. What’s more, UX designers also utilize flow charts to present easy-to-follow maps of possible user interactions with stakeholders.
Why Do Designers Use Flow Charts?
In the previous section, we briefly touched on how UX designers use flow charts. However, to truly understand why UX designers use flow charts, we’ll need to explore those reasons in more depth.
Expanding on our previous section, UX designers predominantly employ flow charts to plot how users navigate a product’s user interface. Put differently, flow charts can reveal how you can make a user interface intuitive and easy to progress through.
Of course, when users complete a task, there is often more than one possible eventuality. Flow charts can outline these alternative eventualities so that the user’s journey remains optimized no matter where it starts.

The Components of a Flow Chart
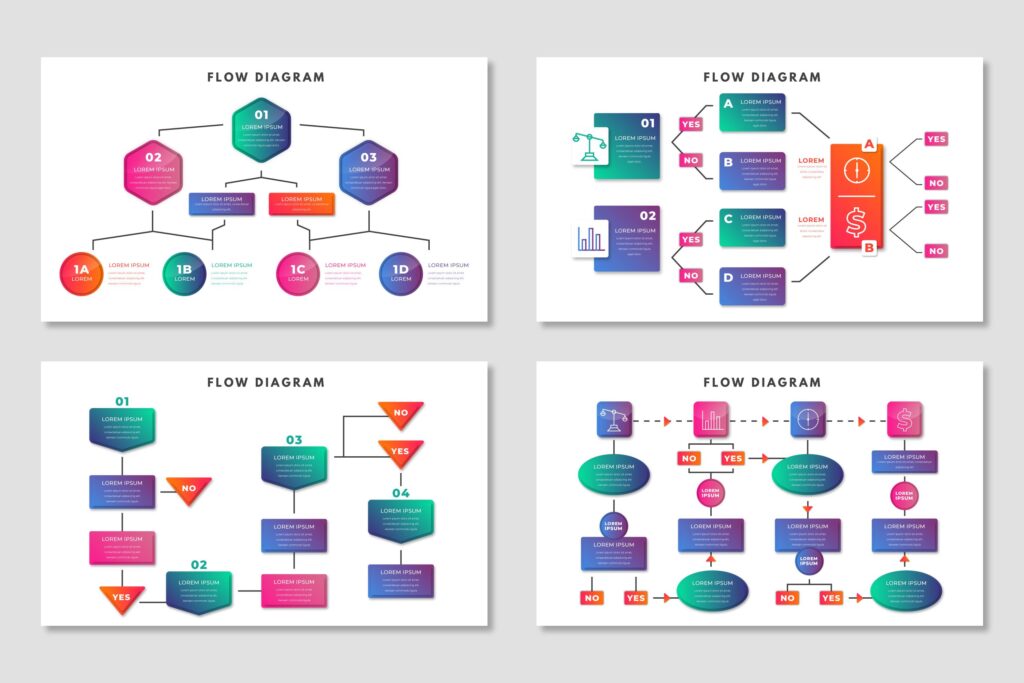
Given that flow charts are highly visual in nature and must appear easy to understand, they consist of standardized components.
These standardized components come in the form of several flow chart symbols. It’s imperative that you know what these symbols represent so that you can read flow charts before you design them.
To help you achieve that goal, we’ve explored the symbols you can expect to see in a flow chart.
1. The Oval Symbol
UX designers use the oval symbol (or terminator) to represent the beginning or end of a process.
For instance, the oval symbol could symbolize the moment the user lands on the homepage of a website.
2. The Rectangle Symbol
Once you’ve started your flow chart, you can expect to use several rectangle symbols. These symbols represent any step in the process that you intend to convey in your flow chart.
Simply put, you use rectangle symbols to symbolize a primary task or action in the user’s journey.
For example, the rectangle symbol could represent the user clicking on a product to view it before purchasing it.
3. The Arrow Symbol
The arrow symbol indicates the directional flow of the user’s route through a digital product.
UX designers implement arrows to guide the viewer along the correct flowcharting path.
4. The Diamond Symbol
The diamond symbol represents a point in the user’s journey where the user must make a decision.
When a user decides to place a product in their online cart, you can expect to see a diamond symbol.
5. The Parallelogram Symbol
In flow charts, parallelogram symbols represent both input and output processes within a digital product.
For instance, you’d see a parallelogram symbol during the user’s journey when they need to input their name/email address.
The Two Types of Flow Charts That UX Designers Use
As previously mentioned, regarding UX design, flow charts are visual representations of user flows and task flows. It’s essential to know the difference between these two types of flow charts that UX designers use.
Before we reveal how to make a flow chart, we’ll address the distinctions between user flows and task flows.

1. User Flows
User flows are charts or diagrams that visualize the route a user will follow while using a digital product. Specifically, user flow charts will demonstrate the steps that a user must take to complete a task.
Given that these flow charts focus on users, designers must anticipate that not every user will follow the same route. Put differently, some users may follow different paths to complete the same task.
It’s worth noting that user flows tend to focus on a particular user persona and entry point. Thus, when using/creating this type of flow chart, expect to see alternative scenarios that start at different points.
2. Task Flows
Task flows are charts or diagrams that visualize a user’s journey through a specific task.
Having read that definition, you may wonder what the difference is between a task flow and a user flow.
Unlike user flows, task flows typically only demonstrate one route that the user will take to complete a task. Task flows don’t provide multiple pathways that a user could take, making them less focused on the user overall.
Given the linear nature of task flows, designers use task flows to analyze a task that all users similarly complete.
When you assume that all users will start from the same entry point, it’s time to create a task flow. Alternatively, if it appears that there is no flexibility in the way users complete the task, create a task flow.
How To Make a Flow Chart: A Valuable Guide
Now that you know the significance of a flow chart, it’s time to learn how to create flow charts.
Below, we’ve provided a simple step-by-step guide to help you learn how to create a flow chart.
1. Researching Your Users
Making a flow chart starts with user research. You must familiarize yourself with your target audience and their needs, goals, and behaviors.
After learning why your users will utilize your products, you can understand how they will use your products.
From here, you can begin to visualize and introduce appropriate entry points.
2. Creating a Flow Outline
Your user research will reveal what information users need and what actions they must take to complete their goals.
This data will act as the crucial points in your flow chart and will allow you to clarify its outline.
Your outline should involve the entry point, necessary steps in the process, and the final direction.
3. Defining Essential Elements
At this stage, you must implement the appropriate symbols that we discussed earlier.
The culmination of your shapes, arrows, and even color-coding will represent the user’s path within your user interface.
Tip: Choose colors wisely to help your fellow designers and stakeholders identify and group elements intuitively. You should also ensure that you have organized your elements logically and consistently to avoid creating a cluttered flow chart.
4. Refining Your Outline
Lastly, it’s wise to produce multiple drafts based on your outline and essential elements.
By doing so, you can evaluate the consistency of the visual structure within your flow charts. You can assess the logic behind your flow charts to ensure that every member of the team can read them.
It’s also a good idea to assess the use of labels that you’ve attached to your shapes and icons. As a result, you can make sure that your labels describe precisely what the user or task flow indicates.
After having completed your drafts, you can share them with your team and stakeholders for feedback and discussion.
Miro vs Lucidchart: Which Diagramming Tool Should You Use?
When it comes to finding the right diagramming software, you’ll often encounter the Miro vs Lucidchart debate.
Both Miro and Lucidchart offer similar diagramming tools that promote collaboration among designers.
However, if you wish to use diagramming software, we recommend that you opt for Lucidchart.
Although Miro flaunts an extensive library of basic shapes and icons, Lucidchart better reflects the needs of a modern designer.
Lucidchart also sports hundreds of shapes and icons, but this feature isn’t what makes Lucidchart stand out. Lucidchart also has a custom shape library, allowing you to create both simple and complex flow charts.
Lucidchart enables you to link live data and use conditional formatting in your diagrams, making it the superior choice.
The Perfect Flow Chart Maker: A List of Flow Chart Tools You Should Use
On the topic of diagramming software, you should know how to find the perfect flowchart maker or flowchart template.
Below, we’ve listed some of the best flowchart makers currently available in the digital landscape.
Flow Charts: A Journey Toward Optimizing Your User Interfaces
Hopefully, what you’ve taken away from this guide is that visualizing the user’s journey is essential.
Only by knowing your users and anticipating their paths can you hope to create intuitive user interfaces.
On the topic of intuitive user interfaces, you’ll need some inspiration to help you create them consistently. Meet Page Flows.
Page Flows works alongside over 1000 popular brands, including Google, Disney, and Booking.com.
What makes us the go-to for design inspiration for such revered brands?
We offer a solid knowledge base for all UX designers, comprised of nothing less than exceptional user flows. Offering over 5,100 recordings, you’ll see how successful brands have carefully considered every step of the user’s journey.
What’s more, we offer design solution inspiration across multiple industries like ASOS and Amazon. Concerning how to make a flow chart, we don’t consider one user’s journey; we consider every user’s journey.
Get started today to access our extensive range of user flow recordings, screenshots, and collected emails!