A business’s success relies on continuous improvements, and such iterative refinement can occur in many different ways. You could develop a brand new business strategy, revamp your team’s work ethics, or enhance your customer’s/user’s experience.
However you wish to improve the essential processes within your business, you’ll need process mapping techniques to do so effectively.
Fortunately, process mapping is the topic of today’s guide. Today, we’ll reveal the definition and purpose of process mapping.
We’ll also address the different types of maps and the basic symbols you can expect to see within them. You’ll also learn more about helpful process mapping software and how to create your map.
By the time you’ve finished reading this guide, you’ll have mastered the art of process mapping.

What Is a Process Map?
You can’t learn how to create a process map (or a process flow) without first learning what they are. So, with that in mind, what is a process map?
Process mapping is a technique that involves visually mapping workflows and essential processes in sequential order. Thus, process maps serve as a visual representation (and a process management tool) that describes and clarifies said workflows.
There are many names for a process map, some of which include the following terms:
- Flowcharts
- Process flowcharts
- Process charts
- Process models
- Workflow diagrams
- Business flow diagrams
- Process flow diagrams
Regardless of which term you use, a process flowchart/map has the same function—to improve efficiency.
Process flowcharts elucidate processes by revealing the people and steps involved. They show a series of events/tasks from the beginning to the end of a process. For this reason, many businesses utilize process mapping techniques to reveal areas of improvement within their internal business processes.
The Purpose of Process Mapping
Simply knowing what a process flowchart is isn’t enough to maximize its usefulness. To get the most out of your process flowcharts, you must understand why so many organizations use them.
Below, we’ve listed some of the reasons that successful businesses employ process mapping techniques.
- They simplify and increase essential communication. With process flowcharts, your teams, key stakeholders, and even clients can gain a better understanding of a process.
- Aside from management, process maps act as handy marketing tools, too. You can use the maps to prove to your investors that your business’s processes are reliable.
- You can use process flowcharts like they were usability testing techniques. Specifically, you can use process flows to test different or ‘what if?’ scenarios.
- Process flows help teams brainstorm ideas and solutions for continuous improvement.
- They make process documentation more straightforward to read and understand.
- You can use the maps to show others how to complete a process quickly.
- They can reduce the costs of product development.
- Process flowcharts define process boundaries, ownership, roles, responsibilities, and measures of effectiveness. These definitions are essential when it comes to business process improvement. Without them, you would find organizing your team and assessing the quality of your processes incredibly difficult.
The Different Types of Process Maps That You Should Know About
Now that you know more about process flowcharts, it’s the perfect time to discuss the different types of process maps.
The type of map you use will produce different outcomes and different areas of reflection and improvement.
To help you determine which map you need to improve your process steps, we’ve revealed different process flows below.
- Flowcharts: A visual map that contains the basic details of a process, including inputs and outputs.
- Detailed Process Maps: As its name suggests, detailed process maps offer much more detailed insights into a process. These maps contain details about sub-processes.
- Swimlane Diagrams: Swimlane diagrams, or cross-functional flowcharts, serve as team management tools that clarify ownership roles within a process. They illustrate how a process flows across a company, making it easier to establish accountability and streamline communication.
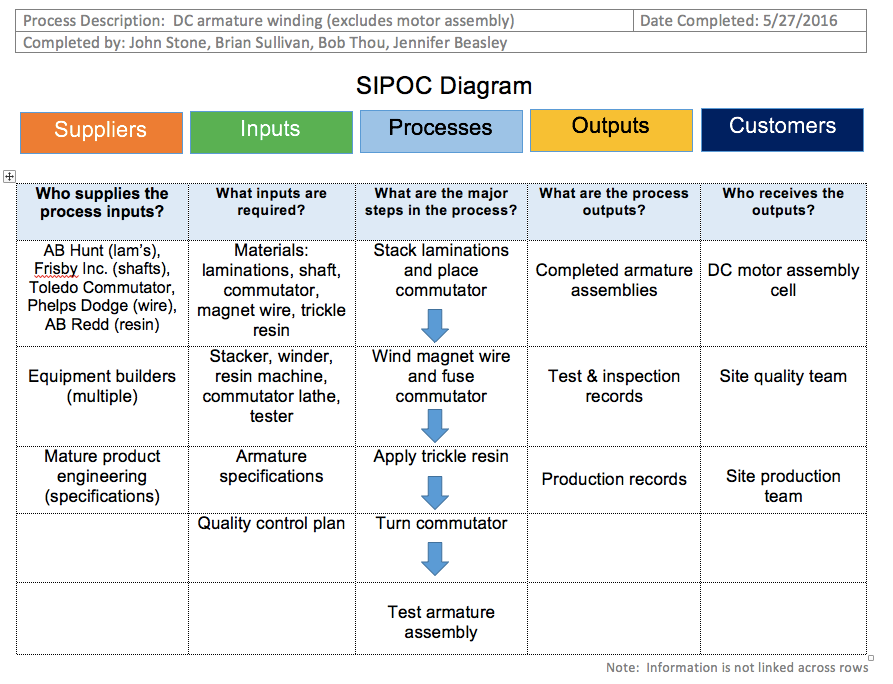
- High-Level Process Maps: High-level process maps provide a ‘macro’ oversight of a process. They involve essential process elements like a Supplier, Input, Process, Output, or Customer (SIPOC).
- Value Stream Maps: A VSM is a management technique that analyzes the processes you need to make a product/service. For this reason, value stream maps are great when you need to refine a process.
- Value-Added Chain Diagrams: Value-added chain diagrams share some similarities with the wireframes you’d see in UX design processes. They contain a series of unconnected boxes that symbolize a simplified version of a value stream map or process.
- Rendered Process Maps: Rendered process maps represent a current process or future process. Thus, rendered maps prove helpful when you need to identify potential areas of improvement.

Understanding Process Mapping Symbols
Knowing about the different types of maps will undoubtedly make understanding them more straightforward. However, what will make using these maps even easier is understanding process mapping symbols.
You should treat process mapping symbols as the building blocks of any process flowchart you use. Every symbol has a particular shape and meaning, each of them representing different elements within the map.
A general rule of thumb when it comes to process mapping symbols is that less is more. If you use too many symbols in your maps, they will become more inconsistent and more challenging to follow.
With that in mind, let’s explore some of the symbols that businesses will commonly use in their process flowcharts.
1. Terminators
Terminators appear as ovals. These ovals indicate the beginning and ending of a process.
2. Process Steps
Many businesses use rectangles to represent an essential activity or task in any given process.
3. Flows
If you’ve ever seen a user flow or a task flow, then you’ve undoubtedly encountered a series of arrows.
Arrows represent a connection between the chronological steps in a process. They emphasize the directional flow of the user’s interaction with your product/service.
4. Decisions
Diamond symbols illustrate a point in the process where the user/customer needs to make a decision.
You can expect to see ‘Yes’ or ‘No’ options branching from this part of your map.
5. Delays
With regard to delays, you should expect to see D-shaped symbols or rectangles with one rounded end.
These D-shaped symbols represent a pause in the process before the flow proceeds.
6. Documents
Simply put, a document is something that your users/customers can read.
You can represent documents by using a rectangle with a wavy bottom line instead of a straight line. Expectedly, several stacked wavy rectangles indicate the incorporation of multiple documents.
7. Data
The parallelogram symbol represents a data’s value as it enters or exits a process.
Put differently, parallelograms symbolize data that is an input or output of a process step.
8. Manual Inputs
There are some forms of data that your users/customers must manually enter.
To symbolize this occurrence, you should use a rectangle with a slanted top line.
9. Sub-Processes
A sub-process is a separate process consisting of various smaller processes.
Sub-process symbols inform your team members that more than one step is occurring at a particular part of the process.
You should use a rectangle with two vertical lines going through it to indicate a sub-process.
How To Create a Process Map
Now, you’re ready to learn how to create a process map.
Below, we’ve provided a simple step-by-step guide to help you create consistent and easy-to-follow process flows.
1. Identifying a Problem or Process to Map
First, you must determine which process you wish to visualize. See if there is an inefficient process that needs improvement. Evaluate any new methods that you’d like to communicate with your team concisely.
Once you’ve found the process, give it an appropriate title.
2. Listing the Necessary Activities
List all of the tasks and activities that you require to complete the process. You should also document who is responsible for each task/activity.
At this stage, sequencing the steps isn’t crucial.
3. Clarifying the Sequence of Steps
Now, you can arrange your listed activities in the appropriate sequential order.
Make sure that you’ve represented the process from beginning to end, and look for any steps you may have missed.
4. Drawing Basic Flowchart Symbols
From here, you should select the appropriate type of map, like the ones we discussed earlier.
Illustrate the process using the correct symbols for your process, including the ones we mentioned in this guide.
5. Finalizing Your Map
After you’ve drawn your map, review it alongside your stakeholders to ensure everyone involved understands the process.
6. Analyzing Your Map
Once you’ve established that your map accurately represents the process workflow, you can start to analyze it.
Utilize the feedback from your team and stakeholders to identify areas of improvement. Once identified, you can begin to fix them and redraw your newly improved process map!
Process Mapping Tools That You’ll Find Useful
There is an abundance of process mapping software available to help you create understandable process flowcharts. We recommend that you experiment with a few to find the right process mapping tools for your organization.
To point you in the right direction, we’ve provided a list of some of the best process mapping tools.
Process Mapping Examples: Finding the Perfect Inspiration
To help you further, we’ve also provided some process mapping examples below.
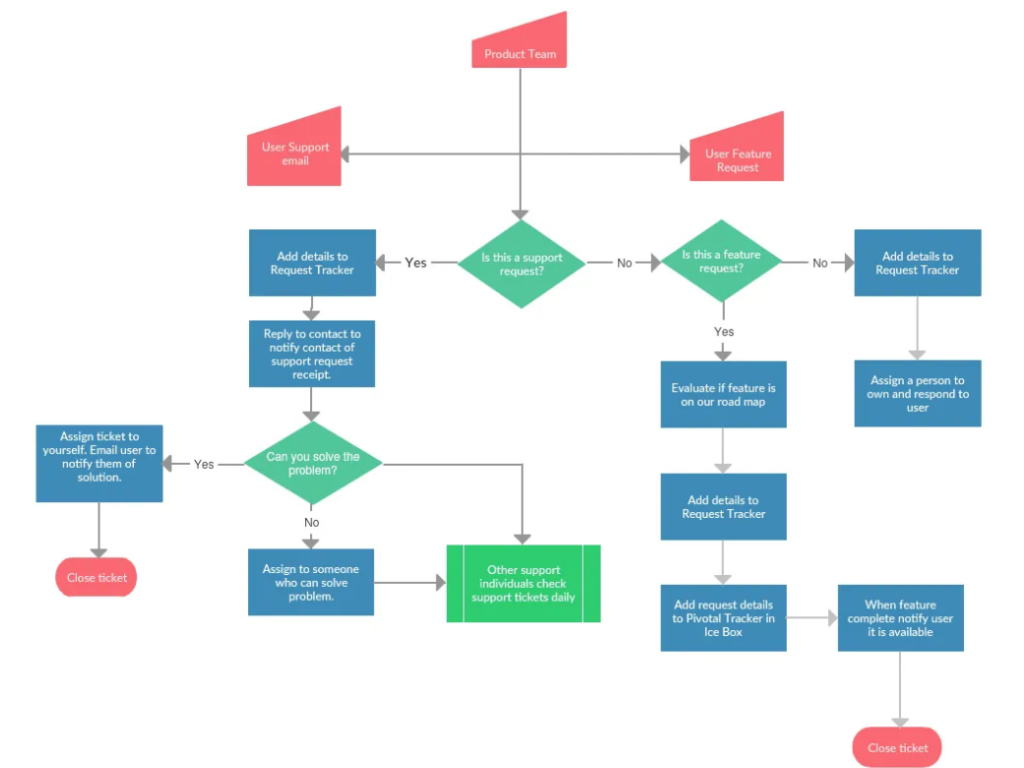
1. A Detailed Process Map Example
Below is an example of a detailed process map.
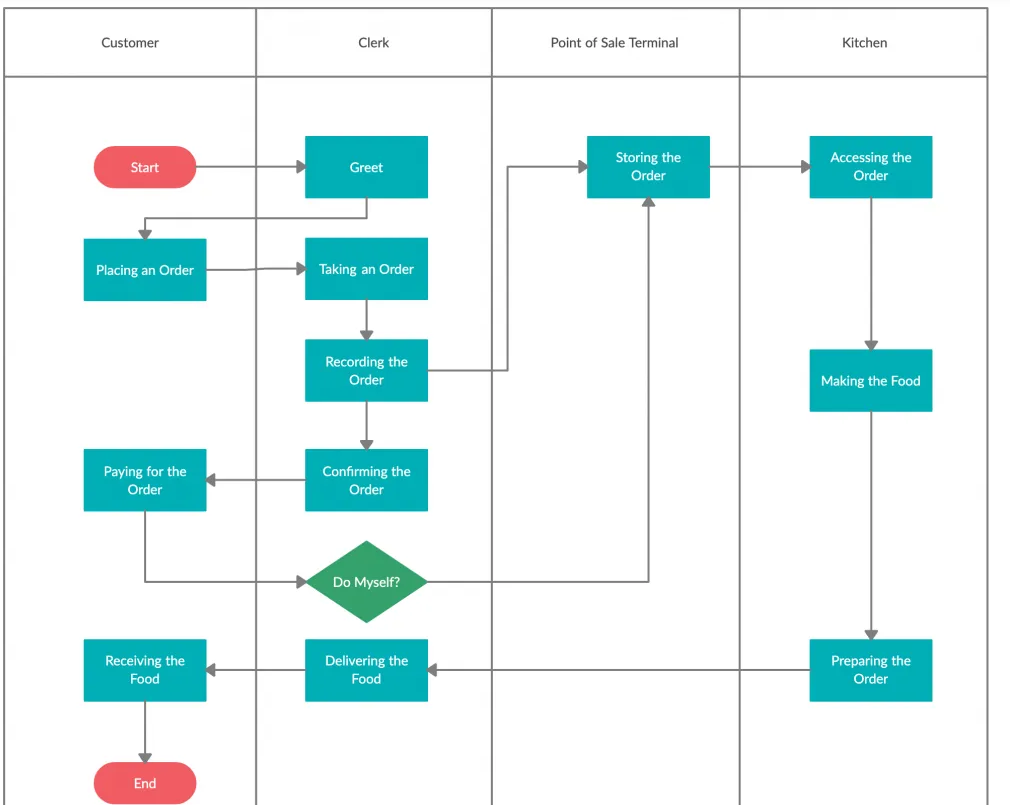
2. A Cross-Functional Process Map Example
We’ve also provided an example of a cross-functional map.
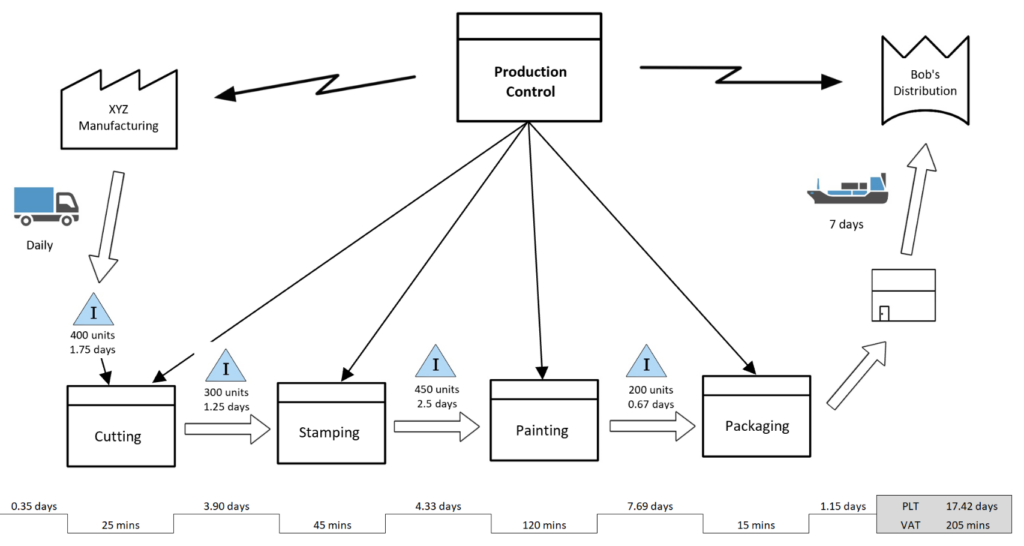
3. A Value Stream Map Example
The image below is an example of a value stream map.
4. A SIPOC Diagram Example
Lastly, we have a detailed example of a SIPOC diagram.
Process Mapping: Concluding Thoughts
Hopefully, after having read our guide, you will feel more confident when creating process flows.
The most important thing is that whatever process you map, you always look for areas of improvement. Whether you enhance your team’s collaborative practices or refine your users’ experiences, always make your business’s processes more efficient.
Speaking of efficient processes, why not learn from proven products and successful user flows? Consider Page Flows.
We offer valuable knowledge derived straight from the success of products we’ve worked with. From Disney to Google to Booking.com, we know how to enhance the user’s journey regardless of industry!
Without clogging up your inbox, you can learn what compelling user flows look like. From onboarding to upgrading, you’ll learn how to make even the most common interactions incredibly engaging.
Best of all, we collect tens of thousands of screenshots and emails when we record user flows. With such resources at your disposal, you can never go wrong!
Like the best process mapping techniques, we practice consistency and reliability, meaning you will always have inspiration with Page Flows!
Get started today to access our abundance of user flow recordings, screenshots, and collected emails.